DOT/USDT Buy | S6T3 | Team Trading Contest Post for Reminane


About Polkadot
This Polkadot connects different blockchains.
This blockchain platform is one of the most valuable platforms that seem to complete transactions very fast and secured as well.
The Polkadot is one of the newly developed blockchain platforms which is highly scalable and very simple to use.
Just like many other blockchain platforms, the Polkadot has its native token which was built for the transaction fees.
Since the Polkadot uses the proof of stake consensus algorithm, the token is locked in the liquidity pool to be used as transaction gas fees.
And due to how the entire Polkadot block is performing, the price of the DOT is rising significantly and continues to flourish.
Price chart about Polkadot
.png)

Technical analysis about Polkadot
I would make technical analyses on both longer and shorter timeframes. It is always advisable to make a complete analysis before you enter into trade.
Analysis with 4-hour timeframe
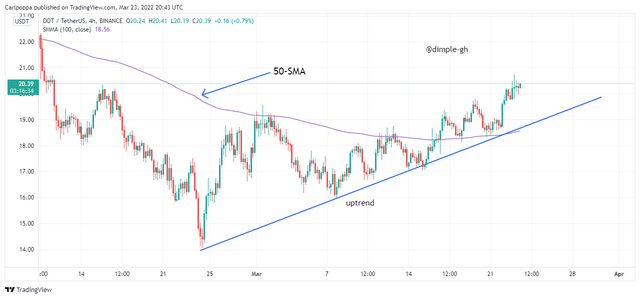
The chart above is the 4-hour timeframe of Polkadot. The price chart is currently showing bullish movements. The market forms higher highs and higher lows.
We placed the 50-SMA to identify the current trend of the chart. To our surprise, the price falls above the moving average which indicates that there’s a new bullish trend reversal.
The trendline and the moving average met at the beginning of the reversal. This is a good indication that the trend is valid.
Analysis with 2-hour timeframe
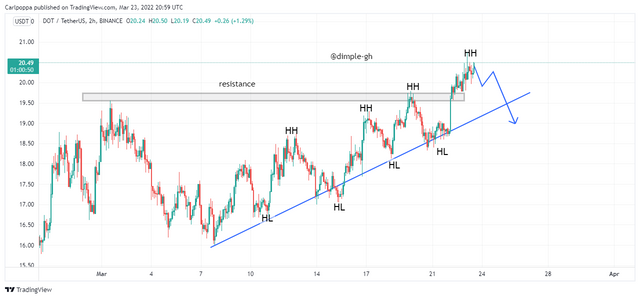
According to the chart above, the price is forming higher highs and higher lows. This is to say that the market is in a bullish trend.
With the bullish market, we trade with a break and retest strategy. But looking at the chart above, the price has broken above a resistance level. When such price movements happen, the price is not likely to retest and break below the resistance again.
Hence, we can say the bullish trend is still on. According to the price behavior currently.
Analysis with 30-mins timeframe
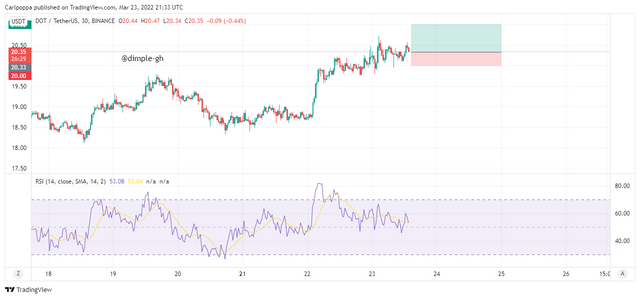
Smaller timeframes are taking trade signals.
Looking at the chart above, we took a buy entry.
This is because, according to the 2-hour timeframe chart, the price has broken above a strong resistance level which means, the resistance would turn the new support level if we want to take trades.
Talking of which kind of trade we should enter, (buy or sell trade), we learned from the previous charts that, the market is in a strong bullish momentum which means we would take buy entries.
The RSI also stays above the 0 level which also indicates buying signal.
We place the stop loss below the new support level (the previous resistance) and set a take profit ratio with a favorable risk-reward.
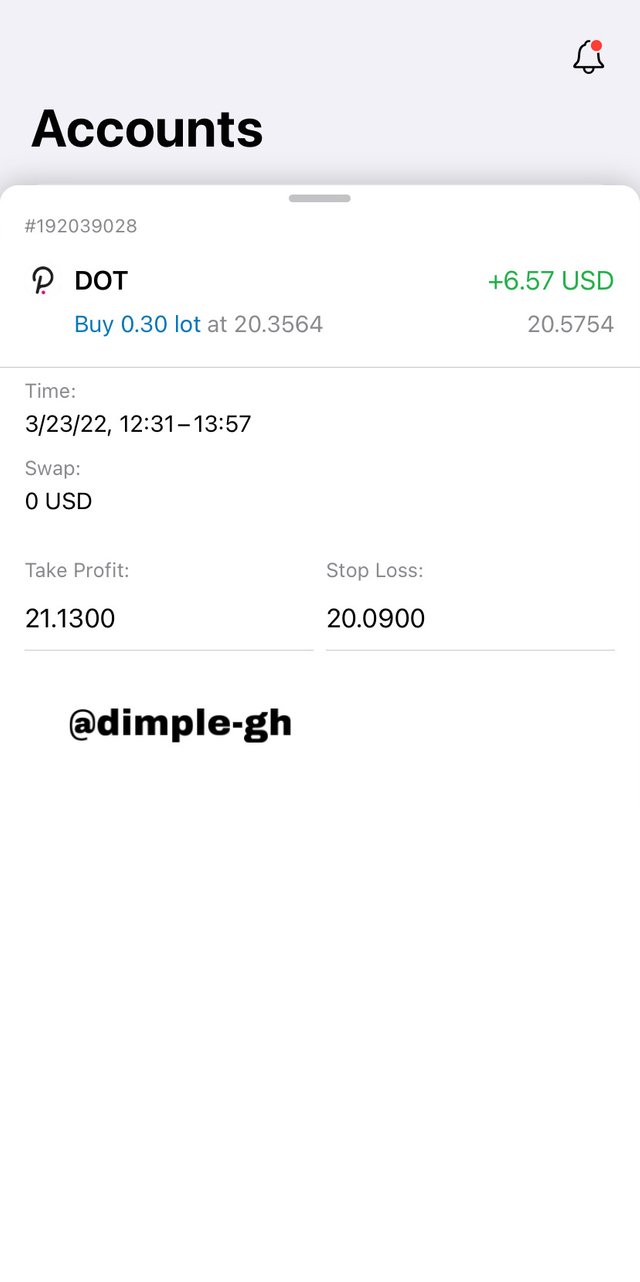
Screenshot from meta trader
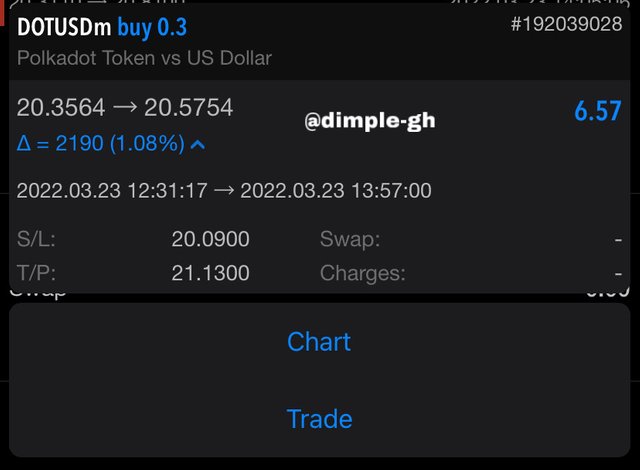
Trading in Exness broker account
Conclusion
Today, I made some good profits. I closed the trade as some few pips profits this is because is used good risk management. Talking from price movements, I could have made more profits if I had waited to take profits.
However, the price could have retraced back to probably stop loss. That’s why is very good to take partial profits when necessary.