Steemit Crypto Academy Season 3- Week 7 | HOMEWORK for professor @lenonmc21-Analysis and Trading with the indicators "Stochastic Oscillator +" Parabolic SAR " By @dilchamo

Theory (No images)
1.Define in your own words what is the Stochastic Oscillator?
2.Explain and define all components of the stochastic oscillator (% k line,% D line + overbought and oversold limits).
3.Briefly describe at least 2 ways to use the Stochastic Oscillator in a trade.
4.Define in your own words what is Parabolic Sar?
5.Explain in detail what the price must do for the Parabolic Sar to change from bullish to bearish direction and vice versa.
6.Briefly describe at least 2 ways to use Parabolic Sar in a trade?
Practice (Only Use your own images)
1.It shows a step by step on how to add the Stochastic Oscillator to the chart (Indicating the% k Line and the% D Line, the overbought and oversold zone.
2.Show step by step how to add Parabolic Sar to the chart and how it looks in an uptrend and in a downtrend.
3.Add the two indicators (Stochastic Oscillator + Parabolic Sar) and simulate a trade in the same trading view, on how a trade would be taken.

Define in your own words what is the Stochastic Oscillator?
Stochastic oscillator is an indicator that was developed in 1950s which indicates the closing price of a security to a range of price over a certain time period. It measures the relationship between asset’s s price movements. Stochastic indicator is a favored technical indicator because it has a high degree of accuracy it pretending whether is a buy or sell time. Stochastic are used to show the movement of a stock overbought or oversold position. Stochastic oscillators rely on an asset’s price history. It can generate signals by utilizing 0-100 bounded range of values. The idea given by stochastic oscillator is that when the price of a security increases the closing price will fall closer to the highest high over a given period. When the price decreases the closing price will fall closer to the lowest low. So it determines the best entry and exit points of a trade.
Explain and define all components of the stochastic oscillator (% k line,% D line + overbought and oversold limits).
%K and %D lines
Stochastic is calculated using some mathematical calculations. It is measured with two lines as %K and %D.
The formula for %K is:

CP=Most recent closing price
L14=Lowest price of the 14 previous trading sessions
H14=Highest price of the same 14 previous trading sessions

The formula for %D is:

H3=Highest of the three previous trading sessions
L3=Lowest price traded during the same three-day period
The K line is faster than the D line. The user has to watch as the D line and the asset price change and move into overbought or oversold positions. When the indicator moves above 80 levels the investor decides selling the stock. And when the indicator moves below 20 levels the investor decides buying assets.
In an upward trending market, the prices will close near the higher highs. And in downward trending market the prices will close near the lower lows.
The two indicator lines are used to identify the overbought and oversold readings. These overbought and oversold levels are useful to identify the market trends of a certain asset.
MOMENTUM
Momentum is the rate of acceleration of the price of an asset. The idea of stochastic indicators is that the momentum of the price of an asset will often change before the price movement of the asset actually changes the direction. The indicator can be used to examine trend reversals.
Overbought and Oversold
Traders define that the price is overbought when the stochastic is over 80. The stochastic is below 20 it is defined as oversold. It overbought the trend is strong and it doesn’t mean that the price immediately reverse. There are situations where overbought and oversold remains for some time without changing.
Traders look for a place to buy an asset when they notice it is oversold. A buy signal is given when the stochastic indicator is below 20 and it rises above 20. On the other hand traders sell and asset when they notice the asset is overbought. A sell signal is given when the indicator is above 80 and falls below 80. In simple terms, overbought and oversold means the price is trading near the top or bottom of the range.
Briefly describe at least 2 ways to use the Stochastic Oscillator in a trade.
The stochastic oscillator is used in bullish and bearish trends. To indicate the market price trend the SO indicator can be used.
Stochastic oscillator charting generally consists of two lines. One line will reflect the actual value of the oscillator for each session and the other line will reflect its three-day simple moving average. Because price follows momentum, the intersection of these two lines is considered to be a signal that a reversal may occur, as it indicates a large shift in momentum.
In an upward trending market the closing price will mark in higher highs and in downward trending markets the closing price remains in lower lows. After the intersection of the lines there will be a trend reversal so that investors can think twice before buying or selling.
It is not good to depend on one indicator. They should consider few more indicators to come into conclusions before investing in assets.
Define in your own words what is Parabolic SAR?
The parabolic SAR is an indicator which was developed by J. Wells Wilder. It is used to determine the trend direction and potential reversals in price. The indicator uses a stop and reverse method called “SAR” which determines the suitable exit and entry points. It determines the future short term momentum of an asset.
The parabolic SAR indicator appears as dots in a price chart above or below the asset price. A dot is placed below the price when it is trending upward and the dot is placed above the price when the price is trending downward.
Formula of Parabolic SAR

RPSAR = Rising PSAR
AF = Acceleration Factor, it starts at 0.02 andincreases by 0.02, up to a maximum of 0.2, eachtime the extreme point makes a new low (fallingSAR) or high(rising SAR)
FPSAR = Falling PSAR
EP = Extreme Point, the lowest low in the current downtrend (falling SAR) or the highest high in the current uptrend (rising SAR)
Traders will choose to place their stop loss orders at the SAR value, because a move beyond this will signal a reversal, causing the trader to anticipate a move in the opposite direction. In a sustained trend, the parabolic SAR is far enough removed from price to prevent a trader from being stopped out of a position on temporary retracements that occur during a long-term trend which enables the trader to ride the trend for a long time and capture substantial profits.
Explain in detail what the price must do for the Parabolic SAR to change from bullish to bearish direction and vice versa
Parabolic SAR uses dots to indicate the price reversal of cryptocurrency. The dots are placed above and below candle sticks to determine the price trend. If the dot is placed below the candle it determines about a buying signal which means there will be an upward trend. When the trend or the price changes the dot changes its position and goes to the above of the next candlestick. It gives the selling signals or bearish trend signs. So with the movement of the price the pattern of dots will change from below to above.
This may sometimes change because sometimes the dots will move from above to next above or from below to next below. So it is up to the investors not to fully rely on one indicator. Traders should tally the Parabolic SAR with moving averages to get a detailed determination of the price trend. There are calculations to find the PSAR values for uptrend and downtrends as below.
PSAR= Prior PSAR + Prior AF (Prior EP – Prior PSAR); for uptrends
PSAR= Prior PSAR – Prior AF (Prior PSAR – Prior EP) for downtrends
Briefly describe at least 2 ways to use Parabolic SAR in a trade
There are two ways to use parabolic SAR in a trade.
Bullish Trend
In a bullish trend the Parabolic SAR indicator is positioned below the price. There is a series of dots below the candlesticks until it turns the trend reverse. Immediately when the price changes the trend the dots will move above from the next candlestick.
Bearish Trend
In the bearish trend the Parabolic SAR indicator is positioned above the price. The series of dots will be above the candlesticks. When the price changes the trend then the dots will move below the candlesticks as the trend reverse.

It shows a step by step on how to add the Stochastic Oscillator to the chart (Indicating the% k Line and the% D Line, the overbought and oversold zone
First log into Tradingview.com. Then click on charts.

When you click on to charts you can see the price chart. You can select any cryptocurrency pair of your choice and click on “Indicators and strategies.”
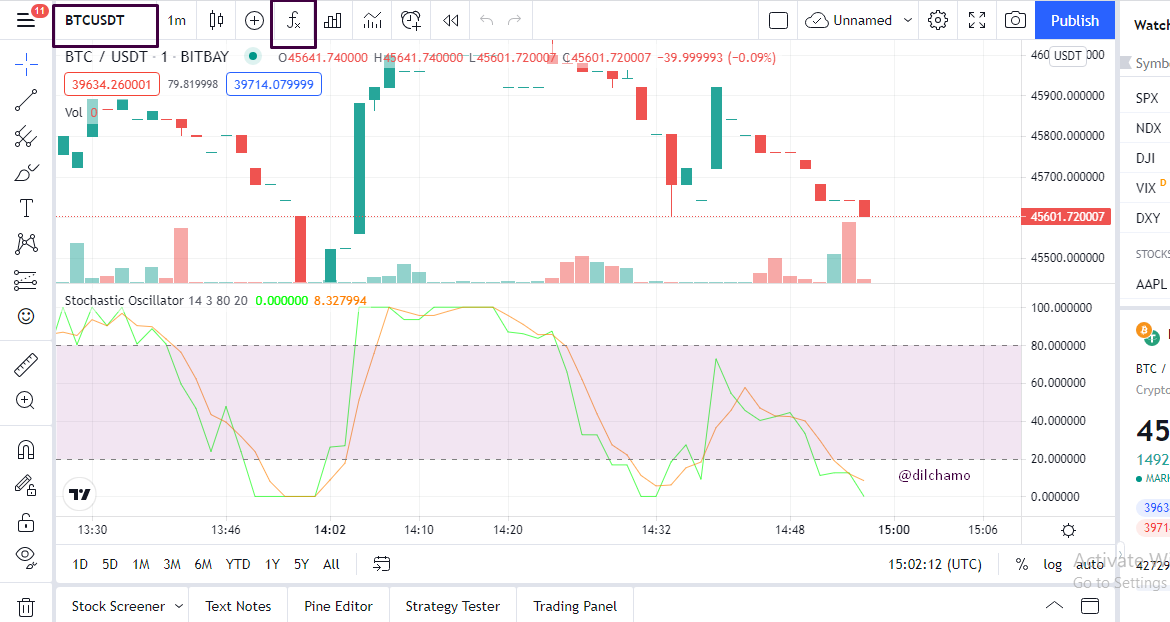
You can type and search “Stochastic Oscillator”. Then you will get the stochastic Oscillator indicator lines below the price chart.

As you can see in the below screenshot the D line and K line are indicated clearly to give an idea about the price movement. The two lines are displayed in green and red colors. The green line is the %K line and the red line is the %D line in my chart.
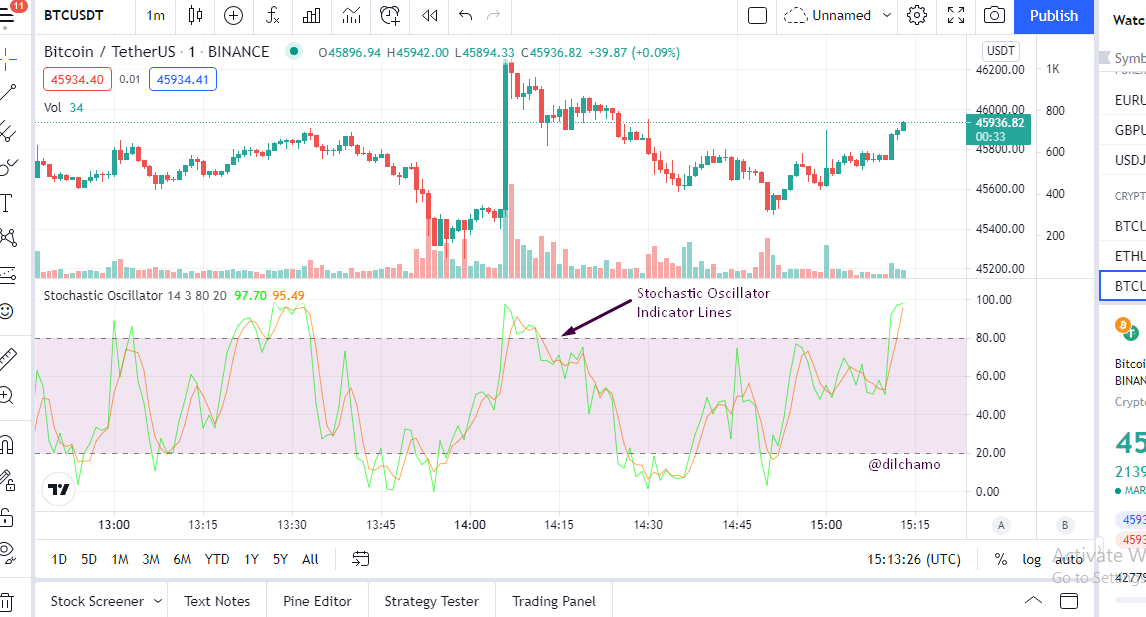
When the green line moves up it gives a buy signal and when the red line goes up it gives a sell signal. After intersections the price reversals are clearly shown in the screenshot above.
You can then change it settings by clicking on the “Indicator bar” which is on the Stochastic Oscillator and click on settings. Then you can change the settings. The default length is given as 14 days but it can be changed.
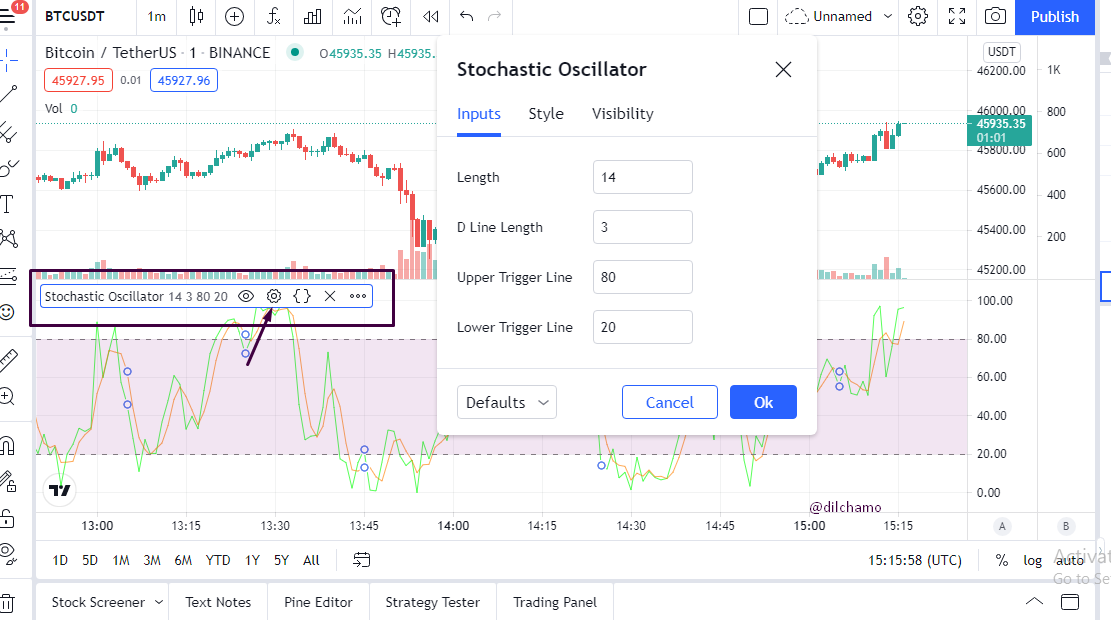
The below screenshot denotes the %D line, %K line and the overbought and oversold zone in the selected time frame.

Show step by step how to add Parabolic SAR to the chart and how it looks in an uptrend and in a downtrend
First go to Tradingview.com and click on charts.

Then you can select the cryptocurrency pair that you like and click on “Indicators and strategies.”

Then in the search bar type and search “Parabolic SAR” strategy.

Now you can see how it is applied to the price chart.

I will show you that with another parabolic SAR strategy.

Add the two indicators (Stochastic Oscillator + Parabolic SAR) and simulate a trade in the same trading view, on how a trade would be taken
Here I have added both Stochastic Oscillator and the Parabolic SAR to the same trading chart of BTCUSDT cryptocurrency pair. You can clearly see how the two indicators are moving with the movement of price. I have selected two places to perform my buying decision and selling decision.
As you can see in the screenshot below I have decided to buy at the spotted position as the stochastic oscillator lines intersect at an oversold position. The parabolic indicator dots are below the candlesticks giving the buying signal.
In the overbought position of the stochastic oscillator, I decide to sell my assets. The parabolic SAR dots are above the candlestick giving the selling signal.

CONCLUSION
Stochastic Oscillator and Parabolic SAR are two different indicators used to determine the price trend of a cryptocurrency. Traders use these indicators to examine the insights of an asset they would be willing to invest on. As we all know is not good to fully rely on one technical indicator. From this lesson it is very clear that trade analysis by combining two different indicators will let the trader to get a clear idea of the price trend and invest accordingly on the crypto asset. Thank you professor @lenonmc21 for teaching this amazing combination of indicators.

Dear friend , you explained very well.
Thank you.