Steemit Crypto Academy Season 3 Week 4 - Beginner's Course | HOMEWORK-Candlestick Patterns by @dilchamo
Entire Question
Homework Tasks
1.In your own words, explain the psychology behind the formation of the following candlestick patterns.
• Bullish engulfing Candlestick pattern
• Doji Candlestick pattern
• The Hammer candlestick pattern
• The morning and evening Star candlestick pattern.
2.Identify these candlestick patterns listed in question one on any cryptocurrency pair chart and explain how price reacted after the formation. (Screenshot your own chart for this exercise)
3.Using a demo account, open a trade using any of the Candlestick pattern on any cryptocurrency pair. You can use a lower timeframe for this exercise.(Screenshot your own chart for this exercise).

Psychology behind the formation of candlestick patterns
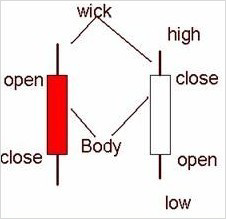
In cryptocurrency trading price charts are used. In these price charts there are different candlestick patterns. There are four main parts in a candlestick as: Open, Close, High and Low which demonstrates about the market function. The body of the candlestick represents the range of price.

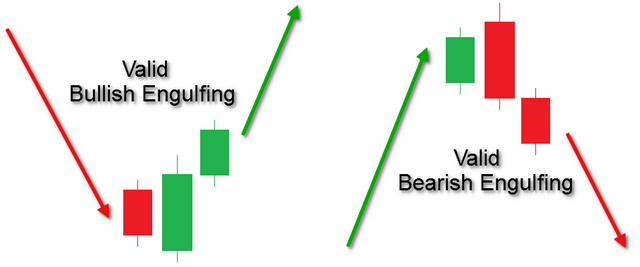
In a price chart with candlesticks there are two bars which are used to indicate the market reversal. These two bars build up an interconnection as such; the second candlestick will be larger than the first candlestick. The second candlestick covers the length of the first candlestick. It is known as “Engulfing Candlesticks.” Engulfing candles are used to measure the market in experiencing upward or downward pressure. There are two types of Engulfing candlesticks as Bullish Engulfing Candlesticks and Bearish Engulfing candlesticks.
Engulfing candlestick Patterns
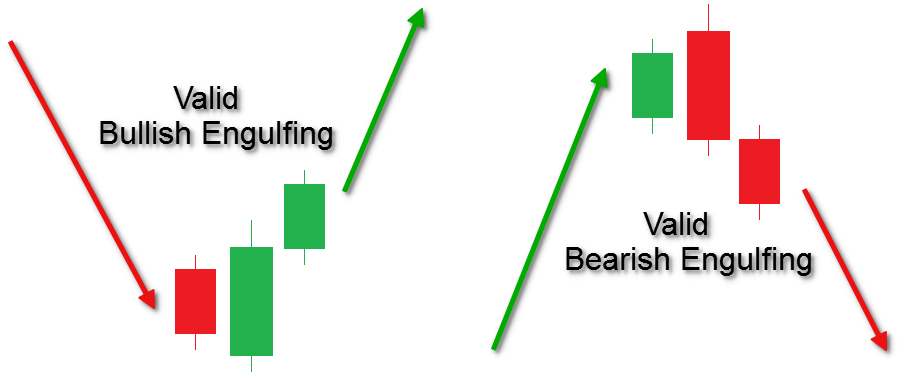
Bullish Engulfing Candlestick Pattern
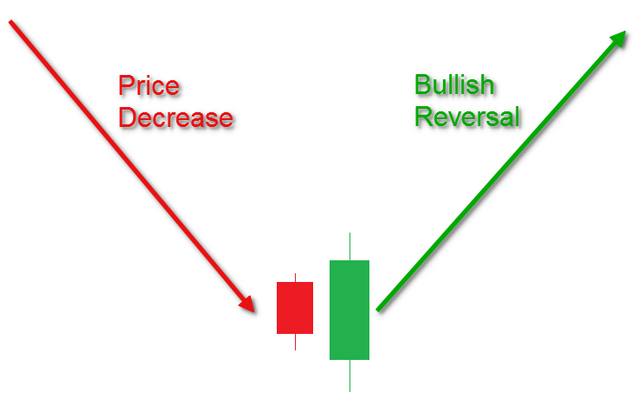
Bullish Engulfing patterns can be seen in a downtrend. It is a short candle which is next to a larger candle. The first candle gets fully engulfed by the body of the second candle. The second candle creates a bullish potential on the chart. A strong bullish candle will creates a bullish trend. The second candle might be twice the size of first candle. The image below shows a bullish engulfing candlestick pattern after a downtrend.
A bullish candlestick demonstrates that the buyers are in full control and it gives a signal to traders to take advantage of the market reversal. In an engulfing pattern the wicks of candlesticks are not important as bodies. The second candle shows the minimum price someone is willing to accept exchanging an asset. This pattern is important to look at the previous candle and to confirm the price action.
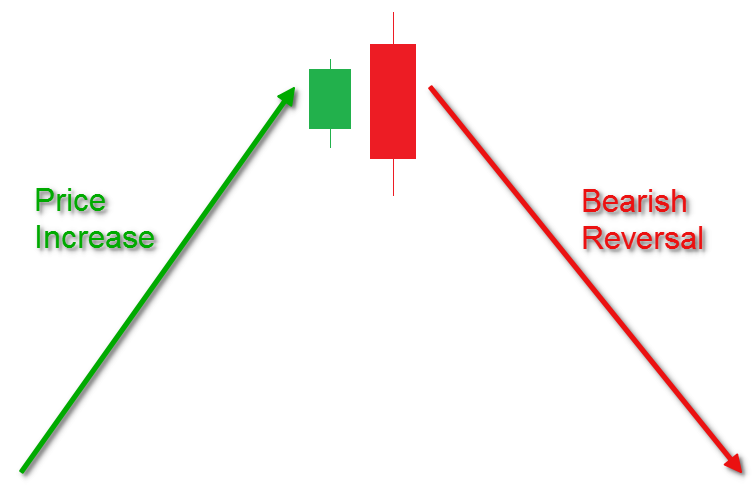
Bearish Engulfing Candlestick Pattern
Bearish engulfing candlestick pattern can be seen in an uptrend. As you can see in the image below, the bullish candle is fully engulfed by the bearish candle. This show the bulls were in charge of the market. That means it is a bearish pressure pushing the market price lower. A strong bearish candle will create a bearish trend. The pattern starts with a bullish candle covered by a larger bearish candle. This creates the existing bullish trend into a bearish trend. A bearish engulfing pattern tells that the market is about to face a downtrend.

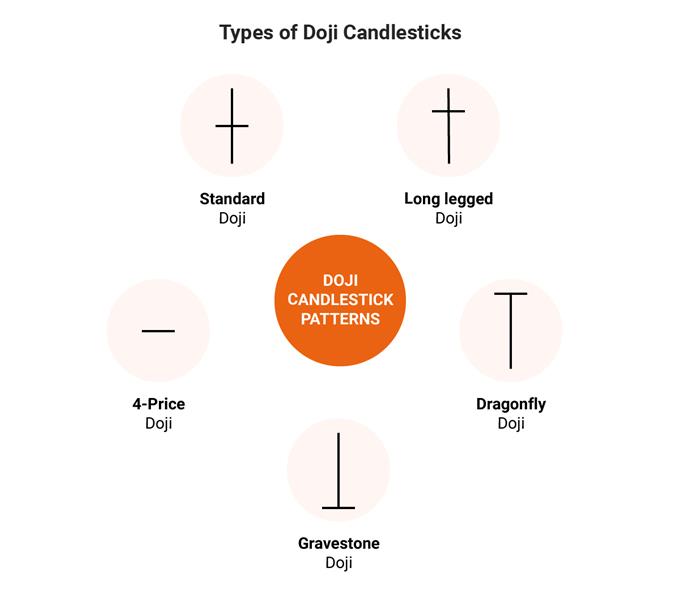
Doji Candlestick pattern
Doji candlesticks are commonly used to in price charts as it clearly represents and guide the traders about the place that they should place their stop. They wicks show this very clearly. There are few most commonly used Doji patterns.
In a certain timeframe of the chart when the price of a currency pair opens and closes.
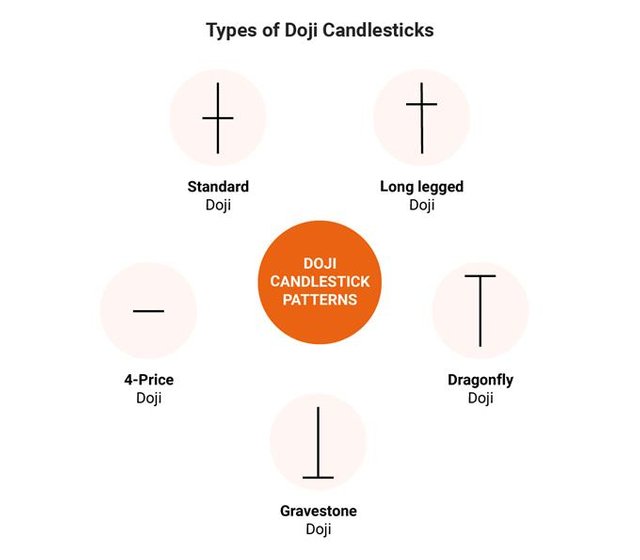
Standard Doji

A standard Doji pattern is a simple candlestick which the traders have to observe the prior price action building up to the Doji.
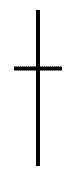
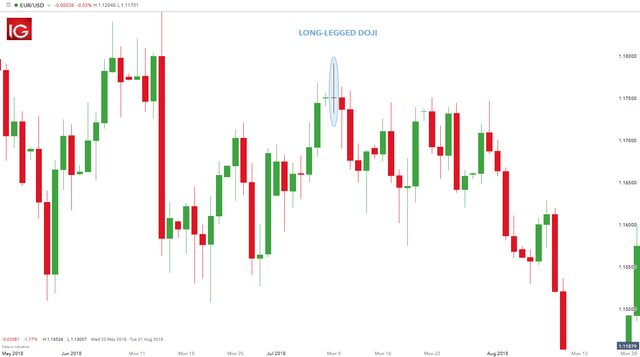
Long-legged Doji
source
In long-legged doji there is a horizontal and vertical line crossed. During a timeframe the price action moves up and down using the horizontal line.
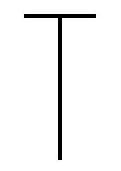
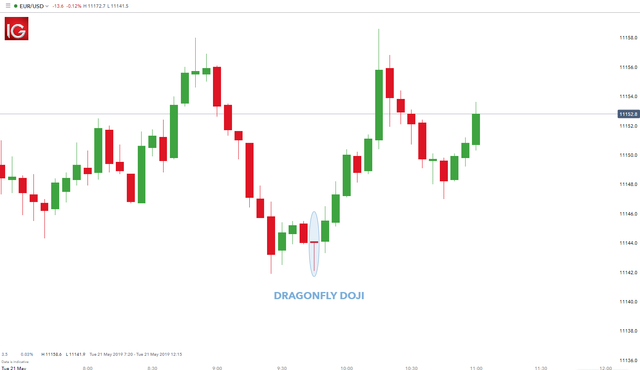
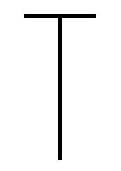
Dragonfly Doji
source
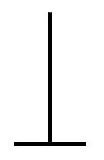
Dragonfly doji appears at the top of an uptrend or bottom of a downtrend. It shows the potential for a change in direction. The shape of the dragonfly doji is “T” which denotes that the price will not move above the opening price.
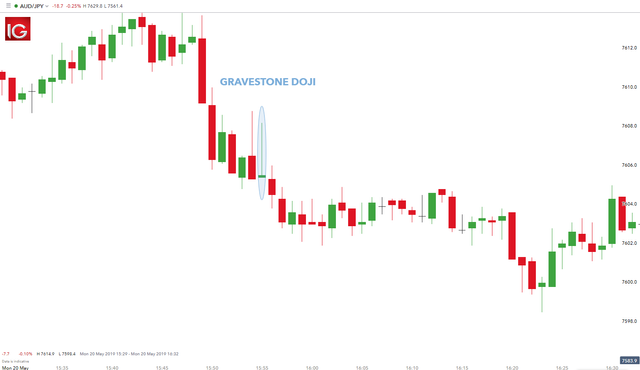
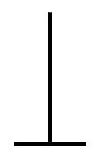
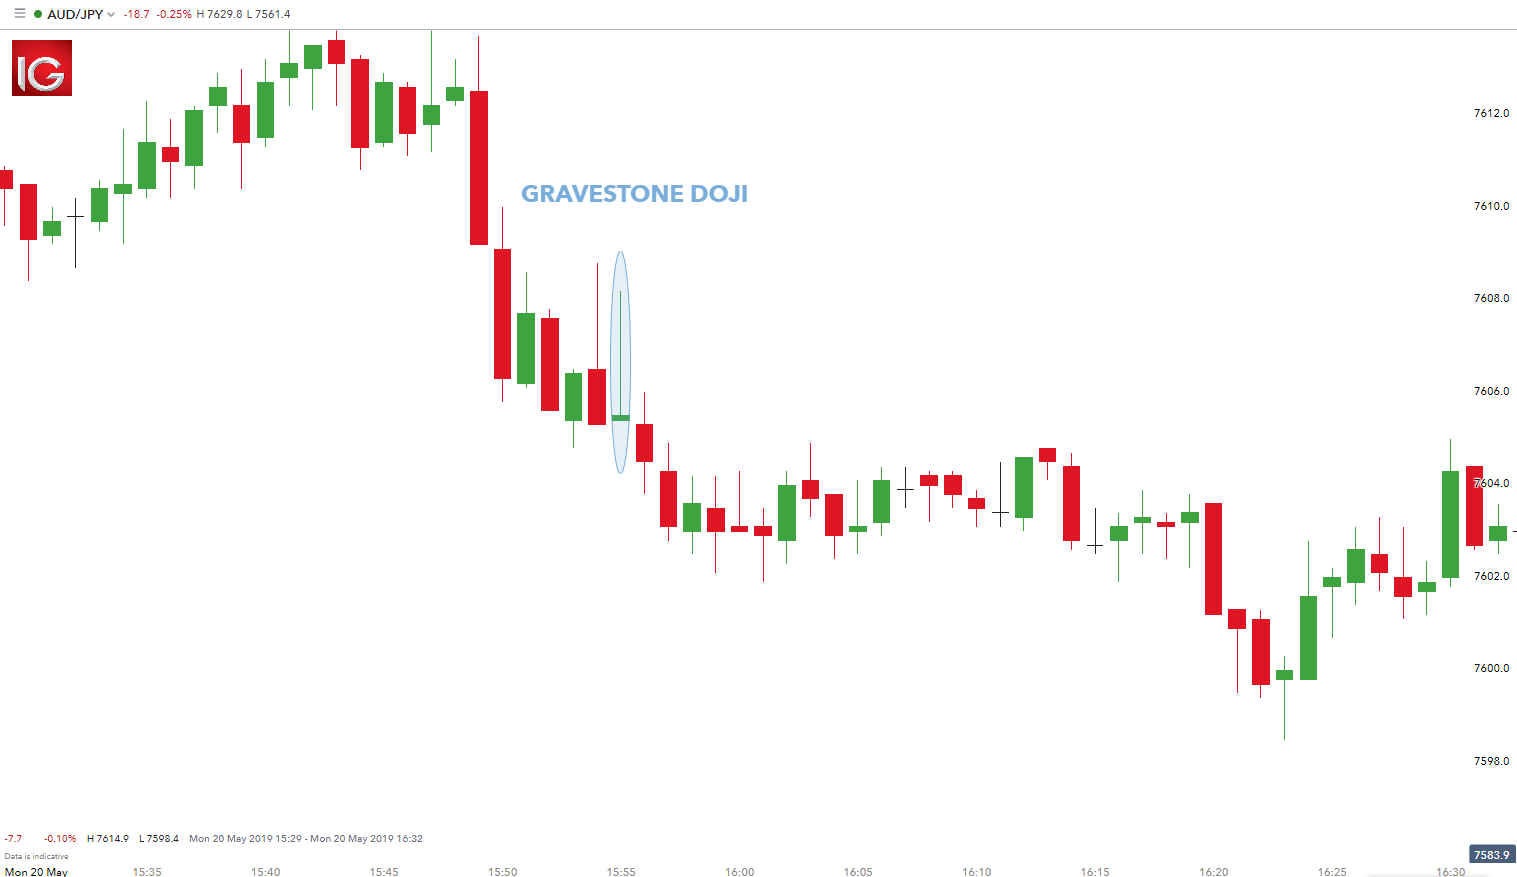
Gravestone Doji
Gravestone doji is the opposite of dragonfly doji. In a price chart it is in the lower end of the trading range. Gravestone candle is a signal for a bearish trend.
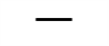
4 Price Doji
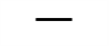
4 Price Doji is just a small horizontal line which denotes a quiet market. Here all high, low, open and close prices are in a single line.
The Hammer Candlestick Pattern
Hammer candlesticks can be seen at the bottom of a downtrend and denotes that the market is about to dace a bullish trend. The hammer candlestick patterns show reversal and exit signals. A hammer is formed when the stock moves lower than the opening price.
Sometimes a hammer candlestick can provide false signals as it doesn’t take the trend into consideration.
There are different hammer candlestick patterns.
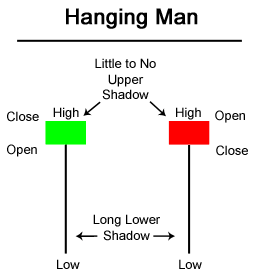
This appears at the bottom of a downtrend. The body is small and has a shorter upper wick and longer lower wick. This looks like a hammer. This pattern tells about an upcoming reversal.

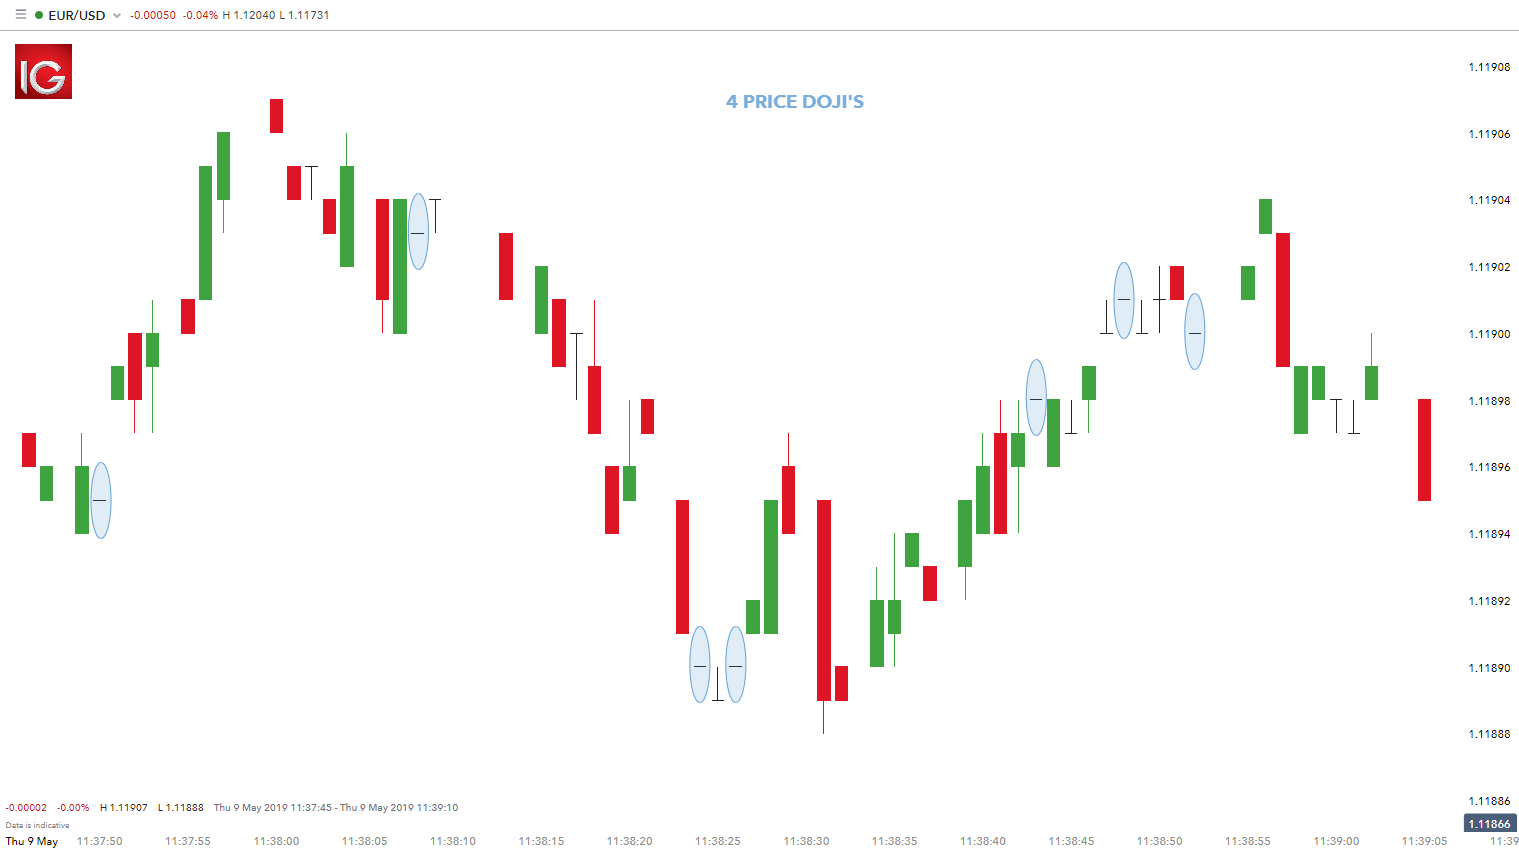
The inverted hammer candlestick tells about a bullish reversal. This candlestick has a long upper wick and a shorter lower wick.
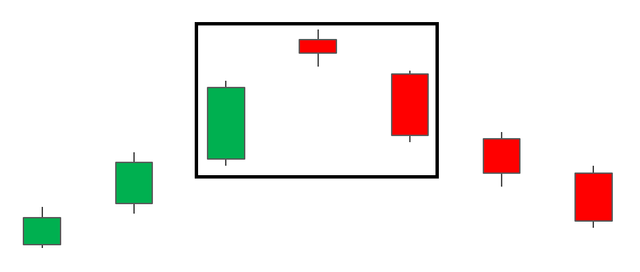
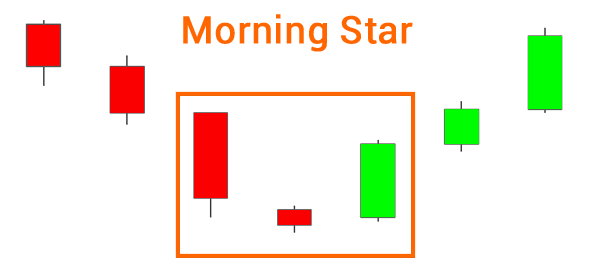
The Morning Star

The morning star is a bullish candlestick pattern. It is formed during a downtrend. Morning star consists of three candles which are at the bottom of the downtrend. The first candle is a bearish candle, second candle is a tiny doji candle and third candle is a bullish candle.
This shows that a small bullish trend will start after a huge downtrend. The fourth candle opens above the star candle and fourth, fifth and sixth candles are bullish that indicates there are more buyers in the market.
It is easy to spot the morning star and it tries to give accurate details. Morning star can be used for double exponential moving averages.
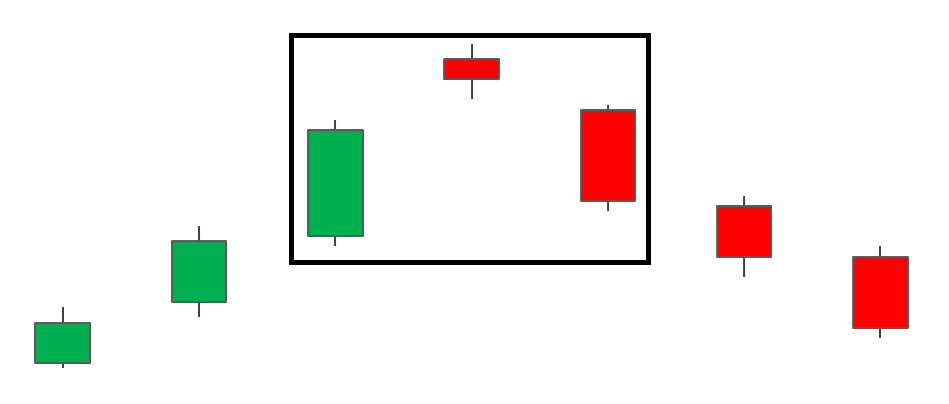
The Evening Star
There are three candles in the evening star. First candle is a bullish candle. Second candle is a tiny doji candle. The third candle is a bearish candle. New highs are made as bulls are in charge on the first part of the evening star. In the second part after a bullish gap the prices are not pushed higher by the bulls. The second candle can be neutral, bullish or bearish. The third candlestick begins with a bearish signal, the prices are further downtrend. The price chart faces a bearish trend.
Identify these candlestick patterns listed in question one on any cryptocurrency pair chart and explain how price reacted after the formation.
I will show actual candlestick designs taken from the Bitcoin
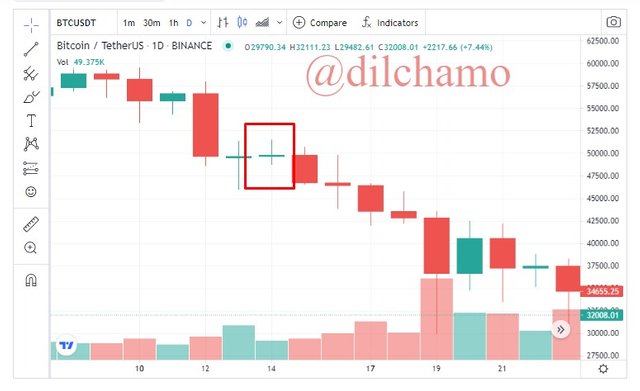
In this screenshot you can see clearly that how price changed to the opposite direction which means the control of price is in buyers’ hands.
In this screenshot you can see a bearish engulfing candlestick. It shows how the price changes to the opposite direction after the candlestick. Here the sellers have the control of the price.
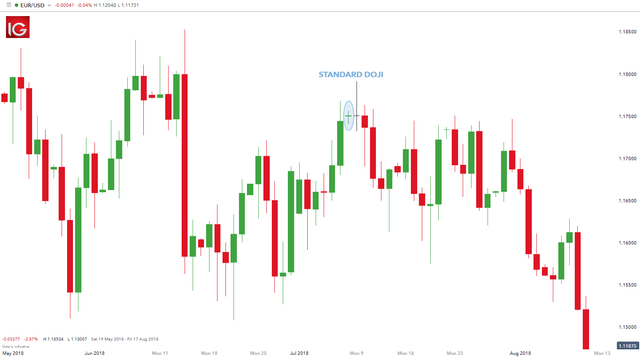
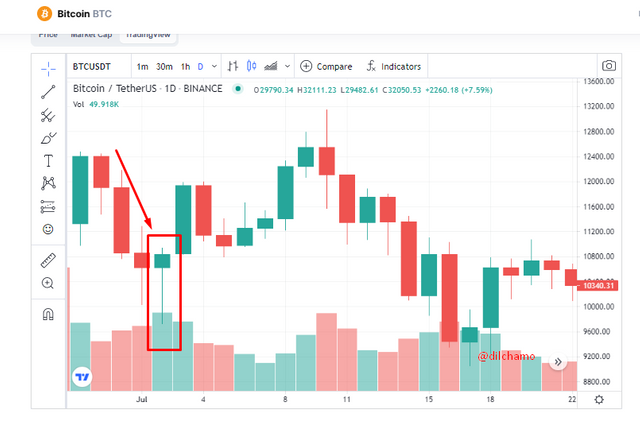
In this screenshot you can see a doji candlestick. By looking at the candlestick we can clearly say that buyers and sellers are unable to control the price. Ultimately the price will come back to the opening price.
In this screenshot you can see a hammer candlestick pattern which is in bullish style. The long tail shows the beginning of this candle. When the sellers push the prices down, the buyers will control the price. Strong reversal patterns can be seen depending on the market.
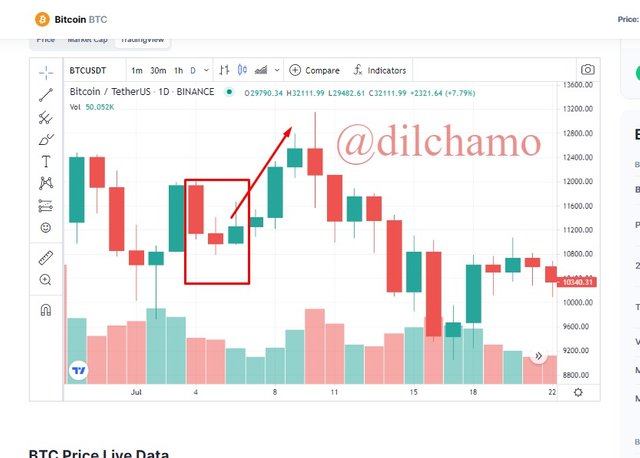
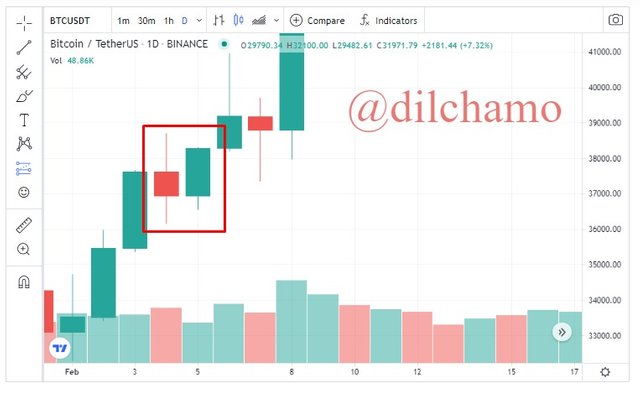
In the screenshot I have showed a morning candlestick pattern which comprises of three sticks. Here the sellers will control the market until buyers take over the market control. In the screenshot you can see a bullish trend after the morning star.
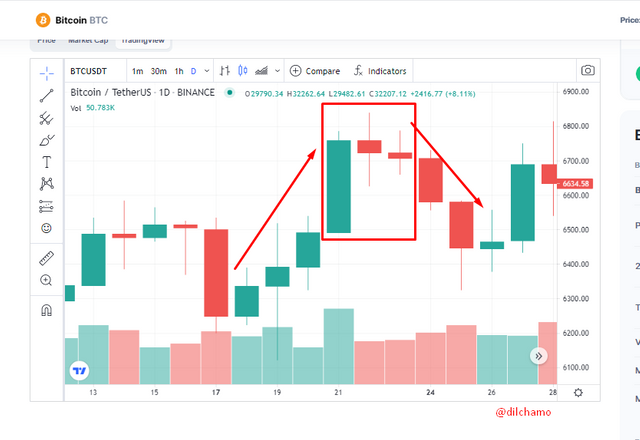
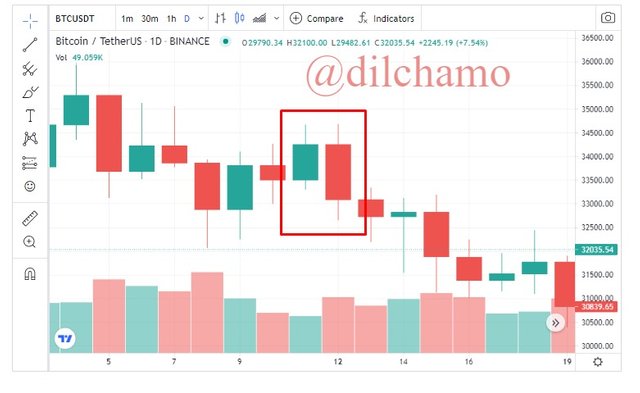
In this screenshot of the evening star with three candlesticks you will see that the price will show a bearish trend after the evening star. This is the opposite of the morning star. The buyers will control the price until it is gained by the sellers.
I will show you a small trading done using a demo account in Olymp.com
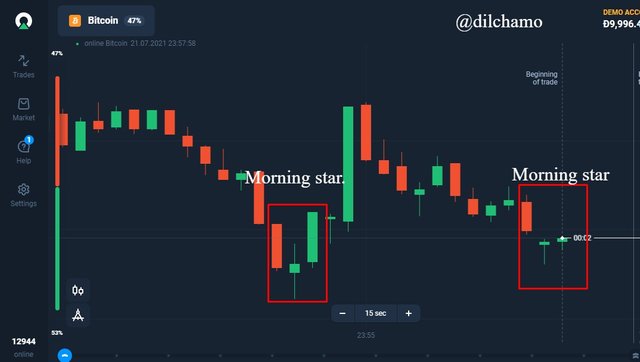
I have selected the morning star candlestick pattern in Bitcoin. I arranged the time to one minute and within one minute I could see two morning stars. I traded $5 upward. This is a gain for me and not a loss as I went through morning star candlesticks.
In the lesson it explains about the basic candlestick patterns with their psychology behind them. The price fluctuations are demonstrated from candlestick patterns. The anatomy of the Japanese candlestick patterns is different from other patterns as it gives detailed information about the market. Here I also have explained what is expressed by each of the candlesticks. Thank you Professor @reminiscence01 for giving this vast knowledge.

Thank you for the great content https://9blz.com/dragonfly-doji-candlestick-pattern/