Steemit Crypto Academy Season 3- Dynamic Course for Beginners - Week 5-HOMEWORK | Trade with "Simple and Exponential Moving Averages" + application of the "Fibonacci Retracements" on the chart By @dilchamo

Entire Question
Theory (No images)
1.Define in your own words what are simple moving averages and exponential moving averages.
2.Explain how simple and exponential moving averages are calculated.
3.Briefly describe at least 2 ways to use them in our trading operations.
4.What is the difference between simple moving averages and exponential moving averages (Explain in Detail)
5.Define and explain in your own words what "Fibonacci Retracements" are and what their gold ratios are.
Practice (Only Use your own images)
1.It shows step by step how to add a "Simple and Exponential Moving Average" to the graph (Only your own screenshots - Nothing taken from the Web).
2.Use "Fibonacci Retracements" to chart a bullish and bearish move (Own screenshots only - Nothing taken from the web).

Define in your own words what are simple moving averages and exponential moving averages.
SIMPLE MOVING AVERAGE
 [source]()
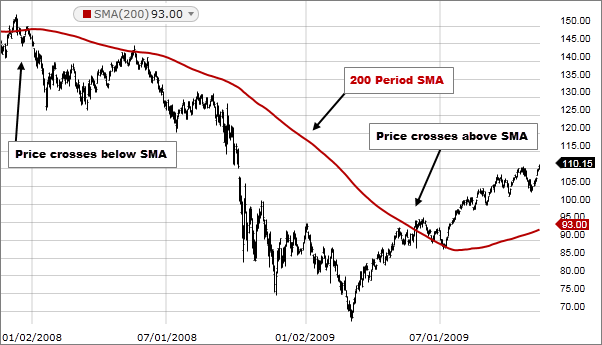
A simple moving average determines whether the asset price will continue or reverse a bull or bearish trend. To calculate the SMA the recent prices of the securities can be added and divided by the time periods. It shows the trend direction. Simple moving average can be calculated for different time periods. If the simple moving average trends upward then it indicates that the price is rising. If the simple moving average trends downward then it shows the price is declining. It is a line moving along the chart when the average value is changing. Simple moving average is a smooth and volatile calculation. It determines the price trend of the security. It is clear that simple moving average fully relies on historical data. Smooth simple moving averages can be obtained if the timeframes are longer.
EXPONENTIAL MOVING AVERAGE
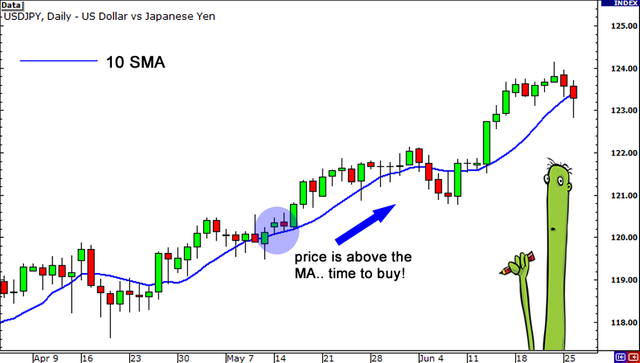
Exponential moving average which is also known as exponential weighted moving average is used to determine the change of certain asset over a certain time period. EMA weights more on recent prices. EMA is used to identify and highlight price trends. If the price is above the EMA line that means the price is more likely to rise and if not it means the price is about to decrease. EMA also functions in support and resistance levels for prices. EMA is more responsive to latest price changes. It is said that over weighting recent data creates a bias that leads false outcomes.
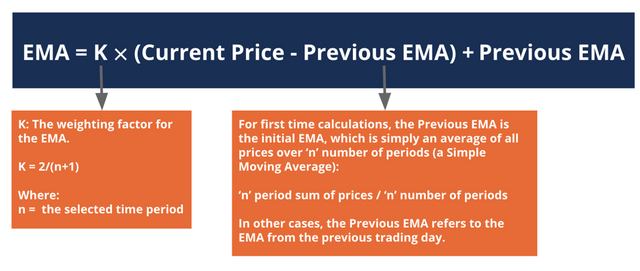
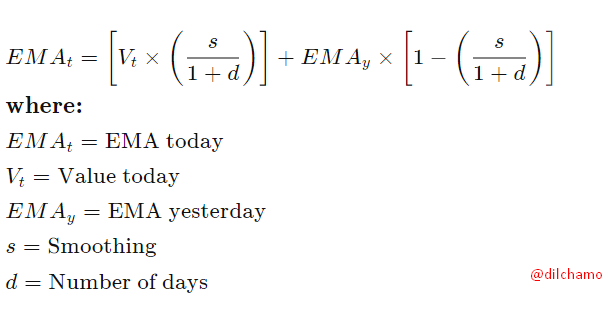
EMA is calculated in the following way.
source
The major difference between Simple moving average and Exponential moving Average is that SMA relates with all values. EMA relates on more recent values.
Explain how simple and exponential moving averages are calculated.
SIMPLE MOVING AVERAGE
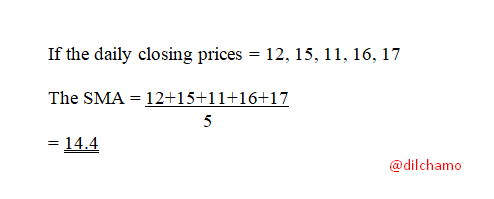
The simple moving average is calculated by adding the prices of a certain time period and divides it by the number of time periods. It determines the average price over a certain time period.
Let’s see an example for a five days SMA.
EXPONENTIAL MOVING AVERAGE
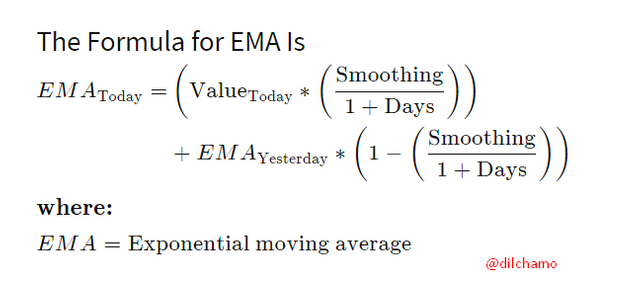
When calculating EMA it gives a weighting to recent prices. The formula is as follows:
1.To calculate the EMA first you should obtain the SMA of a certain time period.
2.Then you have to find the smoothing factor using the below formula.
[2/(selected time period+1)]
3.Now you can calculate by assigning figures to the formula.
Briefly describe at least 2 ways to use them in our trading operations.
Moving averages can be used to determine the uptrends and downtrends for the traders to process with buying or selling assets. It also determines potential reversals. A moving average should never be used itself to enter a trade as it is a lagging indicator.
Trend Analysis
A trader will use moving averages to identify the trend of the price. The indicator will determine the price is moving an uptrend or a downtrend according to the historical data. When the price is above the line that means it shows an uptrend and if the price goes below the line it means there will be a downtrend.
Support and Resistance
Moving averages determine support and resistance during a time period. If a certain high number of traders are using the same to buy and sell in the market then the market reacts accordingly. 10, 20, 50,100 and 200 time periods are most commonly used for support and resistance. Support levels are known as “floors” and resistance levels are known as “ceilings”.
Identify overextended Markets
The moving averages determine whether the market is overextended. This happen when the traders do buying and selling too late. The 10 and 20 exponential moving averages are most commonly used to identify over extended markets. If we use at least 10 or 20 time periods we can avoid from joining too late and that could minimize overextended markets.
What is the difference between simple moving averages and exponential moving averages (Explain in Detail)
Simple moving averages and exponential moving averages are used to determine the price trends in the market. Even though both consist of same purpose the sensitivity SMA and EMA shows in operation are different.
SMA calculates the average price of given data but the EMA gives more weight on recent data. Here the newest price will have more impact on average while older data has less impact.
EMA gives higher weighting to recent prices. You can see that clearly in the calculation formula. But SMA gives an equal weighting to all data as its average is calculated within a given time period.
Compared to simple moving average Exponential moving average is more responsive and has a small lag time.
The calculations of SMA and EMA are different. As a result EMA calculations leads quicker determinations while SMA is slower is determining the price trend.
Short term traders rely mostly on EMA as they need to identify the price changes quicker while long term traders mostly rely on SMA as they are not rushing to make decisions.
Define and explain in your own words what "Fibonacci Retracements" are and what their gold ratios are.
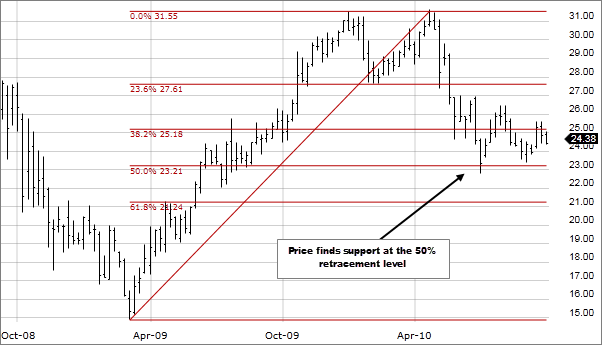
The horizontal lines which indicate where the support and resistance levels happen are known as “Fibonacci Retracements”. Fibonacci retracements are percentage values generated within the horizontal lines. Fibonacci retracement lines are drawn between two extreme points. Then six horizontal lines are drawn intersecting the trend line at percentages of 0.0%, 23.6%, 38.2%, 50%, 61.8%, and 100%.

These percentages determine the support or resistance levels. Price objectives are created when these percentages are applied to the difference between high and low price. The indicator is drawn between two high and low price points.
There are no calculations in Fibonacci retracement levels. They are percentages of the selected prices. The Fibonacci numbers are based on “Golden Ratio”. Fibonacci retracement levels are generated from a number string which starts from 0 and 1. Then add the last two numbers to get a new number.
0, 1, 1, 2, 3, 5, 8, 13……..
To obtain a percentage ratio a number should be divided by the next number. Except 50% all other ratios are calculated based on this simple calculation.
What do Fibonacci retracement levels tell
Fibonacci retracement levels are static and do not change like moving averages. This static nature allows quick and easy identification. Fibonacci retracement levels are used to determine stop loss levels or set price targets. If the traders see a stock moving up the traders decides to buy.
The golden ratio is a mathematical relationship. Two numbers are in the golden ratio if the ratio of the sum of the numbers divided by the larger number is equal to the ratio of the larger number divided by the smaller number. The golden ratio is about 1.618. if the Fibonacci numbers are high then it has a closer relationship to the golden ratio.
It shows step by step how to add a "Simple and Exponential Moving Average" to the graph.
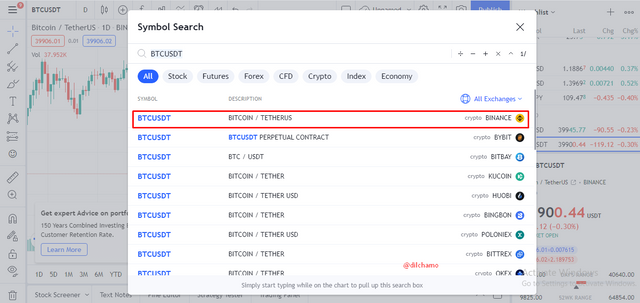
First log into Tradingview.com
•I have selected the BTCUSDT to demonstrate the Simple moving average. To determine the lag you can enter the SMA after during the calculation.
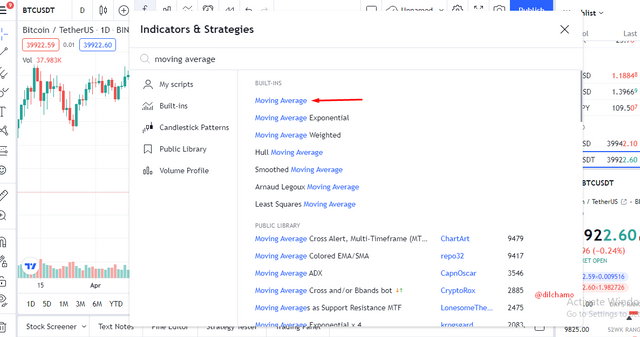
then click on "indicator" and get the Moving average.
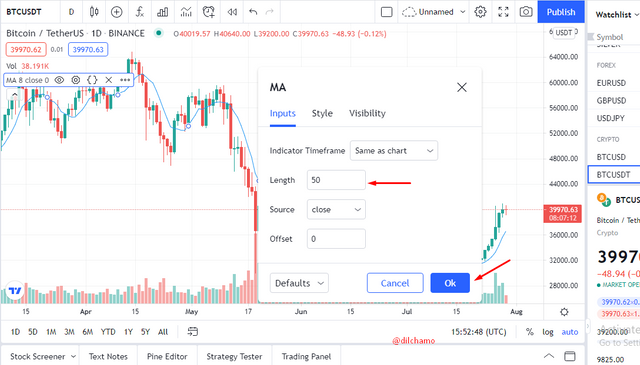
by clicking on iindicator settings you can enter the length and click "ok".
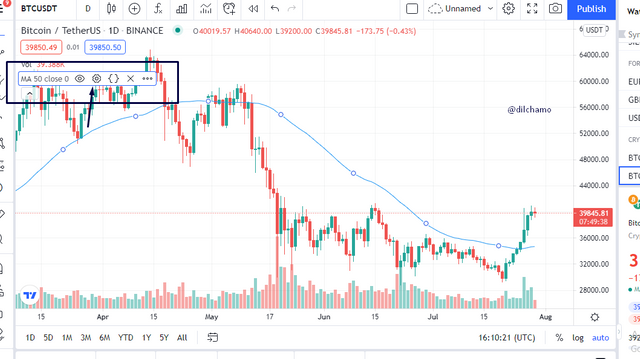
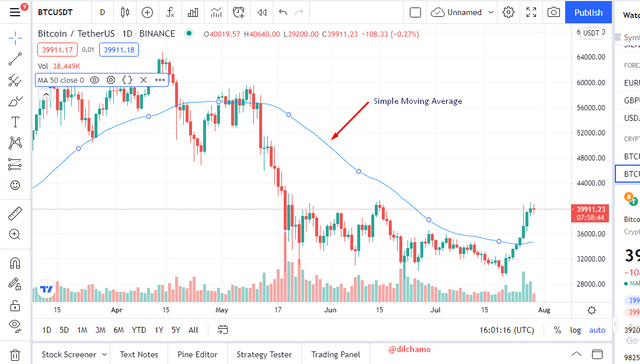
now you can get the Simple moving average indicator with a lagging displayed.
•To determine the Exponential MA again you can enter the value obtained by the calculation and the indicator will be displayed on the chart.
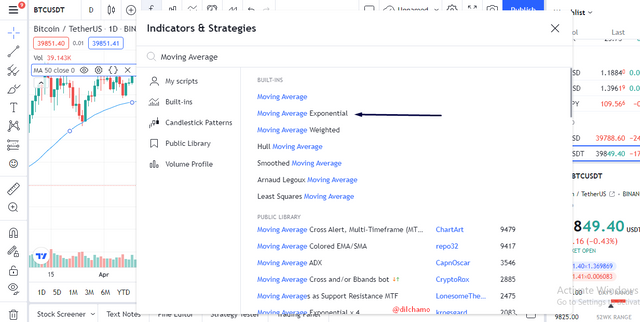
First search "Moving Average Exponential" in Indicators.
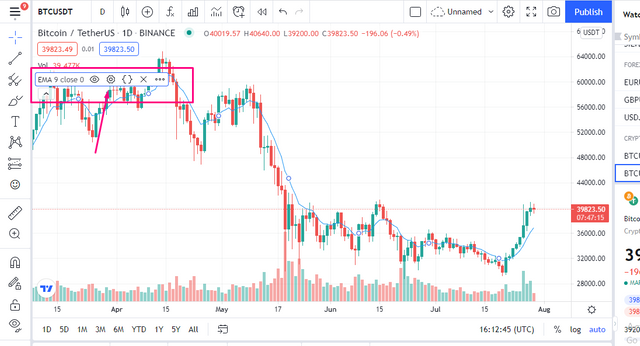
Then you can enter the values by clicking on indicator settings.
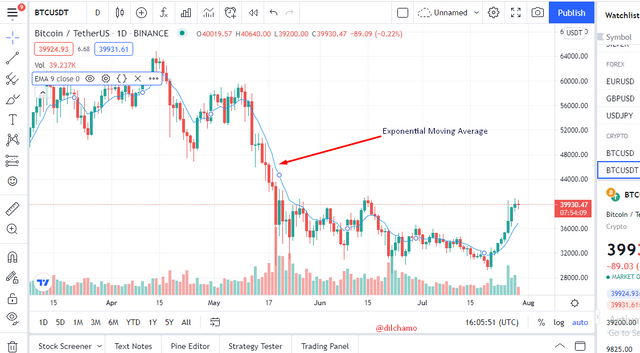
The Exponential Moving Average Indicator is displayed.
Use "Fibonacci Retracements" to chart a bullish and bearish move.
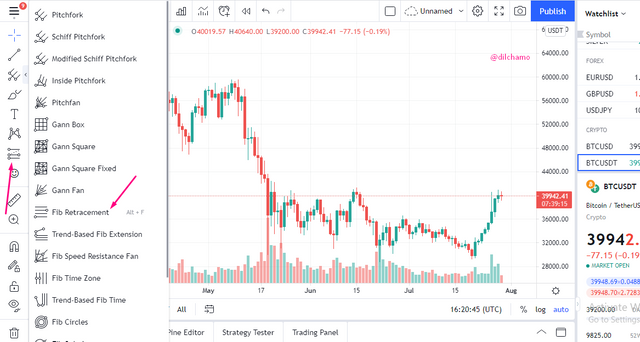
I use the same Tradingview.com to demonstrate the Fibonacci Retracements. You can click on the three line icon in the trading view. Then select the Fibonacci retracement in the list. As described above there is no complex computation to this method. We can select any two high and low points to demonstrate the Fibonacci retracements.
Bullish Trend
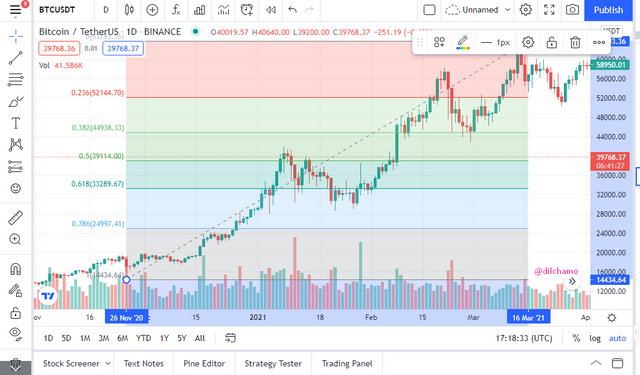
To get the Fibonacci retracement lines for the bullish trend I selected a minimum point and a maximum point on the chart and drew the line. Then the Fibonacci retracement lines appeared on the chart. As the chart shows the uptrend has started from 0.786.
Bearish Trend
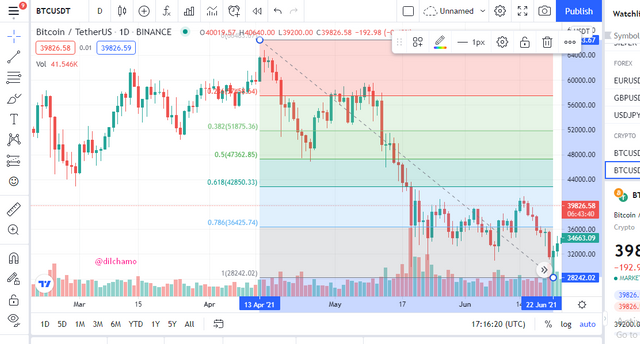
To get the Fibonacci retracement lines for the bearish trend I selected a minimum point and a maximum point on the chart. When the line is drawn within the two selected points the Fibonacci retracement lines are drawn. The downtrend starts from the Fibonacci retracement line 0.236.
CONCLUSION
In this lesson there are three key areas which we could learn. They are; Simple moving average, Exponential moving average and Fibonacci retracement lines. All these indicators will allow traders to determine whether to buy or sell assets by observing and identifying the market trend. Thank you so much Professor @lenonmc21 for giving this vast knowledge. Thank you for reading my post.