Steemit Crypto Academy Season 3- Dynamic Course for Beginners - Week 3 –Homework for professor @lenonmc21 | All about Trends, Supports and Resistances and simple chart patterns | by @dilchamo

Entire Question
Homework
- Define in your own words what is a "Trend" and trend lines and what is their role in charts?
- Explain how to draw an uptrend line and a downtrend line (Show a screenshot of each).
- Define in your own words what "Supports and Resistances are and how we can identify both zones (Show a screenshot of each one).
- Explain in your own words at least 2 simple chart patterns with screenshots.

Define in your own words what is a "Trend" and trend lines and what is their role in charts?
Trend is a direction which something is changing or developing. In the business world trend is a change in process or output. Trend in financial market is the movement of price levels over time. The price level of a market can increase or decrease anytime.
Trend lines are used to demonstrate the direction of price levels in the financial market. A trend line is drawn under the pivot highs or pivot lows to show the direction and speed of price. Trend lines also describe the patterns during the contraction of price levels. A trend line needs to be updated when deviations occur if it lasts for a longtime without deviations.
As mentioned above trend lines are drawn considering lower lows of support and higher highs of resistance in terms of identifying the next influential levels. Most day-traders use these trend lines to get an understanding about the market price deviation. This trend line indicator provides information about the price trend which sometimes is difficult to predict.
In chart formation trend lines play a significant role. Chart patterns like falling channel pattern, ascending triangle, symmetrical triangle rely on these trend lines to form its formation.
Types of Trend Lines
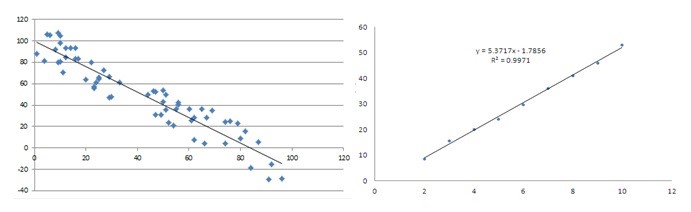
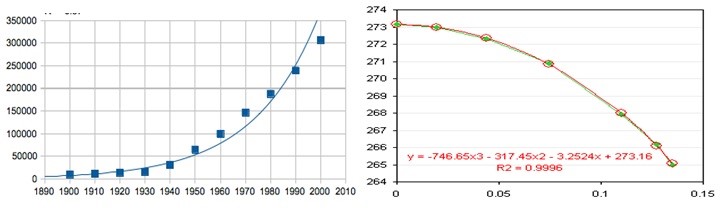
Linear

A linear trend line can be seen if your data increases or decreases steadily along a straight line over time.
Exponential
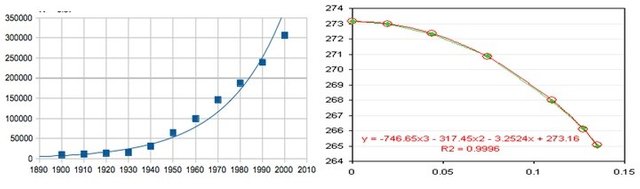
Exponential trend line can be seen if the data values increase or decrease exponentially.
Polynomial
Polynomial trend line can be seen if the data values increase and decrease over time.
Logarithm
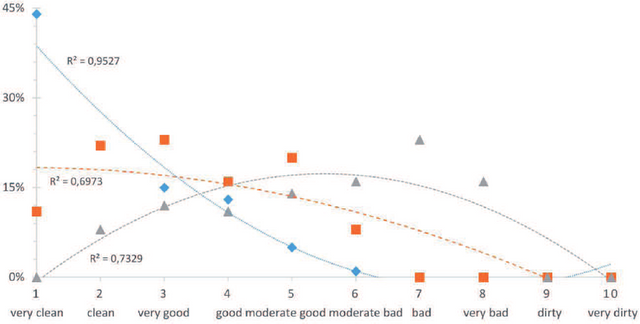
Logarithm trend lines are used if the data is rapidly decreased or increase and then again leveling out.
Power
Power trend lines are used when the values increase or decrease in a curve at a fixed rate for some period of time.
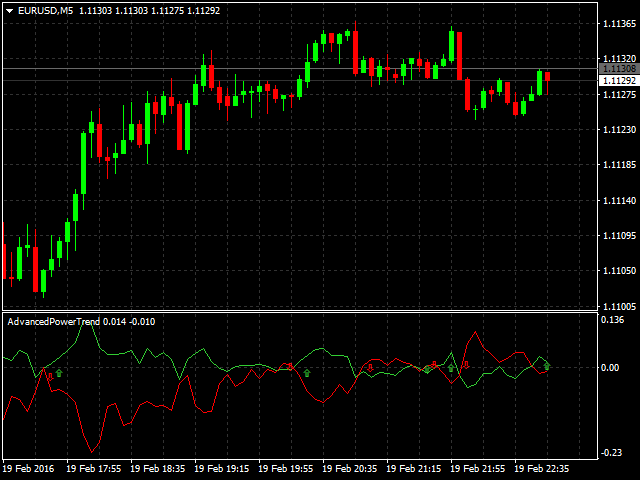
Moving Average
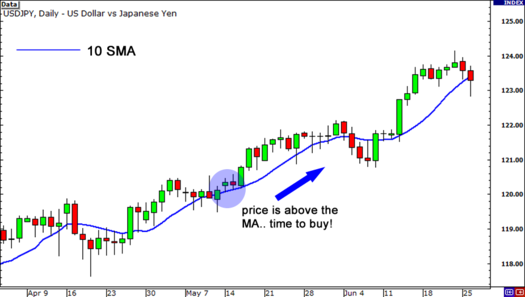
Moving average trend lines are used when the chart shows the values fluctuating while there is a need of smoothing the exceptions.
There are two types of trend according to the movement in the chart.
Bullish Trend
In the bullish trend the trend lines move upward. It depicts the prices are rising in the market.
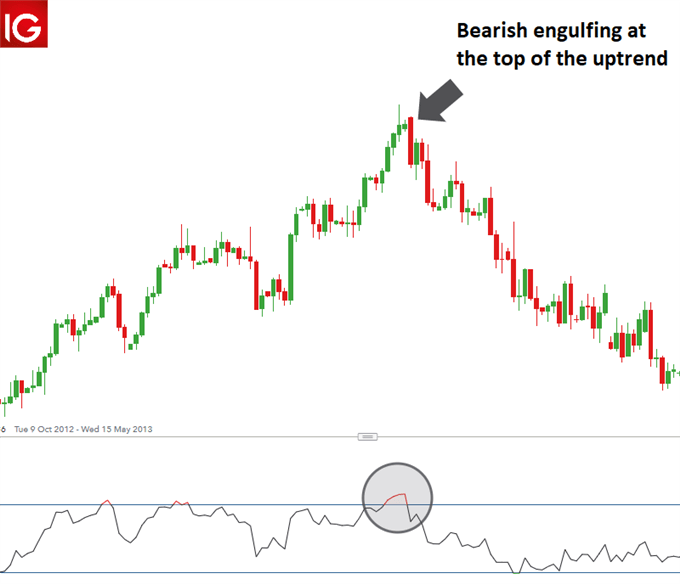
Bearish Trend
In the bearish trend the trend lines move downward which says that the prices are decreasing.
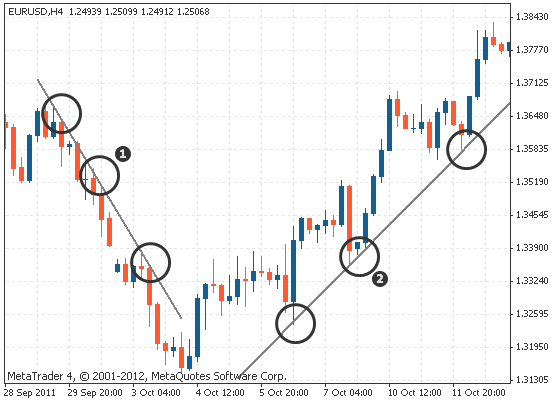
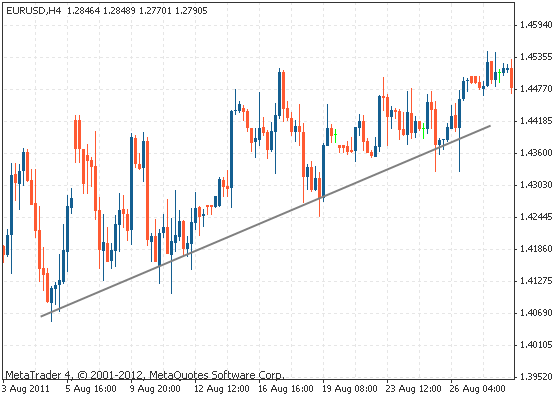
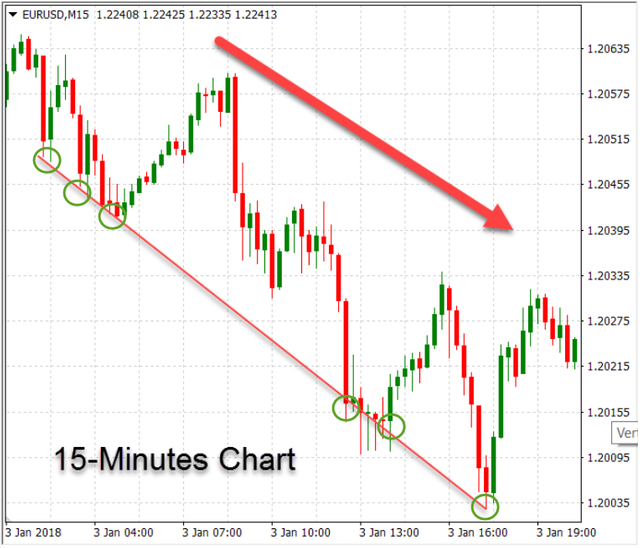
Explain how to draw an uptrend line and a downtrend line (Show a screenshot of each).
To draw the trend lines bodies or wicks of the candles. Anyone can use any method which is comfortable.
This is how trend lines are drawn using wicks.
This is how trend lines are drawn using bodies.
There are two methods of using trend lines.
• When the price finds support and resistance at the trend line.
• When the price breaks through the trend line.
In an uptrend trend lines are drawing below the price and in downtrend trend lines are drawing above the price. Two lows must be connected by a straight line to draw trend lines in uptrend. Two highs must be connected by a straight line to draw a trend line in downtrend. To make the trend line valid it should be connected to minimum of three highs or lows.
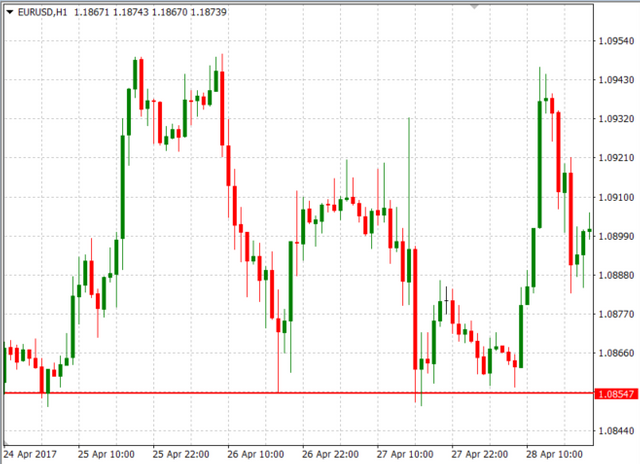
Define in your own words what "Supports and Resistances are and how we can identify both zones (Show a screenshot of each one).
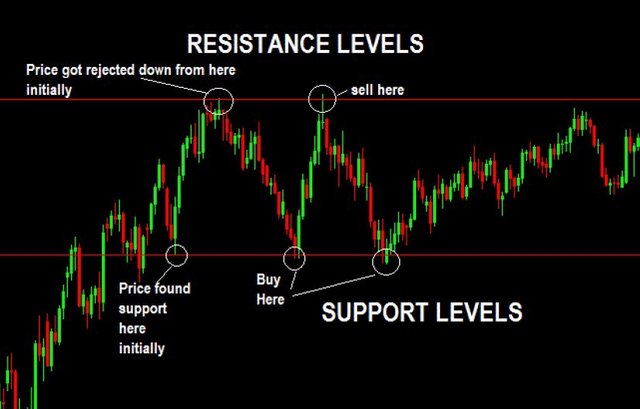
Support Level
A support level is a level which the prices need support. The price will bounce off this level without breaking through. Support represents the low level of stock price. Support promotes traders to buy. As a result the stock price will stop dropping and start rising. There are two types of support:
Horizontal support
Diagonal support
Resistance level
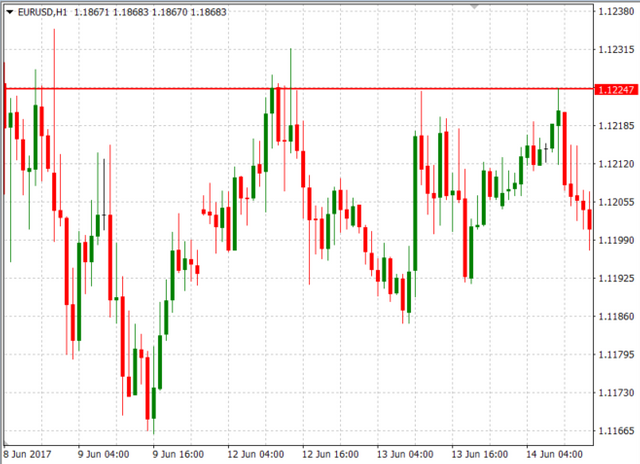
Resistance level is opposite of the support level. The price tends to rise up. The price will bounce off rather than breaking through. Resistance represents high stock price levels. Resistance tends traders to sell. The price continues rising up until it meets another resistance level. There are two types of resistance:
Horizontal Resistance
Diagonal Resistance
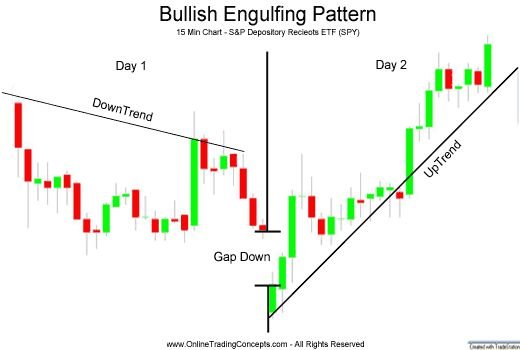
Explain in your own words at least 2 simple chart patterns with screenshots.
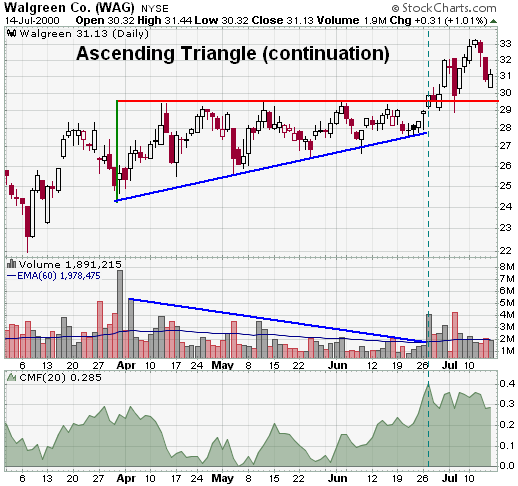
Ascending Triangle

Ascending triangle is a bullish chart pattern which is used to display the swing highs and swing lows of price levels of the market. The two lines together will form a triangle. By using the height of the triangle the profit target is calculated.
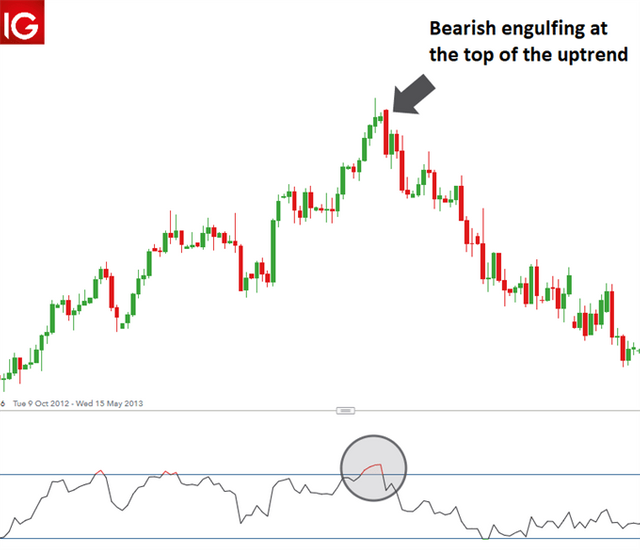
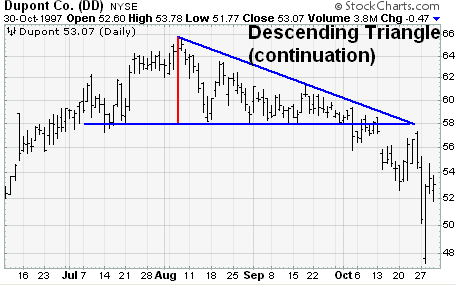
Descending Triangle

A descending triangle is drawn by connecting highs and lows in a chart. It shows traders the demand for a certain asset is weakening. Descending triangles show bearish continuation patterns.
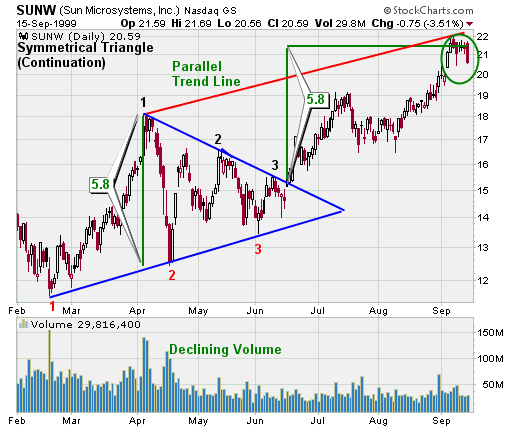
Symmetrical Triangle

Symmetrical triangles are made by using two converging trend lines. It represents the period of consolidation. In symmetrical triangles both trend lines slop towards a center point.
CONCLUSION
From this lesson I learnt about different trends in charts and it made me easier to understand about charts and the market. Studying about charts and about the trend lines makes users analyze and understand the market trends and engage in trading. Thank you professor @lenonmc21 for teaching this valuable lesson. Thank you for reading my homework post.