Crypto Academy Season 6 Week 1 : Effective Trading Strategy using Line Charts
.png)
Welcome, all of you to the Steemit Crypto Academy Season 6. This season is ideal for crypto traders. I’m going to share my knowledge and experience in crypto trading during this season. As the very first lesson, I will share a special chart pattern that is important when trading crypto assets.

DOW Theory
Charles Dow, the developer of the DOW theory was only interested in the close of the asset. Dow believed that plotting a record of highs and lows tends to disturb the real value of the asset which is settled only by plotting the the close.

The line chart is also a method of graphical representation of an asset’s price with time. An asset’s opening price and closing price are connected with time using a single line in this line chart. Unlike other types of charts, the Line chart pattern is a 2D data representation method.
Line charts are easy to understand simple chart pattern which gives only the asset’s closing price which changes over time. As the line charts show only the closing prices, they reduce noise from times in the trading day, such as the open, high, and low prices.
The line charts provide traders with a clear image of the path of an asset. It visualizes the price movement of the asset very simply and clearly. A line chart is used to show the change of information over a period of time. The horizontal axis is the time frame like minutes, hours, days, months, or years. The vertical axis would include the asset price.
Most traders cannot properly understand the price movements and trends due to the use of complex and sophisticated chart patterns. As a result, the traders may fail in gaining profits. These line charts are a way better to understand the trends and gain profits easily.
When the line charts dominated the industry the traders and other professionals started to use simple line charts as the closing price is easily identified. Despite everyone using Japanese candlestick techniques on candlestick charts, this simple kind of chart that contains only a single line is smart as just one line is enough to filter the market noise which is one of the reasons why most retail traders fail.
The line chart can be applied once you go to a trading platform you may click on the chart type icon and select the line charts.

The interpretation of line charts is simple. As I mentioned above the line charts only show the closing prices. So they offer great value to traders by reducing noise. This chart is also good for visualization of the overall trend of a currency pair.

Support and Resistance are practically the foundation of technical analysis. The better traders understand that support and resistance levels serve as a starting point for developing an idea of what may happen next and what concern the price movement.
A support level is an area where the buying power is strong enough to stop the price of an asset from decreasing any further. A new support level often will be found above a previous trading range's resistance level. When a resistance level is broken it becomes an area of support.
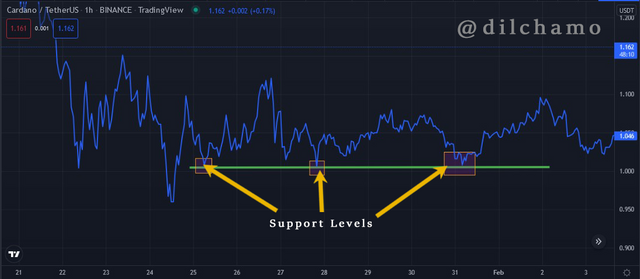
Image source
A resistance level is an area where the selling price is strong enough to stop the price of an asset from increasing any further to higher position. A new resistance level often will be found below a previous range's suport level. When a support level is broken it becomes an area of resistance.
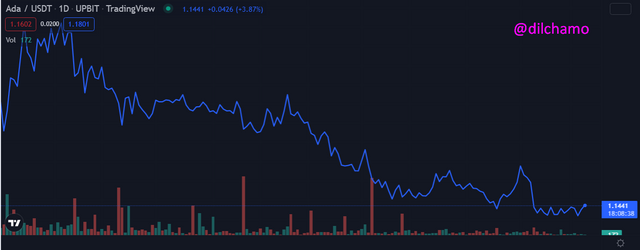
With line charts spotting support and resistance is very easy. Let us have a look at the ADA/USDT 1 hour chart. You identify relevant support and resistance levels based on recent market swings and scalps.
.png)
The horizontal lines joining market swings are very subjective. In most cases we can only approximate these areas. The technique of drawing support and resistance lines is simple. Trader should identify recent market highs and lows and connect the swings with a line. If the line includes 3 or more swing points it means the support or resistance level is more relevant. If the market breaks the support and resistance areas, then traders should have to look for an entry in the direction of that breakout.

Line graphs provide significantly less information about price as it only connects the closing prices of the asset. A line graph filters out a lot of the noise which can be seen in the candlestick charts.
The line graph is ideal for higher time-frame analysis which a trader does not need to see all the details and just wants to get the direction, analyze the market flow and overall trend structure. The line graph should be chosen rather than the candlestick charts because line graphs provide a clear picture that is demonstrated without any noise.
In certain situations, when making trading decisions such as stop-loss distance and location, the information of the candlestick charts is necessary to estimate the level of volatility and place trades. line graphs and candlestick charts can be used in combination by traders in some instances.

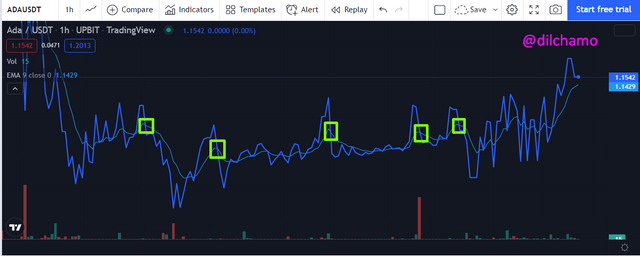
Line charts can be used with moving averages to confirm the price movement of an asset. All traders regardless of their experience know that moving averages provide resistance in bearish trends and support during bullish trends. The general rule says that the higher the moving average the stronger the support or resistance Price meets. Furthermore the bigger the time frame the stronger support or resistance gets. One of the most relevant things to keep in mind when trading with moving averages is that they reveal a trend's strength. The more the price comes to the average the weaker the trend reveals. And eventually, breaking it. So, instead of using candlestick charts, try using line charts and consider a relevant test only when the line chart touches the moving average.

The identification of asset's price trend is very important when trading the crypto assets. The profit or loss of a trader depends on his/her ability to identify the trend accurately. In line charts the bullish and bearish trends can be easily identified by using Ascending and descending triangles. I will explain you how to identify the price trend using ascending and descending triangles.
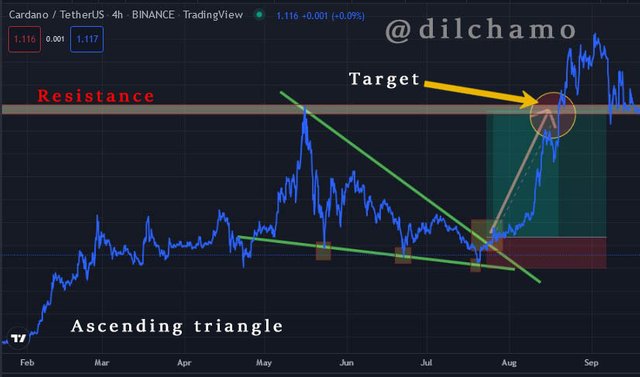
By using the ADA/USDT cryptocurrency pair for the time of 1 day I have demonstrated the Ascending triangle. In the ascending triangle I have highlighted few higher lows. From that we can grasp the triangle which gives us the Bullish trend signal. After identifying the triangle exactly there can be a rise in the asset price as you can see in the screenshot above. So we can see that the ascending triangle provides us the bullish signal of price of an asset.
To identify the bearish signal in a crypto currency price chart we can use the Descending triangle. In the descending triangle there we can find some continuous lower highs which is declining with time gradually. That means the next signal can bea strong bearish signal where the price goes for a huge downtrend.
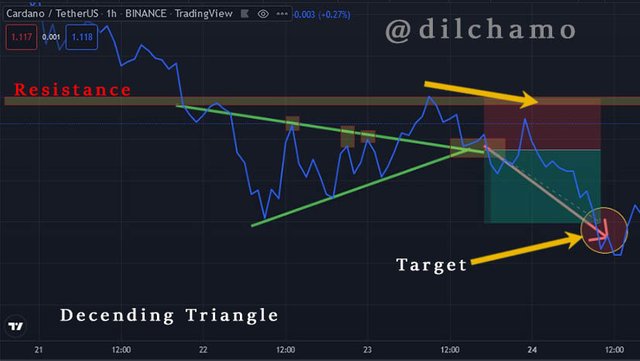
By using the ADA/USDT crypto currency pair of 1 day time frame I have marked few lower highs which lowers gradually in the triangle. And also soon after the triangle we can see there is a huge downfall of crypto asset.
This is only one method of identifying the bullish and bearishtrend of a cryptocurrency asset. There are many other ways that traders can identify the price trends. It is up to you to investigate the other methodologies of identifying the price trend of assets.

Line charts are best for beginners to trade with and to use due to their simplicity. They help to teach basic chart reading methods before learning advanced techniques of trading, such as reading Japanese candlestick patterns or learning the basics of point and figure charts.
The line charts do not demonstrate enough price information for some traders to monitor the trading strategies as some strategies require prices generated from the open, high, and low.
The traders who use more information than just the close do not have enough information to test their trade status by using a simple line chart. Candlestick charts, which contain an asset's daily open, close, high, and low prices all in the same unit may be more useful for those in these cases.
| Advantages | Disadvantages |
|---|---|
| show changes and trends over different time periods. | Plotting too many lines over the graph makes it difficult to read. |
| shows small changes that are difficult to measure in other charts | A wide range of data cannot be traced over the line graph. |
| Common as they are simple, easy to understand, and efficient. | Best for representing data that have numerical values and total figures |

The Line charts is a simple chart pattern which is used by most beginner traders to identify the price movement of an asset. The line chart indicated only the closing price of an asset which is the most important value for most of the traders. The bullish and bearish trends can be identified by using various techniques in a line chart like ascending and descending triangles. To confirm a price trend the line chart can be monitored by adding a moving average indicator and monitoring the indicator line touching the line chart. There are advantages and disadvantages in these line charts which the traders should be well aware of.

Define Line charts in your own words and Identify the uses of Line charts.
How to Identify Support and Resistance levels using Line Charts (Demonstrate with screenshots)
Differentiate between line charts and Candlestick charts.( Demonstrate with screenshots)
Explain the other Suitable indicators that can be used with Line charts.(Demonstrate with screenshots)
Prove your Understanding of Bullish and Bearish Trading opportunities using Line charts. (Demonstrate with screenshots)
Investigate the Advantages and Disadvantages of Line charts according to your Knowledge.
Conclusion.

You must submit your Homework Posts in the Steemit Crypto Academy community.
You have to include all the details in your own words without including someone's words in your content. The concept can be the same but your content should be unique.
You must include at least 800 words in your homework posts.
Plagiarism is strictly prohibited in the whole Steemit platform and you will not receive any privileges.
All the screenshots and images should be fully referenced and the referenced images should be copyright-free. And also, include your user name as a watermark in every screenshot.
You should use tags #dilchamo-s6week1 #cryptoacademy and your country tag among the first five tags. Furthermore, you can include relevant tags such as #linecharts, #cryptotrading.
According to new rules changes, only people actively, and successfully, participating in #club5050 will be eligible to get rewards for the Steemit Crypto Academy homework tasks.
Your homework Title should be [ Effective Trading Strategy using Line Charts ]-Steemit Crypto Academy | S6W1 | Homework Post for @dilchamo
Homework task will run from Sunday 00:00 February 6 th to Saturday 11:59 pm February 12th UTC Time.
If you have a reputation of 60 or above, and a minimum SP of 250, then you are eligible to partake in this Task. (You should not have any power-down history during the past 30 days and your effective SP should not be delegated-in SP). And also, if you have used any buying vote services to build your reputation, you will not be eligible to partake in this Task.
If you didn't receive the score for your homework post within 48 hours, you can put the link in the comment section. Otherwise, don't leave your post link here.
If you have any queries related to my lesson, you are totally free to ask anything in the comment section.

CC:
Great lecture
It's a new season, probably your tag as a fixed professor should be upgraded
Good luck in being your best
Great lecture ma
Hello professor @dilchamo, I noticed your charts for ascending and descending triangles contradicts research I have made. Maybe I don’t understand it properly so you could explain?
You may check the highs and lows of the closing price of the selected cryptocurrency pair. In my lesson I have explained the way of finding the signal in detail. Also you may use other methods of finding the trend signal as well.
Ma'am please you might want to look at my question and your charts a second time?
Ascending and Descending Triangles always will not work exactly same as the above mentioned format. Sometimes it may tend to show some fake breakouts. Thats why we need to wait for a better trend confirmation. So in this case, if you have any possibility to find the exact format for the Ascending and Descending Triangles, then it will be perfect. Hope you can understand.
Hello professor @dilchamo, the lesson was super amazing, and i can't wait to submit my homework soon.
Please i have a worry which is still not clarified till now. I got graded on my Homework Task08 over 30days ago, but got no upvote.
I made sure to create a Repost 22 days ago for the said Task08, but it was ignored by the steemit curation team.
15 days ago, i created a second Repost but it was ignored again.
I don't know what this means, and i hope you can please tell me what to do. The experience i just passed through is very discouraging.
The fixed tasks expired from season 5. So they are not been marked or curated as per the academy rules. You are welcome to the new season and you may try this trading season.
Very unfair and hard effort dismissed just like that. I got graded because i submitted my task 8 before the end of season 5. Others got curations yet mine was skipped. Was there a selection of posts to be curated on by @steemcurator02? Honestly, i am not happy
The curation is done by the curation team by checking the #club5050 status.
Thanks you for this course prof....
A very superb lecture dear professor. I will surely take part in it. I would like to know that I have 1420 SP but I have delegated 1000 SP to a community. I have 420 SP left effective in my wallet. Am I eligible?
Yes of course you can.
A really good and interesting course professor, my homework is on it's own. But I have a question.
Q: You asked to explain any suitable indicator to use with the line chart? So that do we only have to write about one indicator or more?
Thanks, will be waiting for your reply.
One indicator will be enough but need an in detail analysis and explanation.
Okay thanks.
Hello Prof @dilchamo, please is the power up of 150 steems in the last 30day a necessity to participate?
No need 150 Steem power Ups. And also, you should follow at least club5050
Meaning power-up half of ones weekly or monthly earnings.
Good.
Nice lecture.
Hope to do justice to it.
1 Month for #club5050 (should power up at least 50% )
2 months for #club75 (should power up at least 75% )
3 months for #club100 (should power up all the rewards )
Noted
This topic is very important and i wish to be part of it but my challenge is the reputation of 60 which i have 59.
You now have 60rep🤓
Yes oo thank you.
I found your lesson informative in crypto currency trading. Keep up the good work.
In question no.5, Can we explain Bullish and Bearish trade opportunities using other methods apart from Ascending and Descending Triangles?
Yeah. You can use any method except my one.
Alright. Thank you
Hi. I took a break from steemit for a while and didn't earn any steem. Now I want to return in season 6, but I did not do 250 sp power ups. I can't buy steem from the stock market. I have never shot or power down. I meet club75 and club5050. I want to join your assignment. can i do this?
You can partake in the lesson of reputation is 60 or above, have 250sp in the account which is not delegated in. Should not have a power down history. If the requirements are fulfilled you may participate the lesson. Participation in #club5050 is essential.