Crypto Academy Season 4 –week 1| Intermediate course Homework post for @allbert : Trading with Strong, Weak and Gap Levels By @dilchamo

HOMEWORK
1-Graphically, explain the difference between Weak and Strong Levels. (Screenshots required) Explain what happens in the market for these differences to occur.
2-Explain what a Gap is. (Required Screenshots) What happens in the market to cause It.
3-Explain the types of Gap (Screenshots required, it is not allowed to use the same images of the class).
4-Through a Demo account, perform the (buy/sell) through Strong Supports and resistances. Explain the procedure (Required Screenshots).
5-Through a Demo account, perform the (buy/sell) through Gaps levels. Explain the procedure (Required Screenshots).

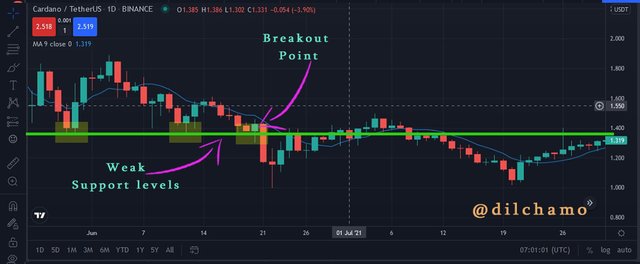
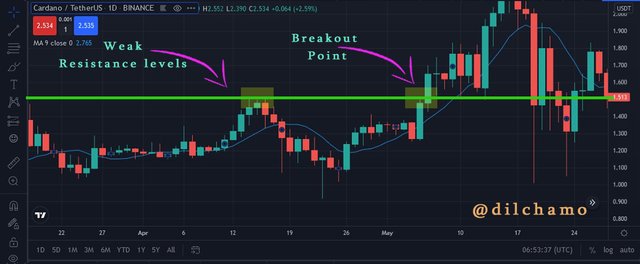
Graphically, explain the difference between Weak and Strong Levels
Support and resistance levels are the peaks and valleys of an asset price. There are instances where the market’s reaction to this support and resistance levels are less tricky and more precise. In a price chart, we can see the price moves high and low. There can be weak highs and lows and also there can be strong highs and lows.
In a price chart these support and resistance levels are imaginary lines to minimize the risk in trading. They may produce strong and weak levels time to time. To get buy decisions the price has to break above the resistance level so that the price will go higher and form another peak level where we can go for buy/long orders. To get sell decisions the price has to break below the support level and forms a valley than the previous one, so we can go for sell/short orders.

The below screenshot demonstrate the strong support and resistance levels. These levels indicate the market price performances. Traders place buy and sell orders by considering these points. The trade volume is large in strong levels. High volumes of buy positions are waiting in the strong support levels and larger sell positions are waiting in the strong resistance level. For this buying and selling of assets, traders implement the imaginary lines to determine the price decision.
- Strong Support level
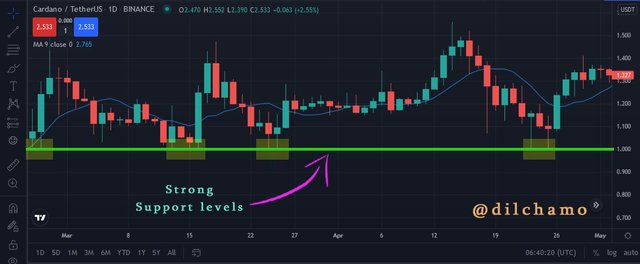
- Strong Resistance level
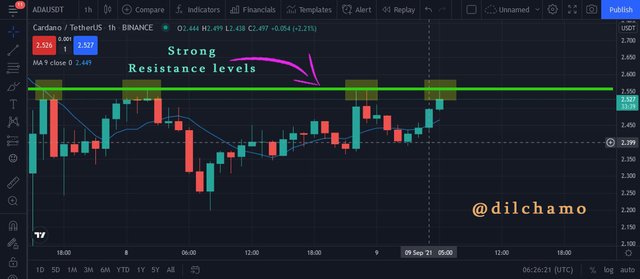
In the below screenshot you can see that the weak levels determine that the trade volumes are not high enough to trend the price to opposite direction for a longer time. that is why we can see quick changes in price trends which is known as weak support and resistance levels.
- Weak support level
- Weak Resistance level
Key differences between strong and weak levels
| Strong level | Weak level |
|---|---|
| Price trend exist in the opposite direction for long time period | Trend reversals are of shorter time periods |
| High trade volume | Low trade volume |
| There are several support and resistance points | There are only one or two support and resistance points |
| Large amount of activities awaiting to be triggered | Lesser amount of activities are awaiting to be triggered |
Explain what a Gap is
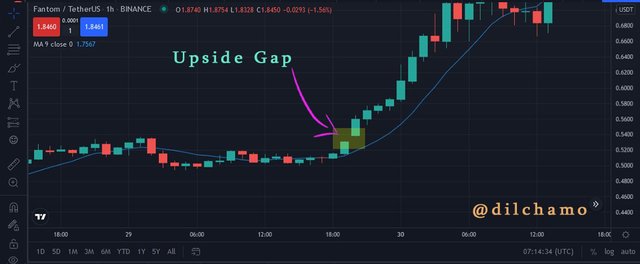
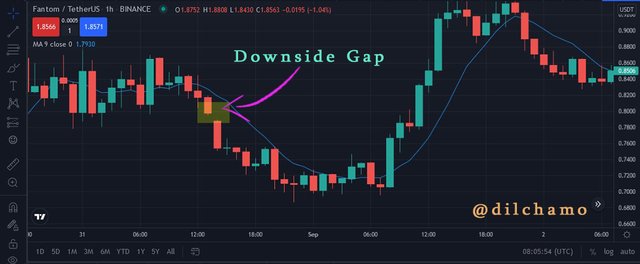
- A price gap forms on trading charts. If the opening price of the current bar is above or below the previous bar there will be a price gap. Gaps can be commonly seen on daily trading charts. As traders we all get to understand that traders gain huge benefits from large jumps in asset prices in volatile markets. The price of stocks move sharply up or down creating gaps. Due to technical or fundamental factors the gaps can occur unexpectedly changing the price of assets. Simply, if a company earnings are higher than expected there can be a gap next few days. Because the price is higher than the day before which creates a new high.
Explain the types of Gap
Gaps can be classified into four groups.
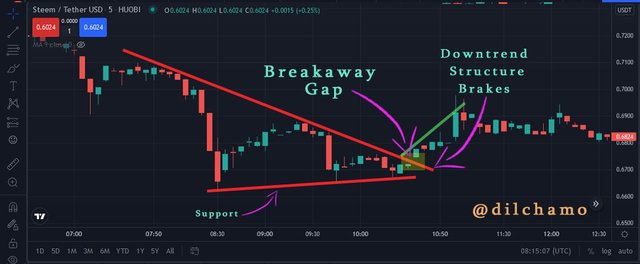
- Breakaway Gaps
Breakaway gaps occur when the price gaps above resistance or gaps below support. These support and resistance are associated with different chart patterns in trading. The breakaway gaps occur early in a price trend and it shows conviction in the new trend direction.
For example, if the prior trend becomes down the price will form a cup and handle pattern and this creates a breakaway gap to the upside just above the handle. This confirms a downtrend is over and there will be an uptrend next.
If the average volume is high then the breakout gap shows a strong conviction in the gap direction. There will be a failure if the volume is low in the breakaway gap.
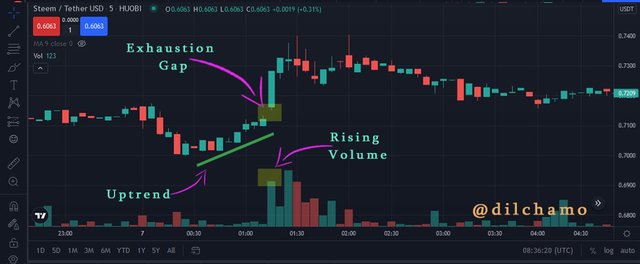
- Exhaustion Gaps
Exhaustion gaps can be commonly seen in daily charts. The exhaustion gap marks the potential change from upward trend to downward trend. This implies that buyers are exhausted and buyers don’t have enough orders to overwhelm new sellers who entered the market. In simple terms it is the number of certain buyers have diminished the sellers and stepped into the market.
The exhaustion gap consists of some features. They are:
- Certain weeks or months of the upward trend in the asset price.
- A gap between lowest price of the previous day and highest price of the current day.
- The average volume is high on the current day.
If these components exist in a two day price pattern, an exhaustion gap can occur.
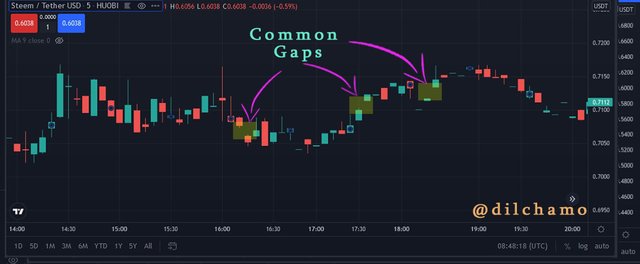
- Common Gaps
Common gaps can also be seen in price charts. Common gaps are occurred by normal market prices. This is graphically stated in price charts that there is a drop from one point of the chart to the other point. Common gaps are relatively small, normal and regular events in the price chart.
For example these gaps are occurred when an asset breaks from one day’s close to the next day’s open.
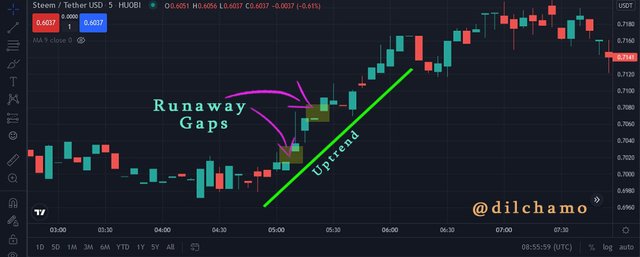
- Runaway Gaps
Runaway gaps occur when an asset skips price points. It is just like and exchange of ownership in an asset, between the price point where the gap began and ended. In a price chart there can be several runaway gaps which reinforces the trend’s direction.
If some traders did not get in during the initial move, they get tired of waiting till a retracement to join the trending market. These sudden buying or selling happen in a flash unexpectedly forcing the market makers to place offers at price points that are far away from last traded price prior to the gap.
More often runaway gaps occur after an asset has gone through a breakout gap.
Through a Demo account, perform the (buy/sell) through Strong Supports and resistances. Explain the procedure
I have chosen the BTC/USDT cryptocurrency pair to trade using a demo account in Tradingview.com.
- As shown in the below screenshot we need to identify a strong resistance level. After the price movement breaks that resistance level we get the opportunity to place a buy entry at the next swing point.
- After that, we need to identify a strong resistance level above the buy entry. Then we can set the take profit at that resistance level following a risk/reward ratio of 1:1 or 1:2.
- Furthermore, we can set the stop-loss point at a strong support level below the entry point.
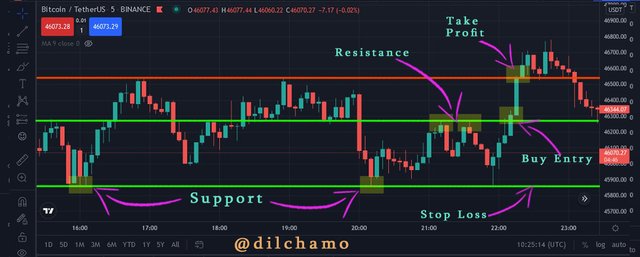
If we follow the above-explained procedure we have a higher possibility to take profit according to our buy order. So below we can see the entry point is 46229.51. At the time of taking the screenshot, the last price is shown as 46550.60. The profit is 74.47 USDT. The stop loss is marked at the point of 45854.60 and the Take profit point is at 46560.85.
Through a Demo account, perform the (buy/sell) through Gaps levels. Explain the procedure
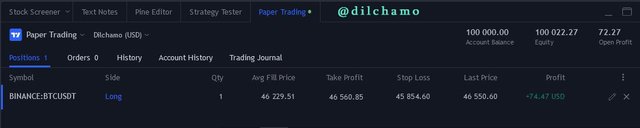
I have chosen the BTC/USDT cryptocurrency pair to trade using a demo account in Tradingview.com.
- First I have identified a strong support level and a strong resistance level. I decided to place the buy order once the price movement breaks the resistance level.
- The take profit is set above the resistance level and at a risk ratio of 1:1 or 1:2. The buy entry is at the swing point.
- The stop-loss is set at the strong support level.
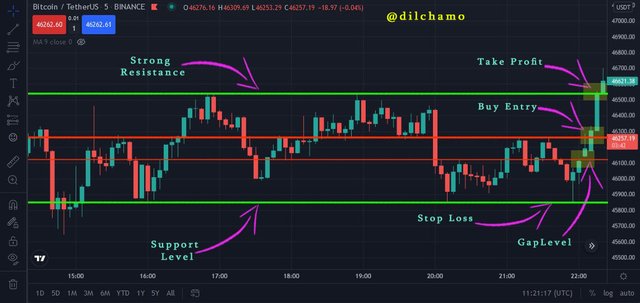
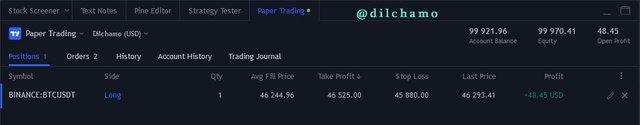
As I identified that I can get a profit from this trade I entered the trade at the point of 46244.96. At the time of taking this screenshot, the last price was shown 46293.41. I have set the take profit level at 46525.00 and the stop-loss at 45880.00. I have got a profit of 48.45 USD from this trade.
CONCLUSION
The weak and strong levels help us to determine the price action of an asset. Traders can take trading decisions according to the price actions. In price charts there are gaps which bring huge benefits to traders. There are different types of gaps. Each of them produces different outputs for traders by giving various signals. In this lesson I learnt many important factors about gaps and its signals.
CC: Professor @allbert , Professor @reddileep