Technical Indicators 2 - Crypto Academy / S4W4- Homework Post for @reminiscence01

Hello Everyone,
Today I'm participating in Crypto Academy class of Professor @reminiscence01 for Technical Indicators II, such interesting topic to be discussed and learnt. Hopefully, it's useful for you all....
Happy Reading!

1. a). Explain Leading and Lagging indicators in detail. Also, give examples of each of them
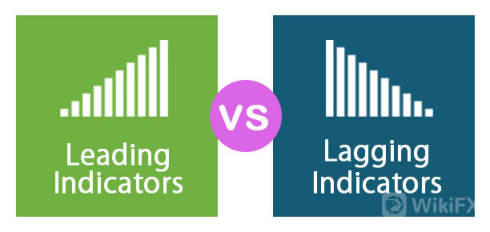
In general, indicators are indispensable in trading to provide mapping information on market conditions which can be used to determine the right strategy in providing information and analyze market price movements and market trends. As follow, the Leading and Lagging indicator in which commonly found in trading:
The leading indicator tends to moves before the price moves or lead price movement, it assist the trader to predict and anticipate future price movements so that it mostly guides traders before making decision. This indicator mostly suitable for the short-term traders. Even sometime the accuracy is not completely correct without assisted with other indicators. The leading indicator can give a faster entry signal, but it is also possible that the signal it points to is a false signal. In conditions like this, the skills and experience of each trader become one of the important keys to avoid signal errors. The advantage of this leading indicator is that it can confirm price movements from only 1 candle, so it will be very helpful in making quick entry decisions. Some examples for leading indicators are Stochastic, Williams R, OBV (On Balance Volume), Pivot point and etc.
Lagging indicator is an indicator which reacted after the price movement, so it used to confirm on trends and provide fewer buy-and-sell signals when there is no trend. However, lagging indicator provides information on how far the price has gone, how long the period has taken, and what levels have been reached. It is informed traders when the right time to get the opportunity to reap maximum profit. Some examples of this lagging indicators are Bollinger Band, Keltner channels, Parabolic SAR, ATR (Average True Range) and etc.
1. b). With relevant screenshots from your chart, give a technical explanation of the market reaction on any of the examples given in question 1a. Do this for both leading and lagging indicators.
Chart of Leading Indicator:
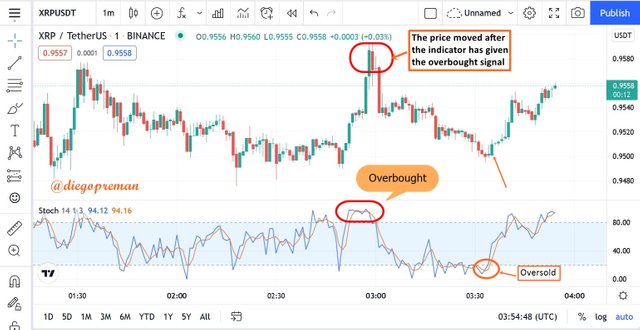
As can be seen from the picture above, stochastic gives an early signal when it is overbought or oversold so then the price tends to react move down or move up. Given this information, traders will take advantage of this signal to buy or sell. Stochastic is an oscillator which function is more inclined to momentum which provides information to buy or sell, when a cross price appears in the Overbought area, mostly it indicates bearish movement (death cross) indicate to sell signal. Then when a cross price in the oversold area, mostly it will indicate bullish movement (golden cross) indicate to buy signal.
Chart of Lagging Indicator:
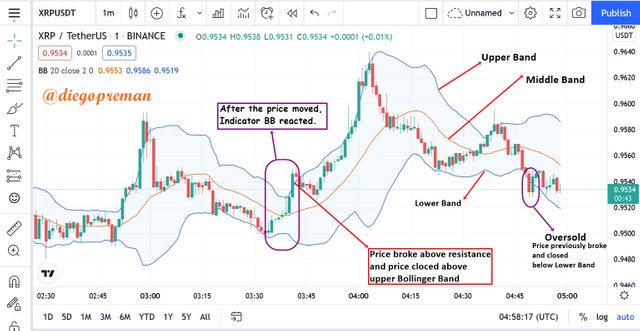
As picture shown above, series of 6 candlesticks in bullish position appear followed by the upper band line. Bollinger Bands has function to measure the volatility of price movements and estimate the range of price movements. This indicator consists of three lines that move following the price movement. The three lines in question are the upper band (Blue Line), middle band (Orange Line) and lower band (Light Blue Line).
2. a) What are the factors to consider when using an indicator
- Acknowledging the market trend and predicting trend movements.
- Knowing the right time when and how to use the exact indicator. We do not need to use indicators too much because the most important thing here is the ability to interpret the right signal correctly.
- Choose a technical tool that suits a trader's understanding, test its suitability, then use it consistently, such as understanding price action and chart pattern analysis.
- Understand the strategy to determine the moment to buy or sell orders, and set when the position should be closed. In this case, there are several options other than direct buy and sell orders, such as pending orders and exit types with stop loss or take profit.
2. b) Explain confluence in cryptocurrency trading. Pick a cryptocurrency pair of your choice and analyze the crypto pair using a confluence of any technical indicator and other technical analysis tools. (Screenshot of your chart is required).
Confluence is series of factors that point or favor an action together that support while taking profit in a trade. It refers to a situation when several technical tools provide the same trading signal. The confluence will provide information of entry signal for buying and selling opportunity, it will become the profits to traders if they know how to use it correctly.
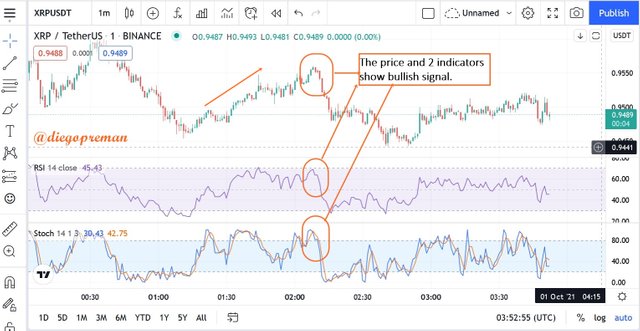
As shown by the chart above, that chart of XRPUSDT is using two difference indicators. RSI (Relative Strength Index) indicator and Stochastic are used together which reacted the same as the price in bullish (uptrend) position. So that the price(candlestick bar) and 2 indicators show the same result (bullish) at the same time.
3. a) Explain how you can filter false signals from an indicator.
False signals are usually happened when a false break, or the price has broken strong resistance / support, but reverses direction, resulting in an error break. So that to find out the condition of a false break, a trader should wait for the candle which is indicated as a false break to be intact. A trader will be able to enter the next candle, after it is confirmed by technical indicators. False breaks can occur in all time frames, but the higher the time frame, the more accurate it will be because at low time frames there is a lot of noise or signal errors.
How to Filter False Signals:
- The choice of time frame determines the quality of the signal as the frequency of the appearance of the candlestick bar depends on the high and low of the time lag. False signals will appear more often on low time frames. So, when traders use the M15 option for example, where every new bar will appear every 15 minutes, then price action patterns will appear in low quality and indicators will move up and down with high fluctuations. Therefore, it is better to use the daily than minutes option for beginners so that the trading signals that are raised have a higher level of validity.
- Before reacting to a signal, traders should know where the support and resistance points are. This is important because of the repetitive nature of the market. The price is most likely to bounce around the boundary point, except in the case of a breakout (the price moves far beyond the key support/resistance limit). False signals usually appear before the price moves to touch these limits. Say when market conditions are trending a reversal signal appears. If traders open a position based on the signal without knowing where the resistance/support line is, they will most likely be stuck with a false signal.
3. b) Explain your understanding of divergences and how they can help in making a good trading decision.
Divergence is a pattern that can provide information on the potential direction of a strong trend. There is different price between candlestick and the indicator. It is very useful to identify when the trend is continuous and when the trend is start to slow or reverse. It is called Bearish Divergence If there is a movement between the price and the indicator as the price is still moving up but on the other hand, the indicator has been moving down. Bullish Divergence is when the price is still moving downwards, but according to the indicators, it has moved up. This means that there is something that deviates or there is a difference in movement between the price and the indicator. Thus, it indicates that there is a potential to make a reversal. If the correlation between the price and the indicator is positive, showing no divergence at all, we can say, it's convergence or nothing to worry about, and the price will still move in its direction. However, by acknowledge this signal, traders are able to know better whether a trend will continue its movement or weaken and potentially experience a reversal.
3. c) Using relevant screenshots and an indicator of your choice, explain bullish and bearish divergences on any cryptocurrency pair.
Bearish Divergent Chart:
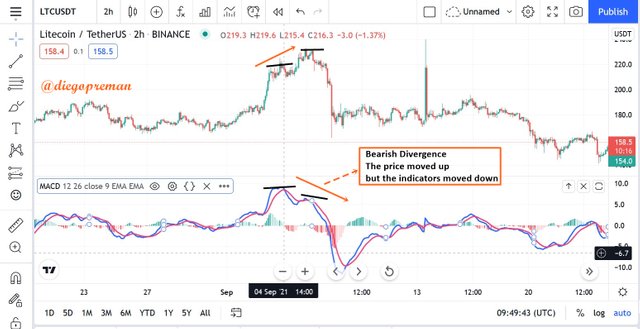
The chart shown that the price of LTCUSDT is making a swing, then it managed to break out of the upper, the price continues higher high with the second swing. While in MACD indicator, it doesn't experience the same as prices, but instead it crossing below create lower low. It is described that when the price moves up, while the indicator moves down to the bottom, this is called Bearish Divergence or there is divergence between the price and the indicator. It is a sign where a trend or price increase has started to weaken.
Bullish Divergence Chart:
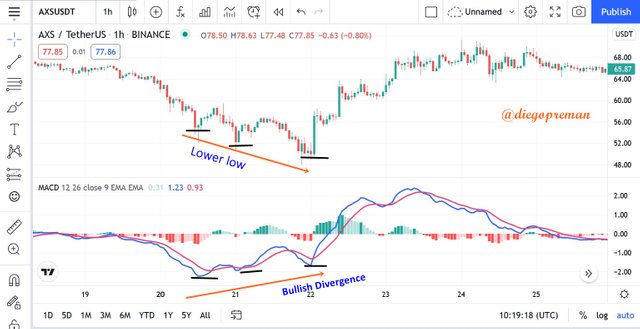
The chart shown that the price of AXSUSDT has decreased (Bottoming), and then create lower low. While at the MACD indicator, there is a crossing and create lower high, this is called Bullish Divergence. Indicator MACD gave a buying signal.
CONCLUSION
Acknowledge the strategy of using technical indicator is very helpful for beginner in trading as it will provide information on how the market conditions are, price movement or trends and also to help provide buy or sell signals. There is no best or most accurate indicator, as it all depends on the way of trader’s trading needs, conditions, and time frame. It is very useful to combine some of the indicators to generate the desired profit.

Hello @diegopreman, I’m glad you participated in the 4th week Season 4 of the Beginner’s class at the Steemit Crypto Academy. Your grades in this task are as follows:
Recommendation / Feedback:
Thank you for submitting your homework task.
Thank you for your suggestion Professor, I will improve it at the next task.