Crypto Academy Season 3 / Week 8 / Homework Post for [@asaj] / CRYPTO ASSETS AND THE RANDOM INDEX (KDJ)
In your own words explain KDJ indicator and how it is calculated
A random index or what is often referred to as KDJ is an indicator consisting of three lines, there is a J and plus two other lines called K, and D. Random indices are often used to analyze the price of gold, stocks, and other assets. Because this is an indicator that indicates a trend, experts often recommend traders to use this indicator, because this indicator is suitable for short term and mid term types.
The KDJ indicator is very similar to the sochastic oscillator indicator which utilizes the speed of asset price fluctuations to determine when a possible reversal can occur. It can give a signal to traders that the market is in an overbought or oversold position.
This brings the concept of momentum where the momentum of the asset price will change first before the actual price changes. The working system of the KDJ indicator is to take the current closing price and compare it with the highest, lowest and closing prices in a certain period and then get the index.
As I mentioned earlier that the KDJ random index is very similar to the sochastic oscillator, this means that KDJ is an indicator that is byat after the sochastic oscillator. This indicator has the same range of values as the sochastic oscillator, the price measurement ranges from 0 - 100. If the KDJ value has almost reached or even crossed the value of 100, then the market is overbought. Meanwhile, if the KDJ value has touched or is close to 0 it can be interpreted that the market is oversold.
The KDJ indicator can also provide traders with information about the trend of price movements in the market. This can be seen by looking at the movement of the 3 lines on the KDJ indicator, including the K line, D line, and J line. If the market is in a bullish direction, the J Line will rise beyond the D and K lines. Meanwhile, if the market is in a bearish direction. then line J will fall below line K and D
Another benefit of KDJ is that it can identify convergence in the market. To indicate this, we can see that during convergence, the D line, K line, and J line will all be the same. However, the direction of the J line that has crossed the K line and the D line can be used as a benchmark for buying or selling.
Calculating KDJ Indicator Value
To calculate the KDJ value, there are some information from the formula that we must know first.
CN: Closing Value Of The Day
LN: Lowest Value Of The Day
HN: Highest Value Of The Day
- Reverse Value (RSV)
RSV = (CN - LN) / (HN - LN) * 100
The RSV value will be between 1 to 100
K-Line scores
K = 2/3 * Previous K value + 1/3 x RSVD-Line value
D = 2/3 * Previous D value + 1/3 x KJ-Line value
J = 3 * D - 2 * K
Is KDJ indicator is reliable? Explain
There are several things that make the KDJ indicator very good to use when trading. The first thing is that it has 3 lines which are respectively referred to as K line, D line, and J line, these three lines are able to show traders to enter trades whether it is a sell or buy position and also this indicator has a J line which is used as a the divergence of line D and line K.
Another thing we can get from the KDJ indicator is that it very often gives signals when trading in analyzing the trend of market movements, this we can see the KDJ indicator which often gives signals that are sometimes wrong so that there are some novice traders who get stuck with signals. this fake. Traders who are used to using the KDJ indicator will definitely combine it with other indicators for a more accurate analysis of market performance. There are several indicators that are often used as supporting indicators such as: Average Directional Index (ADX), Moving Average, Average True Range Indicator (ATR), etc.
Still we have to know that none of the indicators can generate profits for the trades we do, each indicator has its own advantages and disadvantages, just like the KDJ indicator can indeed provide traders with entry and exit signal information about trend price movements so that traders can enter at the ideal price. And there are also several occurrences of false signals that I have previously described given by KDJ. So in my opinion the KDJ indicator can be used as an indicator in determining the process of entering a trade with a note that it must be accompanied by confirmation of other supporting indicators.
How is the random index added to a chart and what are the recommended parameters? (Screenshot required)
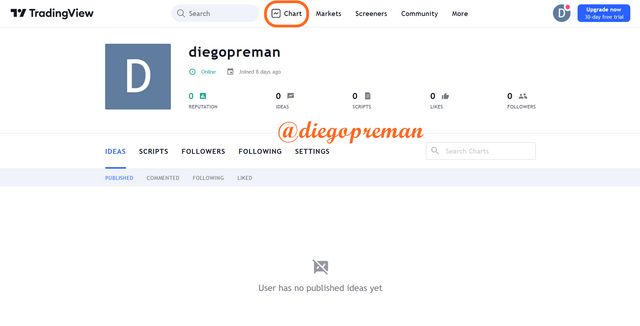
To enter the KDJ indicator on the chart is very easy, first we select the Chart button so that we can enter one of the cryptocurrency charts.
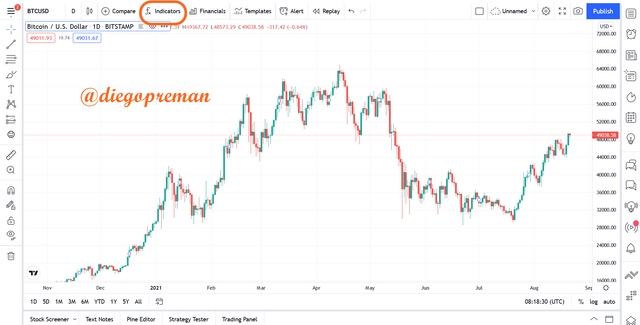
After the chart opens, select the Indicators button at the top of the chart.
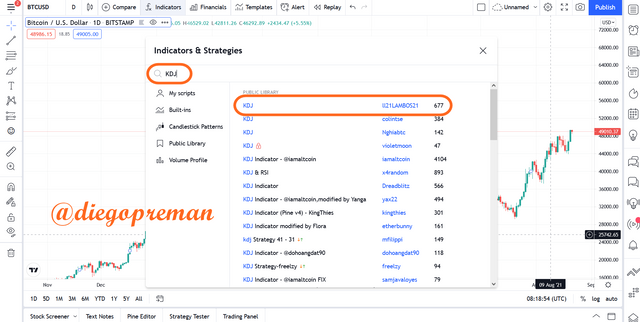
Look for the KDJ indicator in the search column and there will be many choices of KDJ indicators to choose from, choose the top choice made by ll21LAMBOS21, this is because his KDJ indicator has been widely used and liked by many people.
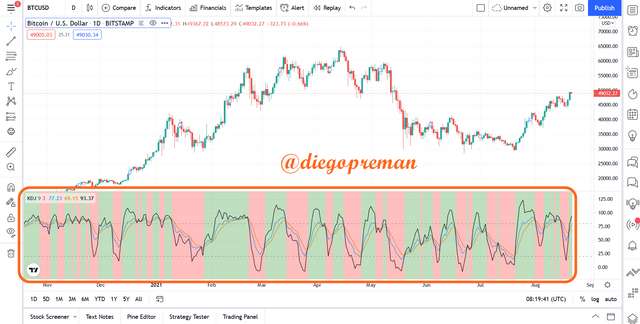
The KDJ indicator will appear at the bottom of the chart.
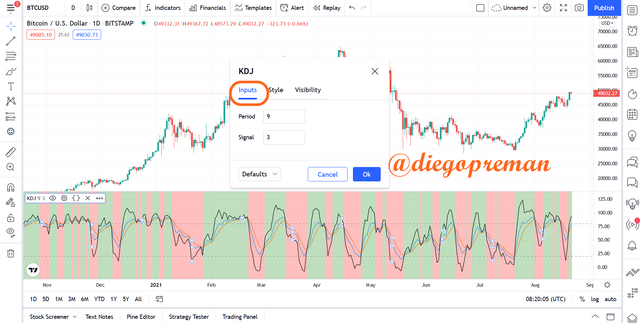
We can adjust the KDJ indicator according to our wishes, in the Inputs menu we can change the period and signal according to our trading style.
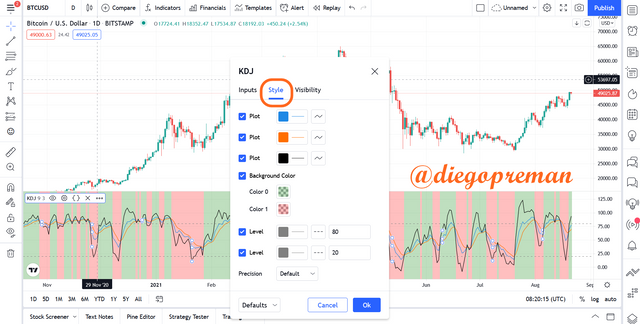
On the Style menu we can change the color and outline of the KDJ indicator, we can even change the background color of the KDJ itself.
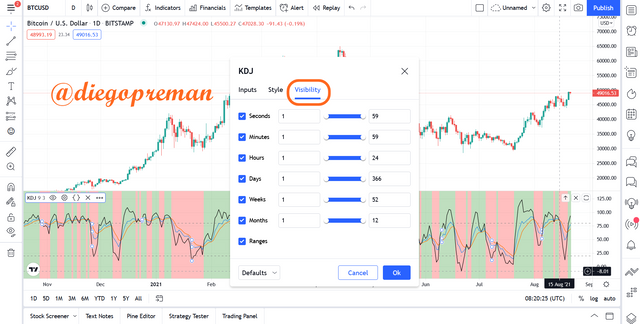
And on the last menu, Visibility, we can change various things such as the time in seconds, minutes, hours, days, etc.
Parameter Recommended For KDJ Indicator
I advise you to use the default parameters that have been created on the KDJ indicator, usually the default setting is Period or Length is set to 9 because these are the most reliable and accurate in trading with the KDJ indicator. Meanwhile, in viewing and determining oversold and overbought there are two lines that are set at level 80 and level 20.
By using this default rule, traders will avoid the many false signals given by the KDJ indicator, I have discussed this before where KDJ is an indicator that has a high level of sensitivity so that it will give a lot of signals, most of which are false signal if we make a different period length setting than the default setting.
Differences between KDJ, ADX, and ATR
To find out the difference between each indicator, I will first explain the indicators.
Average Directional Index
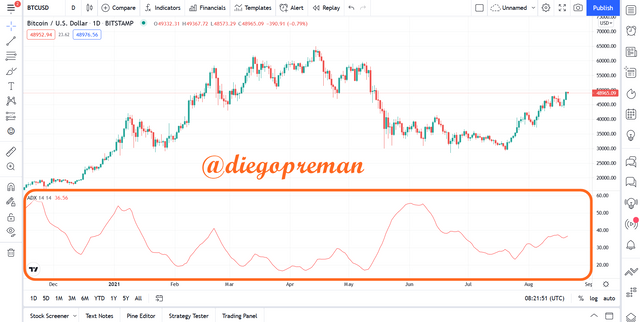
ADX is an indicator that is used to see the strength of the current market trend. What you should know is that the trend strength of a market is a very important factor because it will help traders make decisions that lead them to earn more profits. ADX itself moves based on the MA of the asset price within a certain period of time.
ADX has a range of values that is used to see the strength of market trends, if the ADX value is between 0 and 25 this indicates that the trend movement is weak, very weak or there is no trend in the market. The range above it is 25 - 50 which indicates that there is a trend occurring in the market, then if the ADX value is between 50 - 75, this indicates that there is a strong trend occurring in the market and the last if the ADX value is between 75 -100 , this indicates that the current trend in the market is very extreme.
For an example of the ADX indicator, you can see in the graphic image below.
Average True Range
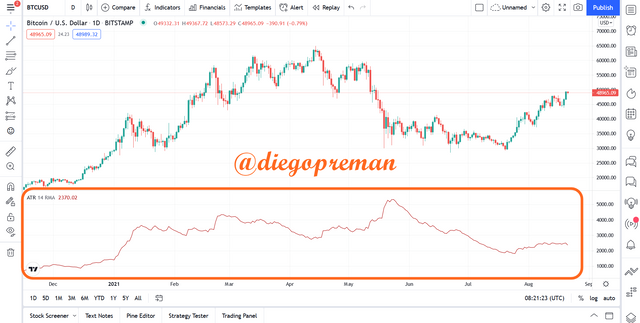
ATR is an analytical indicator used to see the movement of an asset in the market related to volatility. Knowing the volatility of an asset in the market will make traders more flexible in making decisions when trading. If the ATR value has a high value, this indicates that the volatility is high, then if the ATR value is low, the volatility in the market is low.
Traders will use this indicator as a benchmark for entering and exiting the market. If you look at the chart, ATR only has one line, this is different from KDJ, which has 3 lines at once which can show the direction of the movement of the market trend.
For an example of the ATR indicator, you can see in the graphic image below.
Difference of Three Indicators (KDJ, ADX, ATR)
Based on my explanation above, there are some differences that we can get between the three indicators.
| Parameters | KDJ | ADX | ATR |
|---|---|---|---|
| Use Cases | Seeing the trend direction | Seeing the strength of the trend | View market volatility |
| Lines | 3 lines | 1 line | 1 line |
| Default setting | Default period 9 | Default period 14 | Default period 14 |
Use the signals of the random index to buy and sell any two cryptocurrencies. (Screenshot required)
For an example of trading using the KDJ indicator, I used Paper Trading which provides a demo account so we can do two-way sample trades.
1. Short Position (SUSHI/USD Timeframe 1 minute)
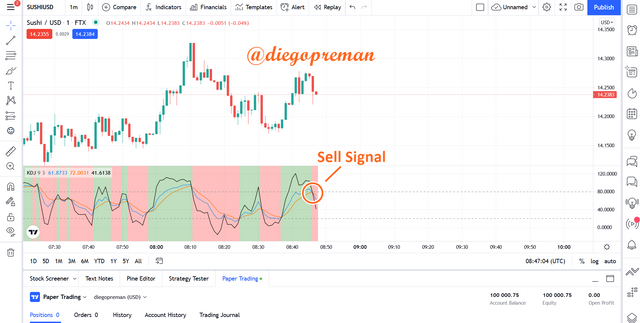
In the chart above we can see that there is a cross between the J line with the K and D lines on the KDJ indicator heading downwards, this gives a signal for us to enter a trade with a Sell position.
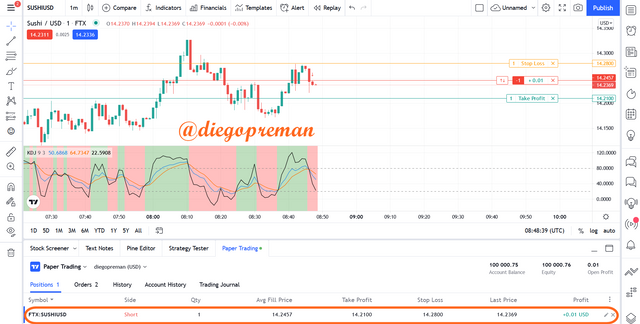
Then I placed a sell order at $14.2457 and I also placed a take profit point at $14.120 and a stop loss at $14.280.
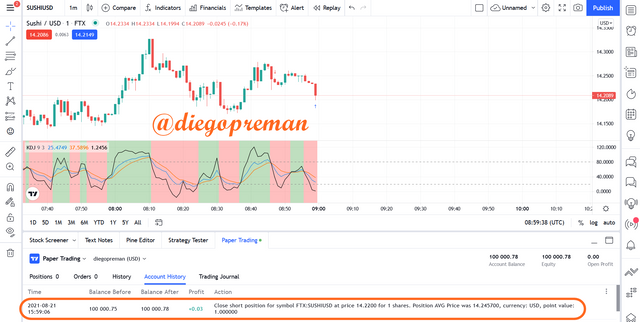
From this trade I managed to get a profit of $0.03.
2. Buy Position (MATIC/USD Timeframe 1 minute)
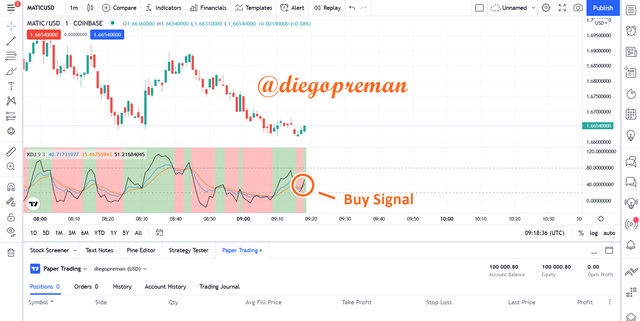
In the chart above we can see that there is a cross between the J line with the K and D lines on the KDJ indicator heading upwards, this gives a signal for us to enter a trade with a Buy position.
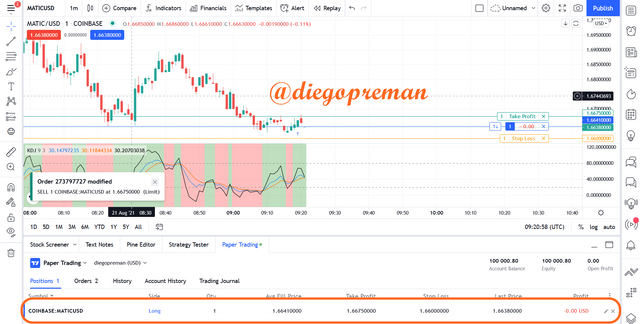
Then I placed a buy order at a price of $1.6641 and I also placed a take profit point at a price of $1.6675 and a stop loss at $1.6600.
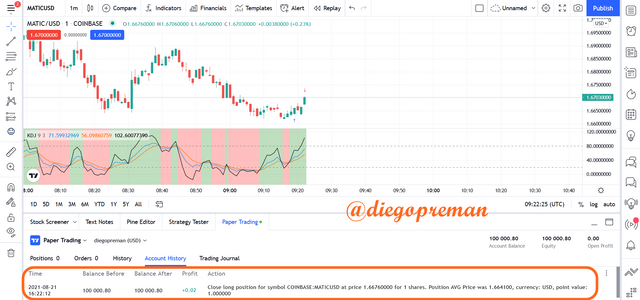
From this trade I managed to make a profit of $0.02.
Conclusion
Each indicator has its own advantages and disadvantages, just like the KDJ indicator. I think this indicator is good at giving buy or sell trade signals because it is very sensitive to trend movements in the market, but because it is too sensitive it often gives false signals. To reduce this we can use several other supporting indicators so that every trade we make will be more secure and we avoid losses due to these false signals.
Cc: @asaj
Good job @diegopreman!
Thanks for performing the above task the eighth week of Steemit Crypto Academy Season 3. The time and effort put into this work is appreciated. Hence, you have scored 6.5 out of 10. Here are the details:
Remarks
You have demonstrated a good understanding of the topic. You have performed the assigned task excellently. However, you did not provide new information to this course. Also, you did not provide the level of details we look out for in the academy.