Crypto Academy Season 3 / Week 7 / Homework Post for [@yousafharoonkhan] / HOW TO CREATE AN ACCOUNT ON TRADINGVIEW, HOW TO USE INDICATORS, TOOLS, FEATURES OF TRADINGVIEW
Defining the TradingView site and how to register an account in tradingview? what are the different registration plan?(screenshot necessary)

TradingView is a platform created to forecast market price movements of assets, the available markets are forex, cryptocurrencies, stocks, gold, etc. All of these assets are assets that are frequently traded by investors whether they are beginners or professionals.
Its main function is to show a series of indicators and tools for forecasting charts which these tools are very important when carrying out activities such as trading to be more efficient.
This website has been running since 2011 and it is a website that can be accessed for free. However, even though it's free, there are some functions that are limited to members only, to become a member we have to pay to be able to use indicators and more specific information.
TradingView has a system that can be used by both beginners and experts in trading, TradingView can adapt to offer services according to the level required.
1. Creating a TradingView Account
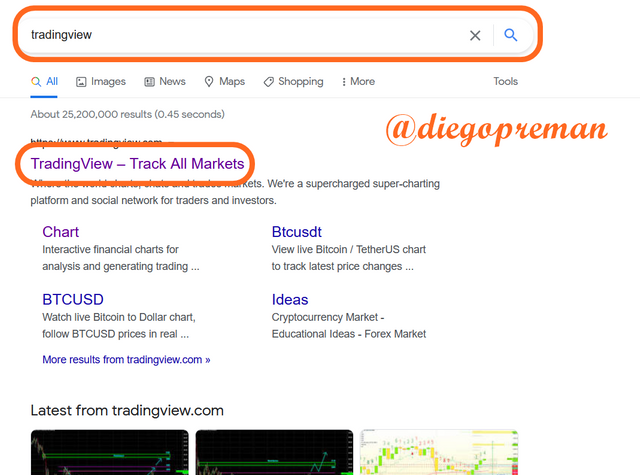
To create an account on the TradingView website, the first thing we have to do is first visit the official website of TradingView, we just need to write "tradingview" on google then we will be given the website address of the tradingview which is at the top of the search results.
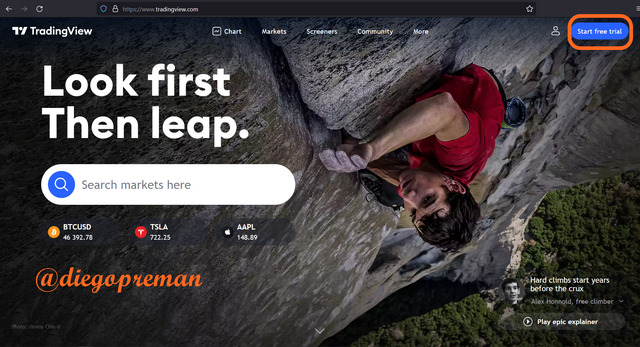
After we enter the TradingView website, we select the "Start free trial" option on the top right of the page.
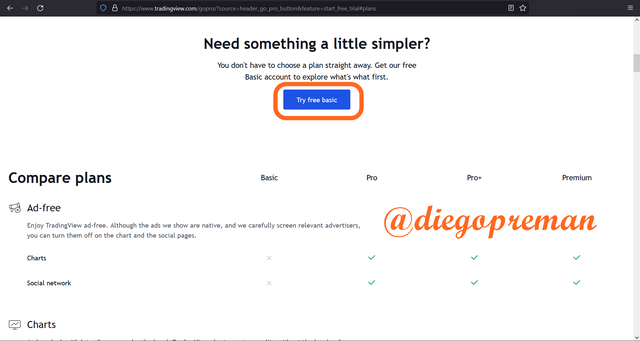
Then we have to select "Try free basic" to create an account for free.
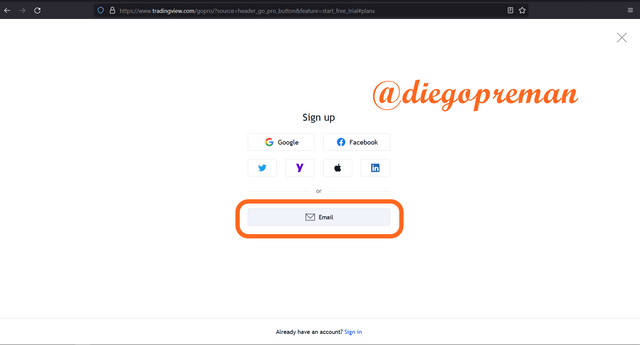
To continue the account creation process, select the account creation option using email.
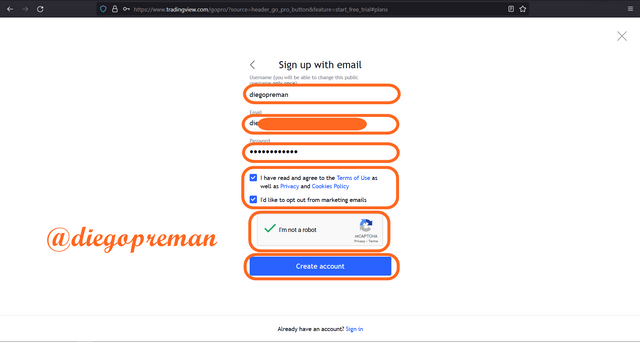
Then we enter the username we want in the first column, after that we enter the email, password, and other things that you can see in the image below. After all is done then we select "Create account".
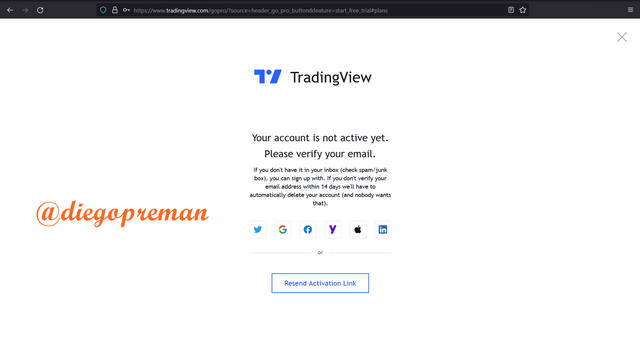
Then there will be a notification telling us to verify the email, the verification link has been sent to our email, so we will open the inbox in the email first.
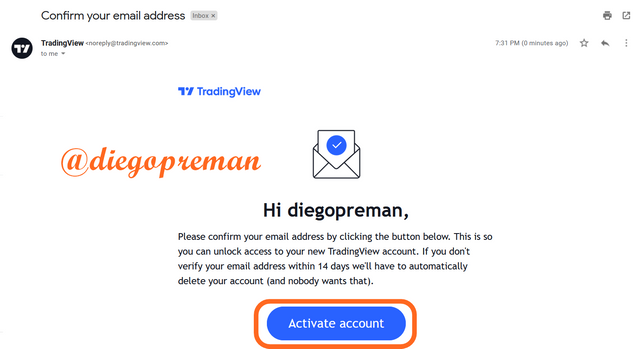
In the contents of the email sent by TradingView there will be a button to verify the email, click on "Activate account".
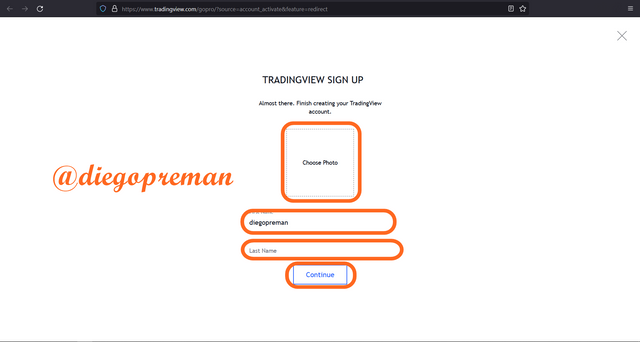
After that we will enter a profile photo with the first and last name. Here I only enter the first name because the other options are optional.
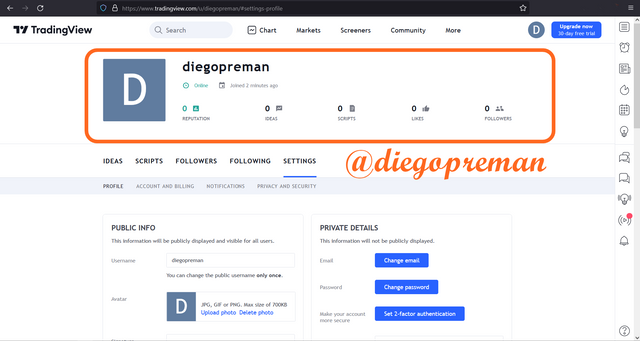
If all processes have been completed, then our account has been successfully created. To prove it we can go back to the TradingView website and look at our profile settings.
2. Types of registration plans on TradingView
The steps for creating a TradingView account that I explained earlier are free account creation. However, on TradingView we can take the option of creating an account in several other more professional versions, and of course these accounts are paid, the payment methods offered are divided into 2 methods, namely monthly and yearly which we can choose according to our budget. The types of paid accounts are:
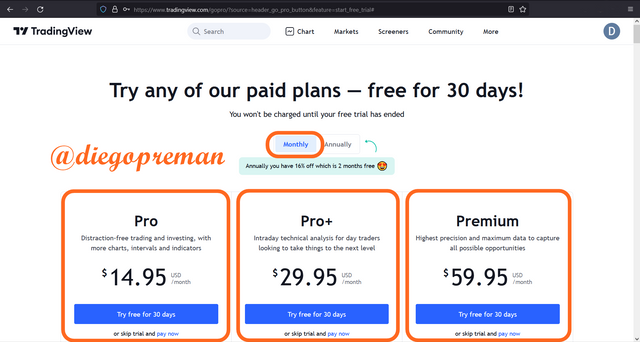
- Monthly Account Payments
In the monthly payment method we are given different account types that have different payment prices, as for the account types, including: Pro for $14.95, Pro+ for $29.95 and the last Premium for $59.95.
- Monthly Account Payments
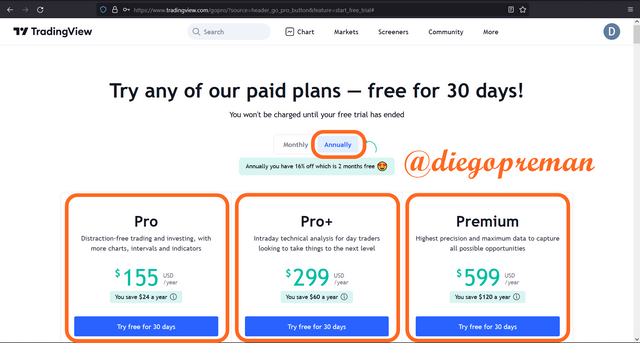
The next payment method is annual payment, in this method we only need to pay once a year and there are different types of accounts that have different payment prices, as for the types of accounts, including: Pro for $155, Pro+ for $299 and the latter is Premium for $599.
Explain the different features of tradingView and what is your favorite feature and why?(screenshot necessary)
After all that I have explained in the previous discussion, of course you are already starting to wonder about what features TradingView provides to its users. To see these features we can see it on the start page of TradingView which is at the top.
1. Chart Features
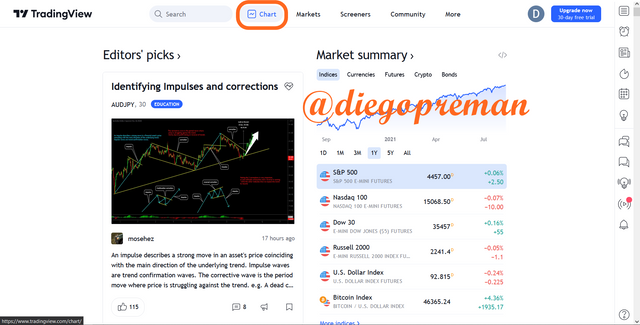
The feature which is the most prominent feature of TradingView is the Chart feature. In this feature we will be given a chart that we can use to monitor the price movement of a cryptocurrency. This feature also provides tools and indicators that serve as auxiliary tools for traders to be able to predict cryptocurrency price movements more accurately.
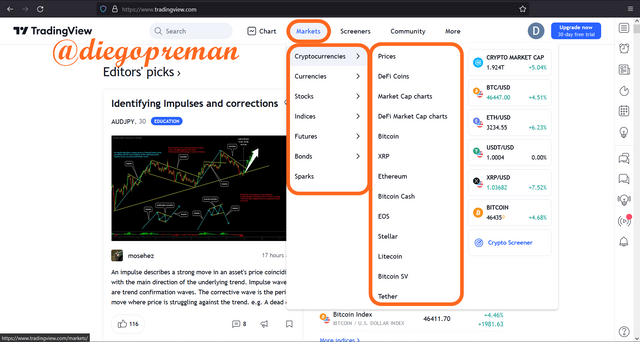
2. Market Features
This feature gives us wider options to choose which market we want, the markets provided include: Cryptocurrencies, fiat currencies, stocks, futures assets, etc. With this market variation, it will not be difficult for traders to monitor any market price movements.
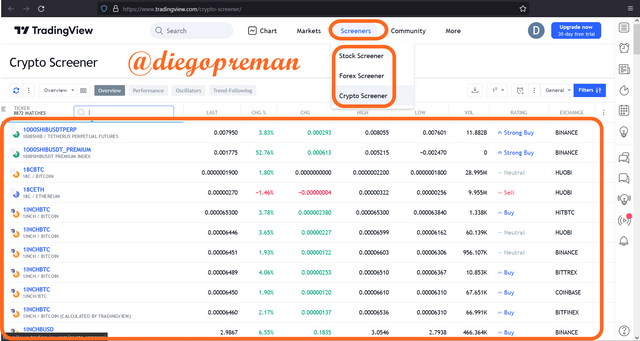
3. Scanners Features
The scanners feature is a feature that makes it easy for us to filter various assets to suit the wishes of traders. This feature will make it easier for traders to make their choices when trading an asset.
The TradingView feature I like the most.
Of all the features that I have mentioned above, there is one feature that I think is the most useful and I really like that feature, which is the scanners feature.
Because this feature is a feature that cannot be found on other platforms, on other platforms this feature is an exclusive feature that is only accessed by users who make monthly or annual payments. however in TradingView this feature is accessible to its users in general, and this is a very amazing thing.
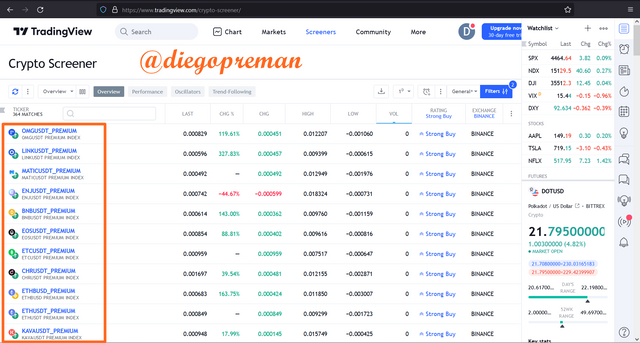
I will give an example of the use of this scanners feature. This time I want to monitor the cryptocurrency market which is going through a strong buy phase, and I also want these markets to only exist on the Binance exchange. So to filter out other markets that don't meet the criteria I want, I will filter them using this scanner feature.
The first thing I did was to change the rating of the trading movement by selecting "Strong Buy".
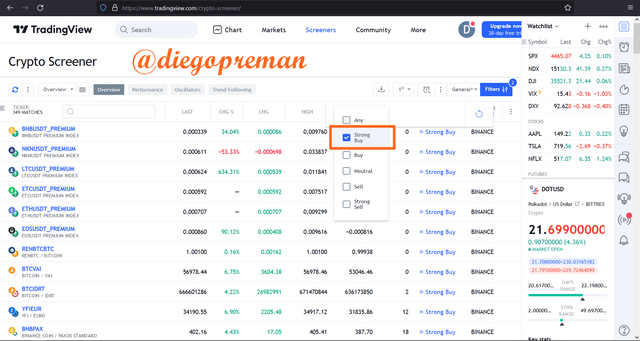
After that I select the only exchange detected is Binance in the "Exchange" column.
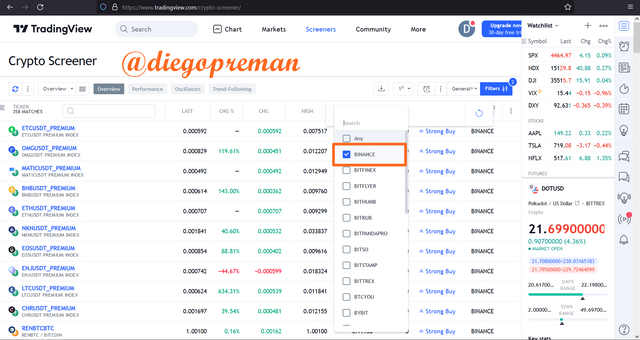
After all of this is done, we will only be shown cryptocurrency markets on Binance that have a Strong Buy trading rating.
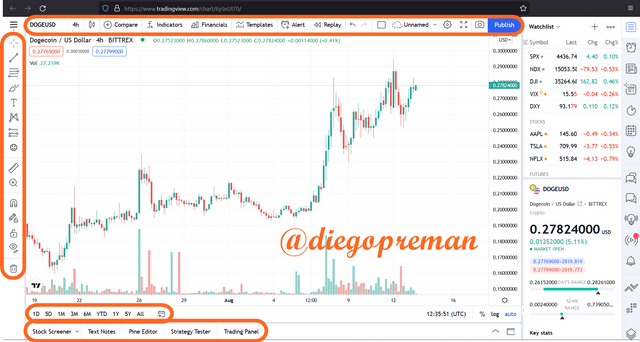
How to set up a chart in TradingView and use two tools to edit it.(screenshot necessary)
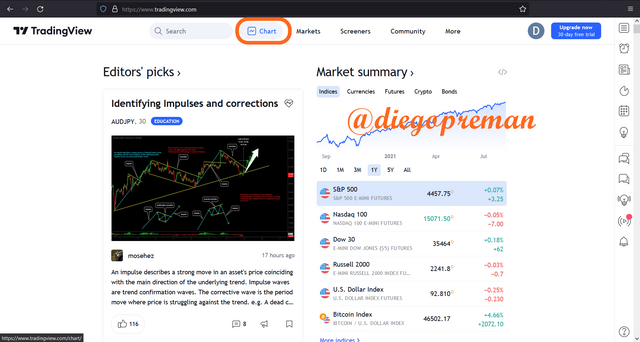
To set up a chart on TradingView what we do is select the "Chart" feature on the TradingView home page.
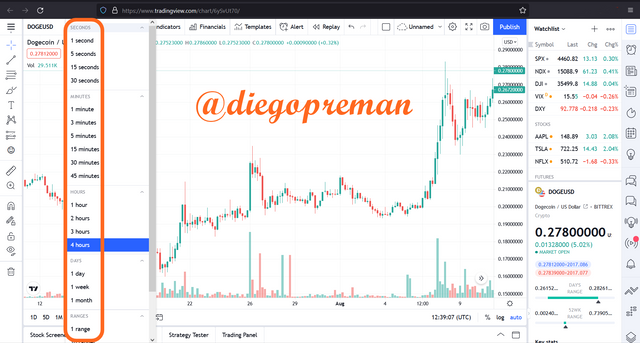
After the chart appears, we are free to do whatever we want on the chart. For example, we can change the displayed timeframe according to our wishes, this timeframe is divided into 4 parts, including: seconds, minutes, hours, days, and ranges.
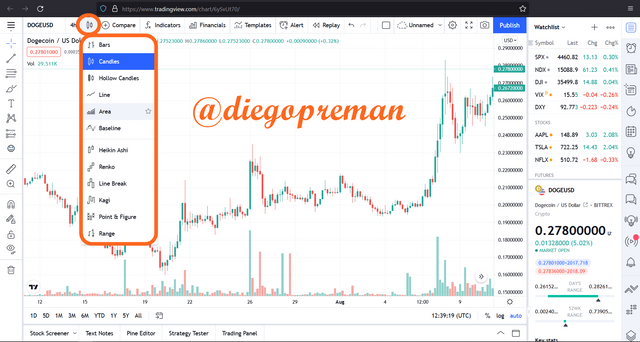
The next thing we can do is change the chart type. Initially all charts will use candle-type charts, but we can change them to other types of charts such as: Bars, Hollow Candles, Lines, Areas, etc.
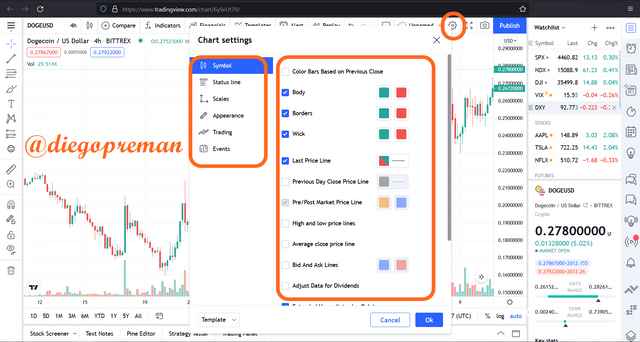
Then in the settings menu we can change several things related to charts such as editing chart symbols, changing status lines, changing scale, etc. For more details you can see in the image below.
Using 2 tools on TradingView chart
Actually there are lots of tools that we can use in TradingView, but this time I will explain 2 tools that I think are very important if we want to trade.
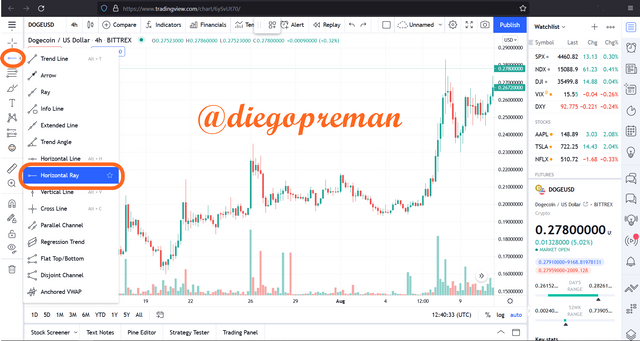
1. Horizontal Ray
This tool is a tool that helps us to see the price of a candlestick that is formed on the chart. The way to use this tool is to select it in the tools column on the left of the graph, for more details you can see in the image below.
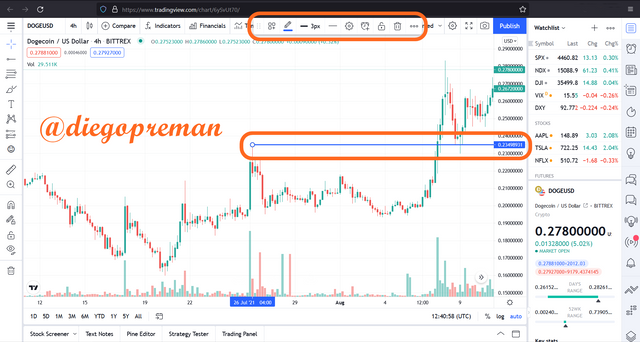
Once you've selected the Horizontal Ray tool, all you have to do is choose at which point you want to see the price. For example, as in the picture below, I choose a point on the chart, then after that there will be a horizontal line to the price column on the right so that it shows the price at that point. We can also edit the line in the settings pop-up that appears at the top of the chart.
2. Long Position
This tool is used to determine when we should enter a trade and we can determine the take profit and stop loss levels. To select this tool, you just need to select it in the tools column on the left of the graph as before, so you can see it more clearly in the image below.
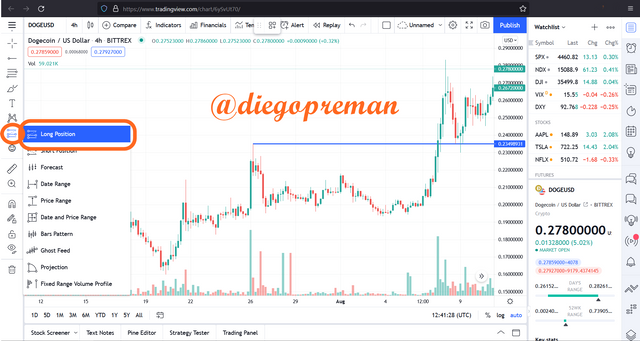
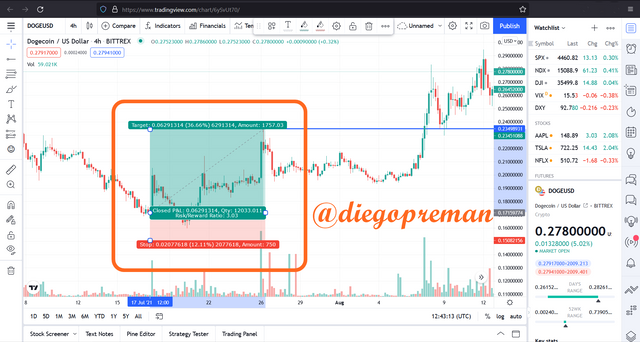
To use it, you just have to choose at which point you will enter and at which point you will take take profit. After that, 2 areas will appear with different colors, green as the take profit level and the red area as the stop loss level. You can adjust the ratio according to each trade.
Explain how to add indicator in chart, what is your your favorite indicator and why? (screenshot necessary)
As I explained earlier that one of the uniqueness of TradingView is the presence of indicators that can really help traders in trading.
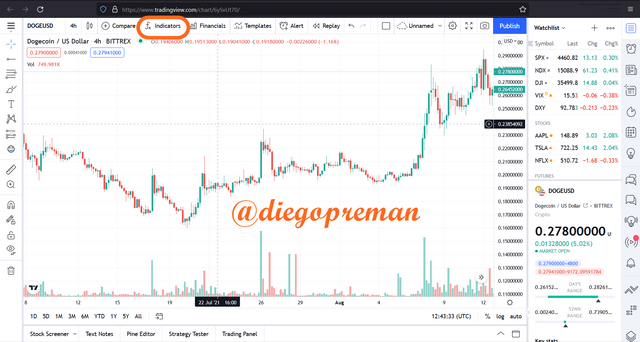
To use these indicators the first thing we do is select the "Indicators" option at the top.
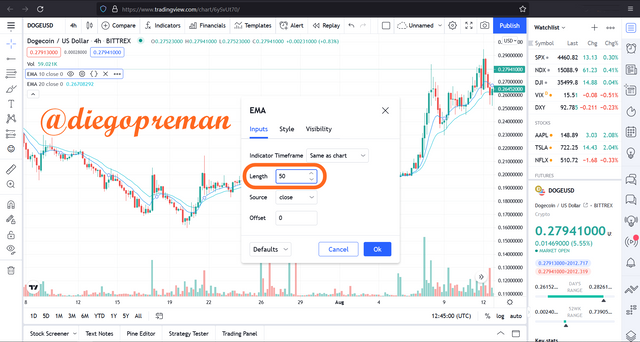
After that we look for the indicator we want, here I give an example of how to put the Exponential Moving Average (EMA) indicator on the chart. After the choice of indicators appears, we just have to choose the indicator, because I want to use 2 types of EMA so I choose the indicator 2 times.
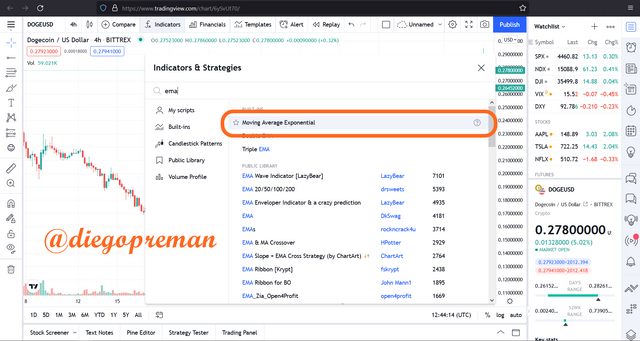
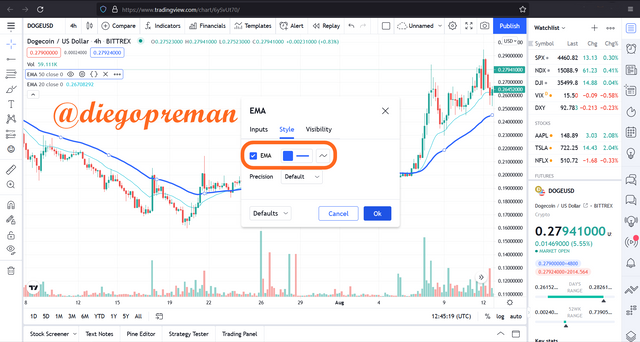
I will reset the length of the two indicators to have different lengths, the length of the first EMA is 50 and I make this first EMA color blue.
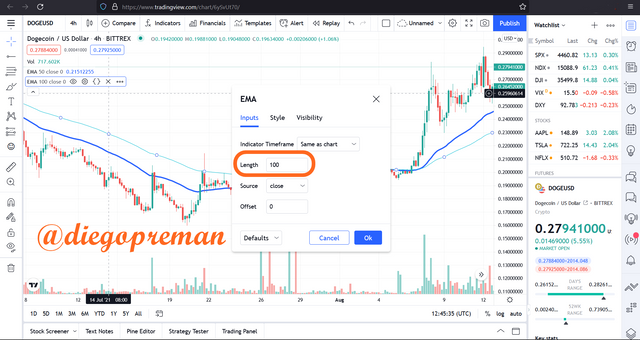
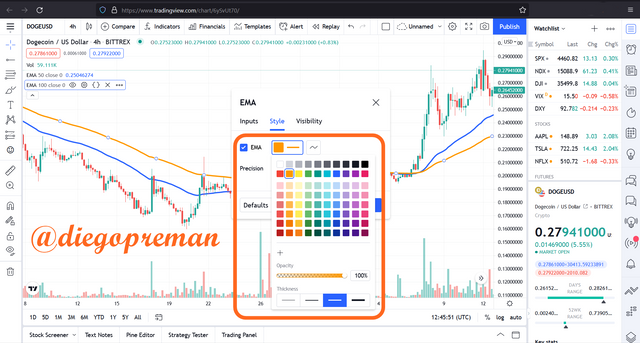
For the other EMAs I set the length to 100 with the color orange.
The reason I chose the Exponential Moving Average (EMA) indicator
The main reason why I chose this indicator is that it can give traders a strong signal to start trading and it also gives a signal for traders to sell their cryptocurrency. In other words, this indicator has a function to provide when the Bullish trend starts and when the Bearish trend starts.
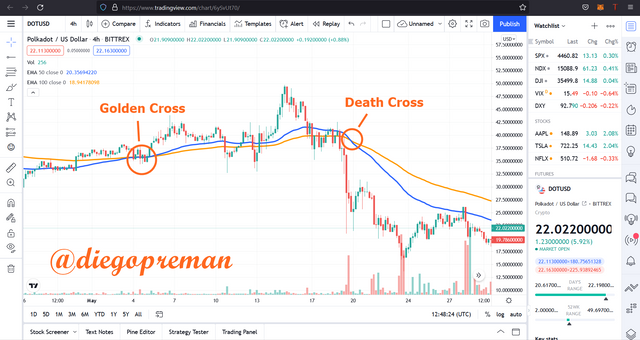
The start of these trends is indicated if there is a cut that occurs between the two EMA lines. The Bullish-trend will start when the EMA of a smaller length is above the line of the EMA of a larger length, this moment is called a “Golden Cross”. While the Bearish trend will occur when the EMA which has a larger length is above the EMA line which has a smaller length, this moment is referred to as "Death Cross". For example, you can see the DOT/USD chart above.
Do you think TradingView is useful in predicting the market for cryptocurrency (trend / price)?
If it's my personal opinion, then I would say that TradingView is very useful for predicting the cryptocurrency market. The information contained in TradingView is very important in terms of identifying market trends and with all of this we can determine whether the market is in what trending phase, whether it is in a bullish trend or even a bearish trend.
Apart from information, TradingView also has many tools that are very useful for traders, tools such as trend lines, rectangles, triangles, brushes, vertical lines, horizontal lines. We can use all of these according to our respective trading styles and get good trades on this website. With this fame, TradingView has become one of the most widely used websites by all people in the world.
And on TradingView there are also indicators that serve as tools to predict the market, such indicators as Bollinger Bands, MACD, EMA, etc. With these indicators, it will be easier for traders to make decisions when trading on a cryptocurrency.
Conclusion
With the various features offered by TradingView, it can make traders who were previously confused about how to make trading easier. TradingView has helped a lot of traders in all corners of the world, the completeness of all its features makes TradingView the favorite website most frequently visited by traders, and the types of traders who visit it vary, some are cryptocurrency traders and traders with other asset trading. such as stocks, forex, gold, etc.
Respected first thank you very much for taking interest in SteemitCryptoAcademy
Season 3 | intermediate course class week 7
thank you very much for taking interest in this class,