Onchain Metrics Part-3 (GIOM, Adjusted Large Transaction Volume)- Steemit Crypto Academy- S5W5- Homework Post for @sapwood

(1) What do you mean by Global In/Out of the Money? How is a cluster formed? Explain ITM, ATM OTM, etc with examples?
GIOM describes the global position of money which is or was being bought at different price points. Throughout its journey of development, every asset should go through fundamental and technical evolution. The crypto market has a very fond memory of the store of value. But the store of value is also defined by the regular and consistent net inflow and outflow.
Investment means inflow, and outflow means de-investment. Hodlers maintain a suitable level and implement a great strategy of investing in BTC and many other stores of value coins. That also creates FOMO when the bull cycle kicks in.
So GIOM is a kind of comparison between the Money into the asset and Money out of the asset. It's not inflow or outflow, albeit it appears like that.
Traders use this indicator to find out where the prices were bought and what their position is. If the price is above the point they have bought it is IN THE MONEY, if it stays the same level, it is AT THE MONEY and if the current price is below the price at which it was bought, then it is OUT OF THE MONEY.
How a cluster is formed?
As for highly liquid coins like BTC, I believe there are buyers at each price level. However, the close ranges are clustered and the size of the cluster increases with the volume. The bought price, how many such close range of prices and the close-range together with volume marks the definition of a cluster.
There is a logical and natural clustering of prices, the number of unique addresses, and the volume. I will discuss how the clusters represent different pockets or concentrations of money in the post, which ultimately lead to support and resistance.
ITM
Clusters have ranges: the upper range and the lower range. The confined boundary of the cluster has the average price based on the minimum and maximum range values.
As long as the current price is higher than the upper range, it is ITM. In that case, all addresses belonging to the cluster are ITM. ITM is denoted by green colour in the indicator chart.
ATM
The price of an asset is ATM if its price is between two limit values. In such a case, some of the addresses will print profits and some will print losses. Such clusters are denoted by grey colour in the chart.
OTM
A cluster that has an asset that is out of the money is one whose price is below the lower range of the cluster. This makes the addresses in that cluster worse off than they were before.
Explain ITM, ATM OTM, etc with examples?
I chose the DOGE coin to explain about the ITM, ATM and OTM.
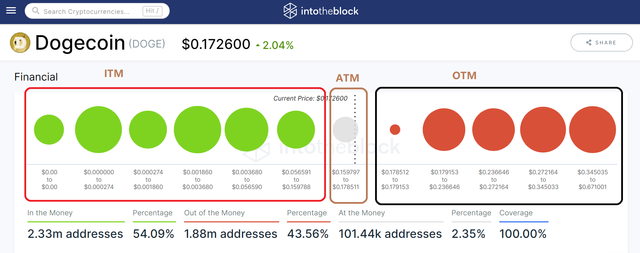
There are two tabs: Address/Volume
The default display is based on the addresses where the relative percentage of ITM and OTM is displayed based on the number of addresses.
As the ratio in DOGE coin sorted by address shows, 54.09% of the addresses are in the ITM category, 43.5% are in the OTM category, and 2.65% are in the ATM category.
Now I switch to the volume setting and check what is the relative percentage.
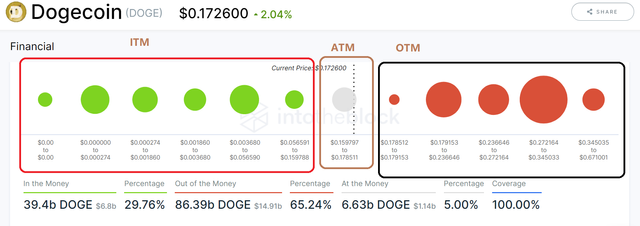
If I sort it by volume the trend is totally different. On Volume, 29.76% are ITM and 65.2% are OTM, the remaining 5% are ATM; a clear indication of the bear trend.
It is noteworthy that this cluster is dynamic, so if an address that holds the asset sends the money to another address, the cluster will be altered. A percentage of the addresses may continuously affect the size and position of different clusters. But in the long term, it is the hodlers who wins it out and they demarcate the significant levels in the chart. They are basically support and resistance.
(2) Explain about Large Transaction Volume indicator with examples? What is the difference between Total and Adjusted Large Transaction Volume? Examples?
Large Transaction Volume indicator
This indicator demarcates the whale's transactions. The whale is akin to what institutional investors are known in the traditional market. Here the indicator records all the transfers above 100000 USD. Any transaction below 100000 USD is considered a retail transaction.
Big players always move the market and set the trend. This is what we know in the traditional system. In crypto also the big players who are popularly known as whales set the trend.
With this in mind, the Large Transaction indicator helps identify such a trend if it arises. This is done with the aid of the visible, open-source record, which allows traders to track such large volume transactions. The on-chain metrics helps to track all the transactions and they grade them into different clusters based on the price points and volume.
Total
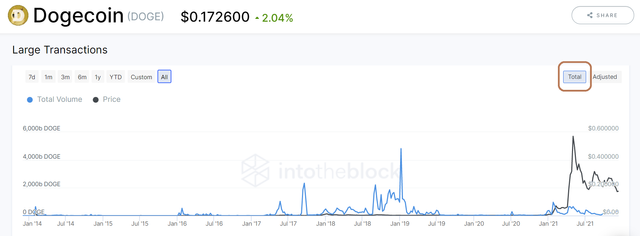
The last total spike in large transaction volume was 962.34 billion DOGE that caused a massive rally and meteric rise of DOGE.
Adjusted
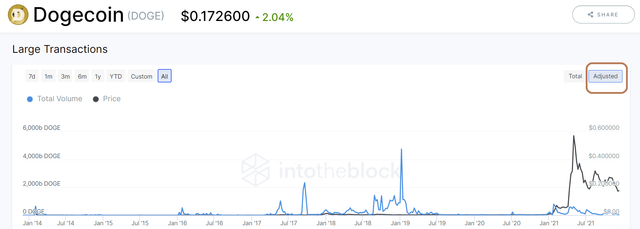
The last adjusted spike in large transaction volume was 788.53 billion DOGE that caused a massive rally and meteric rise of DOGE.
In the past, the large transaction volume went hand in hand with a bullish or bearish trend, especially when the trend was apparent.
If there is a spike in the large transaction volume indicator either it goes bullish or bearish. If a spike is observed the trader can take a position, to know whether that will be bullish or bearish, the trader has to use other supplementary signals.
Difference between Total and Adjusted Large Transaction Volume
'Total' is entire in and out transactions greater than 100000 USD. But the total may give false signals if a transaction keeps rotating between addresses. To filter out the false signals, the adjusted indicator is used wherein the send/return transfer to the original address is eliminated.
So 'Adjusted' is better than 'Total'.
(3) Analyze a crypto asset(other than BTC) using on-chain metric: GIOM, and Adjusted Large Transaction Volume? Ascertain whether it supports a Bullish or Bearish bias or Neutral? How do you find the support and resistance using GIOM? How do you ascertain the upside/downside momentum using GIOM? Use the InTotheBlock app or any suitable app? (Examples/Screenshots)?
I have already selected DOGE coin for this task.
Let me go and explain one by one.
Bullish or Bearish trend in DOGE on GION indicator.
I have already told that there are two tabs: Addresses based GIOM cluster and Volume-based GIOM cluster.
It is important to keep in mind that each has its own validity and that both are integrated into the clusters.
As you can see from the screenshot, the data for different clusters is the same as the data I downloaded from intotheblock.com.
| Start Price | End Price | Average Price | Addresses | Total Volume |
|---|---|---|---|---|
| 0 | 0 | 0 | 162443 | 1122303994 |
| 2.00E-09 | 0.000274107 | 0.000170152 | 531486 | 11258653291 |
| 0.000274108 | 0.001859588 | 0.000725264 | 313619 | 7782687465 |
| 0.001859746 | 0.003679685 | 0.002706291 | 561755 | 4813965658 |
| 0.00367971 | 0.056590379 | 0.023838669 | 452383 | 11755687657 |
| 0.056590513 | 0.159787715 | 0.073961456 | 311779 | 2670844430 |
| 0.159796655 | 0.178511023 | 0.169886072 | 101440 | 6625803787 |
| 0.178512145 | 0.179152656 | 0.178848998 | 9096 | 712963875.5 |
| 0.179152825 | 0.236645665 | 0.211762398 | 416800 | 20826342195 |
| 0.236645781 | 0.272163833 | 0.254873232 | 420517 | 13673514363 |
| 0.272163883 | 0.345032938 | 0.302980036 | 501837 | 46247692436 |
| 0.345035286 | 0.671000545 | 0.479773471 | 531221 | 4929365931 |
The latest price of DOGE at the time of writing this post is 0.01726. The total volume rating as support for this price is 46029946283 with 2434905.
I have obtained the above figures by adding all the values with a price below 0.01726.
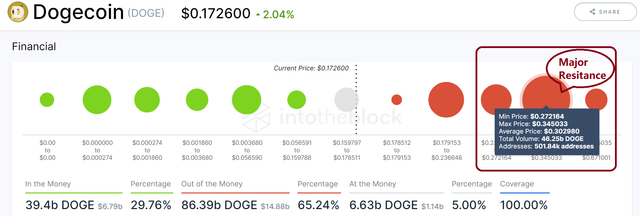
The prices above 0.01726 are the resistances. All the figures added together equal 86369878801 and 1879471 respectively for the total volume and address.
The figures above 0.01726 are the resistances. Price action must surpass the different clusters situated above it in order for it to make new highs. The biggest cluster has an average price of 0.3, 46.25 billion volumes, and 501.24k addresses.
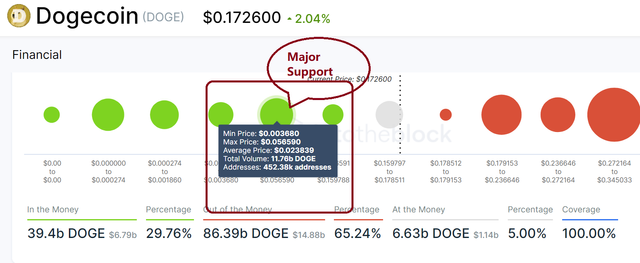
My analysis of the major support is based on GIOM-volume, which shows that the major support area is 0.003680, with 11.76 billion volume and 452.38k addresses.
Ascertain whether it supports a Bullish or Bearish bias or Neutral?
By GIOM- Addresses it is neutral.
ITM= 54.09%
OTM= 43.56%
Not a big difference between ITM and OTM, so it is neutral.
By GIOM-Volume it is bearish
ITM= 29.76%
OTM= 65.24%
Here is a catch, the volume is more significant because the selling pressure is created by bigger volume. The retail trader does not move the market by a big margin.
So GIOM- volume is showing the bearish sign for DOGE as more than 65% are OTM and almost double the ITM.
How do you find the support and resistance using GIOM?
Answer- By colour.
The onchain indicator has already been colour-coded it to give a quick visual of the support and resistance. All the ITM clusters are marked green. All the OTM clusters are marked red and the ATM are marked grey. The colour can quickly change with the price dynamics.
The traders should pay attention to the different volumes and the size of the cluster by volume. Bigger clusters are known to be major support or resistances
How do you ascertain the upside/downside momentum using GIOM?
Upside momentum and downside momentum is determined by the net rise or net fall of either ITM or OTM. If ITM is falling means OTM is rising. If ITM is rising OTM is falling.
Chose the period, find an equal price range. It should be a close range. Check for the same price what is the net difference of ITM and OTM between two points, if it gives positive value for ITM it is bullish, if it is positive value for OTM, it is bearish.
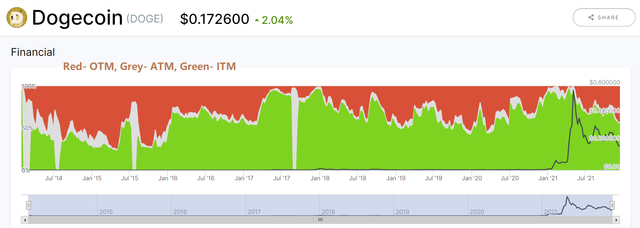
This is the chart from 2015 to 2021. the upper red coloured portion is showing OTM, the middle grey coloured portion is ATM and the bottom green coloured portion is ITM.
I will now find the two distinct points with equal price ranges.
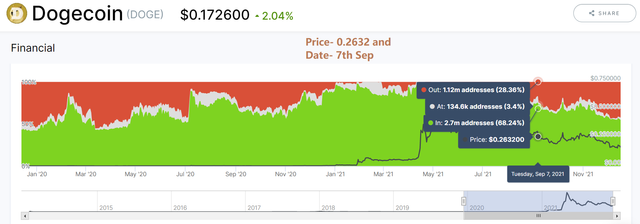
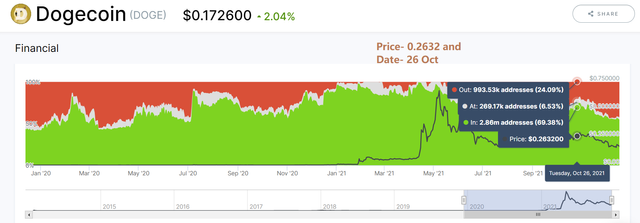
Luckily, I found two price points with exactly the same figure and two different dates.
| 7 Sep | 26 Oct | Net difference | |
|---|---|---|---|
| Price | 0.2632 | 0.2632 | |
| ITM | 2.7 | 2.86 | 0.16 |
| OTM | 1.12 | 0.99 | -0.13 |
For the exact same price, between 7th Sept and 26th Oct, the difference between ITM addresses is positive, grown-up by 0.16 million and the OTM addresses is negative, gone down by -0.13 million. So it is developing bullish momentum during this period.
Brother i want also join crypto academy how can i join
Steemit Crypto Academy- Season 5