On-chain Metrics(Part-3)- Steemit Crypto Academy- S4W5- Homework Post for @sapwood


1. How do you calculate Relative Unrealized Profit/Loss & SOPR? Examples? How are they different from MVRV Ratio(For MVRV, please refer to this POST)?
Before explaining RUPL, SOPR, or MVRV, I have to look at the Market value and Realized value of a coin. And the coin should preferably be a UTXO coin.
BTC is a perfect example of a UTXO coin, and it has also spent more than a decade; enough data is available to get a conclusive pattern of the price movement. So I will keep the entire analysis basing on BTC.
Market Value
Market value is the total market capitalization of a coin, also known as the market cap. The price of a coin occurring at a time (latest price) multiplied with the total circulating supply gives the Market value of that coin. It gives the macroeconomic outlook of a coin or asset.
The circulating supply and the max supply that can ever happen in a coin are always essential to make an informed choice for the investors. For that reason, another variant of the market cap is also used, which takes a fully diluted supply of a coin. BTC has a fully diluted supply of 21 Million and a circulating supply of 18.839 million.
Market cap = latest price x circulating supply

Market value or Market cap of BTC at the time of writing this post= 1.034 trillion
Realized Value
The demerit of the Market cap is that it generalizes all the coins that are in circulation. It does not even recognize the lost coins.
To effectively calculate the capitalization of a coin, the Blockchain data and the UTXO are aggregated, where the historically traded prices are considered to calculate the Realized value of a coin.
Realized value or Realized cap is the aggregate of all the UTXOs price when it was last moved multiplied by its value.
Realized Value= Pirce of UTXO at the time of creation x value
UTXO can have any value. Example; 0.2 UTXO, 0.01 UTXO, 1 UTXO, 5 UTXO, etc.
I will demonstrate it by taking a real example. I will also explore the spent and unspent output using Block Explorer.
I have selected Block height 687459 to explore different spent and unspent outputs. I have highlighted those in the screenshot.
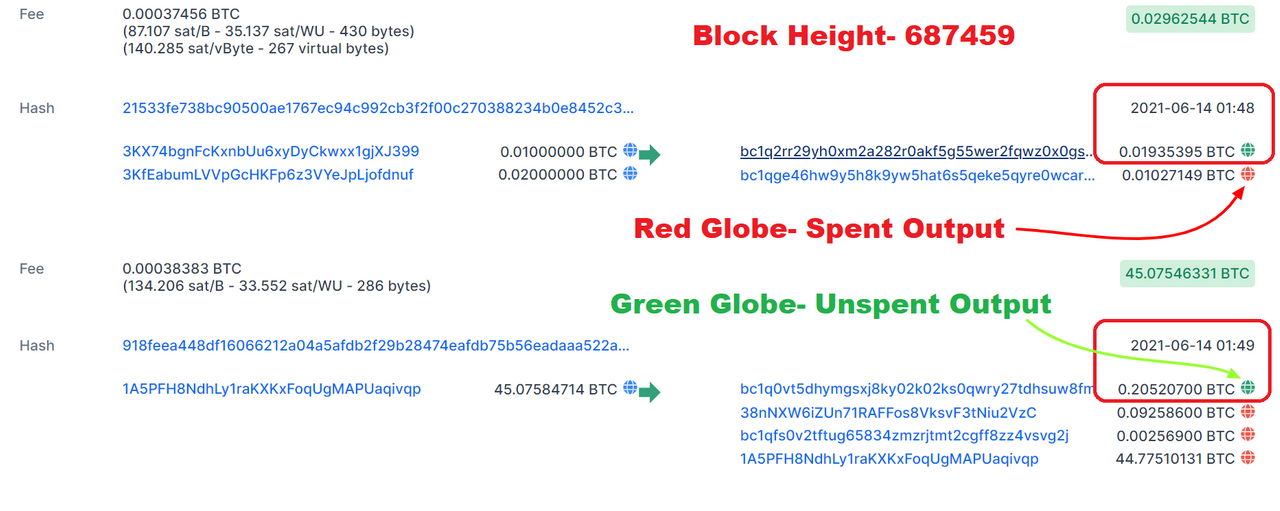
There are two types of globe icons next to the UTXO value; One is a red globe and the other is a green globe. The red globe is already spent and moved to another UTXO, and the green globe is an unspent output.
Then I searched the historical price of Bitcoin on the 14th of June 2021 as both the UTXOs were created on that date using Coinmarketcap. The exact price at that particular time is not available. So I am taking the close price of 14th June. I have aggregated all the required figures in a tabulated format to calculate the Realized cap. I have taken two UTXOs for this calculation. I have also taken the latest price of BTC and calculated the Market cap for these two UTXOs. Realized Cap= 9031.39 Now I will explain all the three on-chain metrics and calculate their value for these two UTXOs. Relative Unrealized Profit or Loss is an on-chain indicator which is a value when the unrealized profit or loss is measured relative to the market cap. RUPL= {Market Cap- Realized Cap}/ Market Cap If the Realized cap remains lower than the Market Cap, it produces a positive value. If the Market cap remains lower than the realized cap, it produces a negative value. SOPR is the ratio of the value of spent output to created output. If you send me Bitcoin then UTXO will be created and after receiving if I spent it then SOPR will compare the spent value to the created value and expressed it as a ratio. SOPR= USD value of Spent Output/USD value of Created Output In the example, I have taken two UTXOs, whose unspent value or paid price is 9031.39. If I sell it today, the SOPR will be 0.732 Market cap divided by the Realized cap is defined as the MVRV ratio. Market cap exceeds away from the Realzied cap in a Bull market, thus gives a high and strong ratio, but extreme limits tell that a correction is about to happen. MVRV is more like an oscillator as it is a ratio of market cap divided by the realized cap. The extreme readings on both sides can signal a top or bottom. SOPR is a ratio of spent value to created value, so it signals swing lows and highs. The professor in his class has already said that RUPL is a leading indicator. So the indicator will show the sign of exhaustion first before the price takes effect. It will happen a few intervals before the actual effect of price to take place. I have taken the last two cycles, one is 2013 and the other is 2017. There are three Bull cycles in the history of Bitcoin.


Market Cap= 12333.11RUPL
SOPR
MVRV

What is the difference between the three?
RUPL takes the net difference between market cap and realized cap, which produces an unrealized profit or unrealized loss, and dividing it by market cap can tell if the larger sentiment is positive or negative. The extreme readings become cycle top or bottom.(2) Consider the on-chain metrics-- Relative Unrealized Profit/Loss & SOPR, from any reliable source(Santiment, Glassnode, LookintoBitcoin, Coinmetrics, etc), and create a fundamental analysis model for any UTXO based crypto, e.g. BTC, LTC [create a model to identify the cycle top & bottom and/or local top & bottom] and determine the price trend/predict the market (or correlate the data with the price trend)w.r.t. the on-chain metrics? Examples/Analysis/Screenshot?
I will use LookintoBitcoin for the RUPL indicator.
First Bull Cycle(2011-13)
The lowest reading of RUPL was -131%, 19th Oct 2011 and from -131% RUPL rallied to 86% on 18th Nov 2013. The rise of RUPL also produced bullish BTC action during that phase. The corresponding BTC low price and high price for the RUPL readings are $2.9 to $1183.
Second Bull cycle(2015-17)
15th Aug 2015, RUPL reading was -32%, corresponding BTC low price was $227 and from that low reading RUPL started rising and reached the greed/euphoria zone 78% on 7th Dec 2017, the corresponding BTC cycle top was $19325.
Third Bull Cycle( 2020- Running)
16th Mar 2020, RUPL reading was -12%, corresponding BTC low price was $5142 and from that low reading RUPL started rising and reached the upper range of 75% on 21st Feb 2021, the corresponding BTC price was $63000 on 13th Mar 2021.
I have taken the data and calculated the difference or the lead gap between RUPL and BTC cycle top from 2013 and 2017. I found one interesting observation. In both, the cycle the RUPL extreme top happened ten days before the BTC cycle top. That is an exciting outcome of this leading indicator.

Taking into account, the historical data RUPL tells the crowd ten days before a cycle top.
But to check the RUPL extreme, the traders should use the different zone. If the RUPL has already reached the extremes (75% to 80% zone), that is the area for cycle top to happen.
The lower zone, below 0%, helps to find the cycle bottom. But a bottom can be called a bottom when the RUPL, after rising from the negative territory, does not go to the negative territory again and should keep its value above 0%.
I will use Glassnode for the SOPR indicator.
The professor says that it produces swing highs or lows.
The SOPR extreme ranges usually are 0.9 on the lower zone and 1.1 on the higher zone. When the SOPR approaches the upper zone, it brings a correction or sell-off. When SOPR approaches 0.9, it brings a short-covering rally in a bearish market.

| Date | SOPR | BTC Price |
|---|---|---|
| June 25, 2021 | 0.95 | 31670 |
| July 29, 2021 | 1.043 | 39000 |
| Mar 17, 2020 | 0.96 | 5237 |
| Dec 26, 2020 | 1.02 | 26044 |
In the third Bull cycle, many local tops and bottoms have been formed in BTC and SOPR values can be closely followed to detect it.
(3) Write down the specific use of Relative Unrealized Profit/Loss(RUPL), SOPR, and MVRV in the context of identifying top & bottom?
MVRV is an oscillator kind of indicator. If it goes above 250-300% then it becomes overpriced. And if it goes below 100%, it becomes underpriced. The overpriced reading is a sell signal and the underpriced reading is a buy signal.
RUPL is different than MVRV, as it does not oscillate so frequently. Once the bottom is formed for the next cycle, it never goes below 0%. And it is used for a much more extended period than MVRV. It is used for cycle tops and bottoms.
SOPR indicator is too noisy. Only the range should be used to identify the local tops and bottoms.
The use common to all the three indicators is to detect tops and bottoms.
The specific use is the specific time frame a particular indicator should be used.
SOPR correlates the most recent price action to be used in the short term. MVRV relatively larger time frame than SOPR, but RUPL is to be used from one cycle to the next cycle.
Thank you.