Bichi Indicative Strategy- Steemit Crypto Academy- S5W6-Homework post for @utsavsaxena11.

Give a detailed analysis of BICHI STRATEGY. Starting from introduction, identification of trends, trend reversal in market, entry and exit from the market, one demo trade and finally your opinion about this strategy. (Screenshot required). [4 points]
BICHI STRATEGY
A Bollinger Band strategy combined with an Ichimoku cloud is called a BICHI STRATEGY.
To effectively use the Bichi Strategy, it is important to have a thorough understanding of Bollinger Bands and Ichimoku and how they can be used individually as indicators.
Bollinger Band(BB)
In a BB, a trader can find three lines; one is the midline, also known as baseline, which is the 20-period simple moving average. For example, if you are using a daily chart, it is a 20 day SMA. If you are using a 1 Hr chart, it is Hourly SMA and so on.
The upper and lower lines are deviations from the baseline or 20 periods SMA. The upper line is +2 deviation while the lower line is -2 deviation.
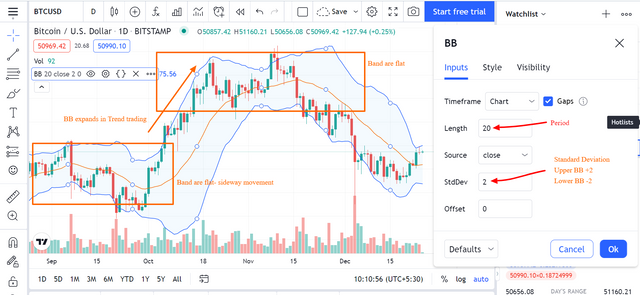
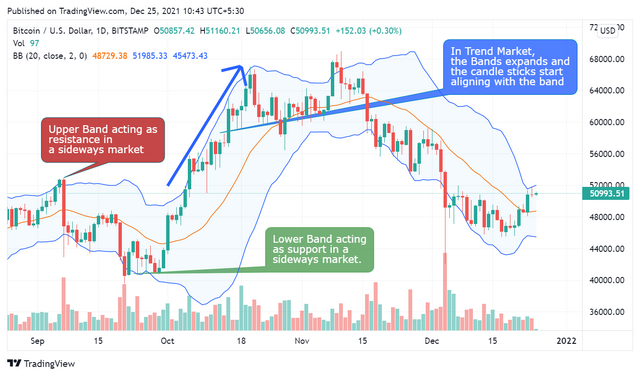
In a sideways market, the price trades between the upper and lower lines, just like a flat horizontal tunnel. In a sideways market, the upper and lower band remains almost parallel. The upper band behaves as resistance, and the lower band behaves as support. In the midline, the 20 periods SMA is also support and resistance for bull and bear market.
If the volatility goes up and the price station starts becoming more decisive and breaks out of the congestion/sideways market either to the upside or to the downside the upper and lower band start expanding in the opposite direction.
In Uptrend, the upper band goes north, and the price aligns with the upper band. In Downtrend, the lower band goes south, and the price starts getting aligned with the lower band.
In the Trend market, never take the upper band as the resistance and the lower band as the support. That is where you need the help of an additional confluence indicator and an additional filter.
Today, as the Task has asked to use Bichi Strategy, we will see how the Ichimoku can come as an additional confluence indicator with Bollinger Band to give clear entry.
Ichimoku
Ichimoku is a momentum indicator. Generally, when the price cuts the cloud to break it out and starts trading above the cloud, it is considered as a strong uptrend, and in such a case, every time the price retraces, the cloud will offer supports.
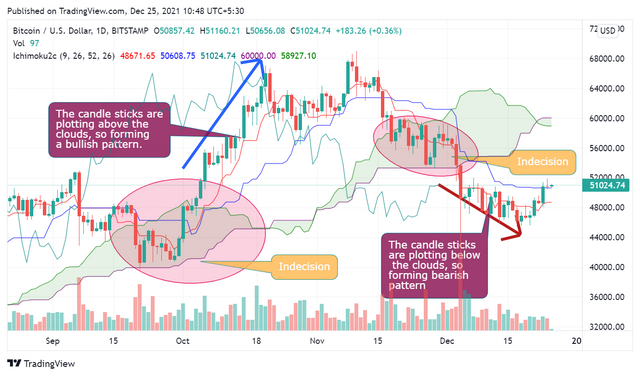
In a Downtrend, the price breaks down through the cloud and starts trading south and in that case, every time the price tries to correct up, the cloud acts as resistance.
BICHI= Bollinger Band+ICHImoku
Identification of Trends
Uptrend using Bichi
First, add Bollinger Band with 2 deviations and Ichimoku to a BTCUSD chart. I will analyze the BTCUSD pair using the BICHI strategy.
BICHI strategy works best when the predecessor state is consolidating/sideways phase.
In a consolidating/sideways phase, the Bollinger band will remain flat and the candlestick will remain inside the cloud, neither up nor down.
Always check when the indicator BB and Ichimoku play out with a similar state, creating a confluence among them.
I will show you the chart.
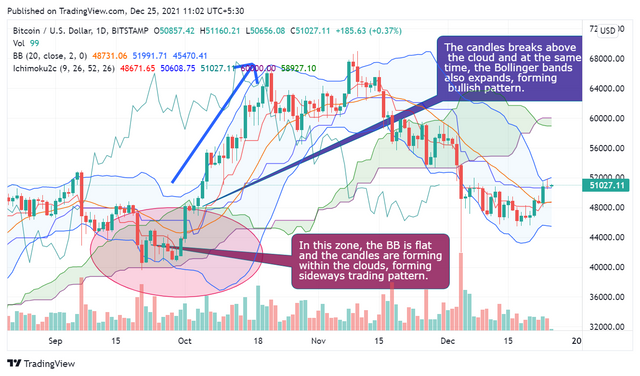
I have described this in the chart. The previous state before the BBexpands was that both Ichimoku and BB were trading in a consolidating phase, and after the candle breaks above the cloud and closes above it, the follow-through candles keep it up and the upper band of the BB also starts expanding upwards, forming a bullish pattern for volatility and momentum.
The immediate dynamic support is always the baseline, in this case, the baseline or 20 periods SMA, both are the same things. That is the dynamic support. The stop loss, in this case, should be the last swing low and the bottom of the cloud.
Downtrend using Bichi
To identify the previous sideways phase, check whether the BB is flat or not and whether the candles are confined within the cloud. If both the conditions are true, then wait for the candle to break the cloud and trade down, wait for follow through candles to go down. If you're using 5 min chart, wait for at least 3 bearish candles after the first candles break down the cloud and check the price, which should align with the lower Bollinger band.
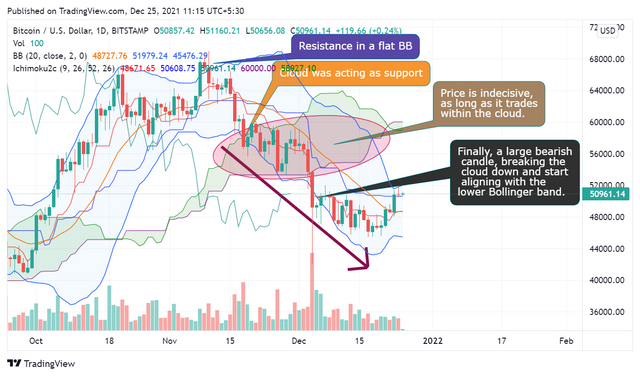
By piercing through the cloud, the candle traded clearly below it and remained aligned with the lower Bollinger band to form a bearish trade setup. The immediate dynamic resistance is 20 SMA or the baseline of the Bollinger band, the stop loss should be the upper range of the cloud and the swing high.
Trend Reversal using BICHI
In a downtrend, the price action follows lower high and lower low, but the downtrend also follows wave pattern, generally the flat trading, sideways trading is observed in the downtrend. Before the downtrend reverses into an uptrend, it consolidates and trades sideways for some time, in general.
In such a case, to identify the trend reversal, we can use BICHI.
Suppose the prevailing trend is down and for some time it is consolidating. Whether it will be a continuation of a reversal, we do not know. Apply BICHI as a confluence detector to make an entry in such circumstances.
The pre-condition for using this strategy is:-
- The prevailing trend
- The sideways/consolidating phase in the prevailing trend.
To know the prevailing trend up or down use the basic approach:-
- Higher High and Higher low for Uptrend
- Lower High, Lower Low for Downtrend
To identify the sideways and consolidating phase, check whether the BB is flat or not, if yes, then OK, if not then wait for the BB to turn flat. Additionally use Ichimoku, in sideways/consolidating market, the candles generally formed within the cloud in lower time frames, indicates consolidation or indecision. The price may trade below the Ichimoku if the prevailing trend is Down in higher time frames. But it does not go below the lower band of BB. That is another hint that it's trading sideways.
Let me show you the chart.
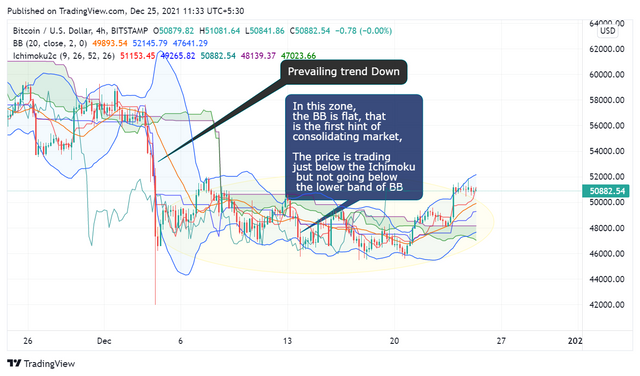
- Previous Trend or Prevailing Trend is Down
- BB is flat and the Ichimoku is also showing sideways movement.
Previously it was down, followed by a consolidating phase, the price was trading below the ICHIMOKU clouds but not going below the lower band of BB.
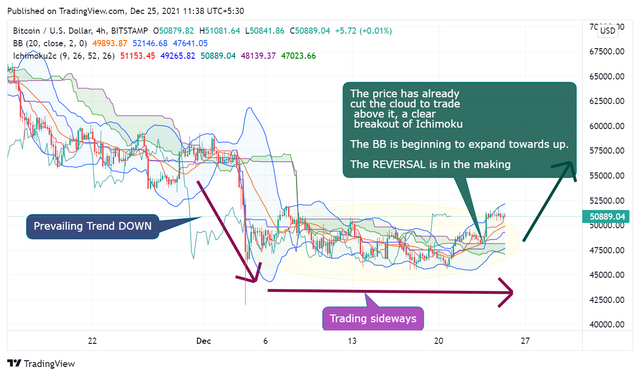
After some time, on Dec 23rd a long bull candle cut through the clouds and closed above the cloud. The Bollinger Bands also begins to expand upward, so it is a clear case of REVERSAL in the making.
Entry, Exit using BICHI strategy
I will use the BICHI strategy in BTCUSD.
Before making an entry with better clarity, follow the candle closing pattern. If the candle has pierced through the cloud and closes above it, then it works well. If the price after breaking it out gets support on the upper cloud, then it is a green signal, not a false break out.
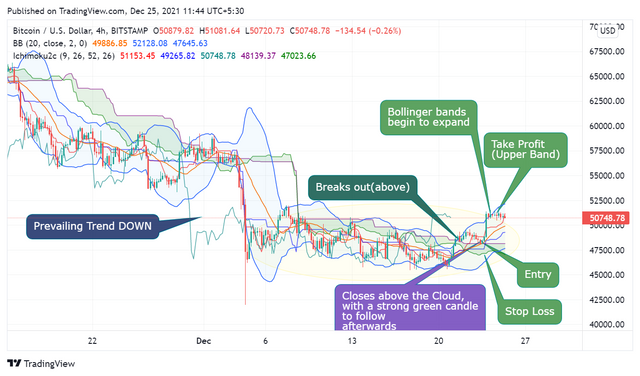
I have indicated my entry in the chart, the first immediate exit and the stop loss.
Remember the previous trend was down, then it followed a consolidating phase. We discussed it already. Now the price breaks above the cloud and the candle also closes above the cloud. At the same time, the BB also begins to expand.
The first entry should be the point when the first candle closes above the cloud, I have indicated that in the chart, the first Take Profit should be when it hits the upper band of the BB. The stop loss should be the lower part of the cloud. You can also take swing low, anticipating this move to have better momentum and volatility. It is better if you book 1/3rd profit when it hits the upper band of BB, the remaining wait for the clues from the confluence detector and the next consolidation phase.
The immediate dynamic support in this reversal will be the Bollinger band's baseline, which is the 20 period SMA.
Demo Trade
I will use the 30-minute chart in XRPUSD, I am not trading with BTCUSD at the moment, because I did not find any clear signal using BICHI.
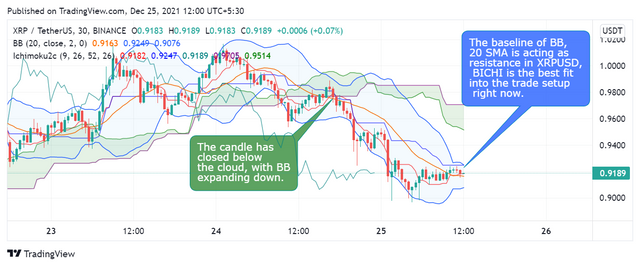
As of right now, the XRP/USD pair is offering BICHI.
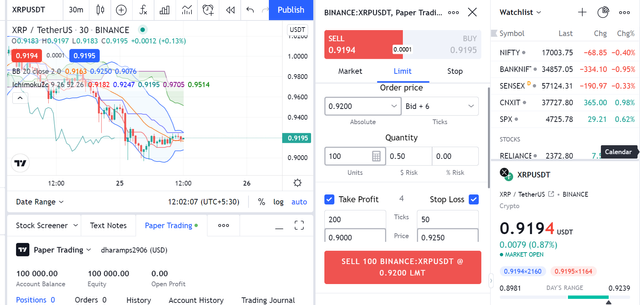
I have placed a limit order at 0.9200 with 0.9250(baseline of BB) as stop loss and take profit as 0.9000(Daily low). Using BICHI if it succeeds, it is 1:4 risk: reward ratio.
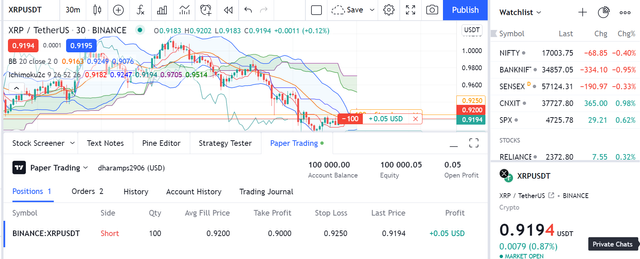
As I can see now, the limit order has been triggered. Now the trade is also in profit. My analysis and BICHI set-up are currently working; every time the price reaches the BB baseline, it's getting rejected, so I am already making a profit now (floating profit of +0.05 USD).
My take on BICHI strategy
Combining volatility and momentum in a single trade setup undoubtedly makes it a valuable and powerful indicator, it makes a confluence detector for better and valid entry.
Additionally, I will suggest using 50 EMA short term and 200 EMA long term for this set-up to understand the overall trend better. For the short term using the 5-minute chart, I will suggest waiting for three green candles to take entry. The cloud upper and lower part also acts as support and resistance respectively for the bull and bear market. The dynamic support is 20 SMA which is the baseline of BB. In summary, it's quite useful, simple to understand.
Define briefly Crypto IDX and Altcoins IDX. What is signal prediction trading? Is it legal or ill-legal in your country? (Explain briefly) [2points]
Crypto IDX and ALtcoin IDX both are available in Binomo. In essence, they are indexes depicting the state of the major cryptos and altcoins, as their names imply, as I explain in this section.
Before that let me tell you that Binomo is accessible from my country. I can log in using my Gmail account. SO I think it's legal in my country.
Crypto IDX
It is an index that measures the relative value of 4 currencies together. The four different currencies used for this index are Bitcoin, Ethereum, Litecoin and Zcash. As it is an index there is no separate coin. It can only be traded(Buy and Sell). It can not be moved, similar to the synthetic trade in Futures trading. It is a derivative coin.
A crypto IDX is similar to NIFTY, NASDAQ, FTSE, etc., which are stock market indexes. It takes the average prices of the four crypto coins Bitcoin, Ethereum, Litecoin and Zcash and the noise of speculation is smoothened out to measure the value of crypto IDX.
Altcoin IDX
Altcoin IDX is also calculated and measured similar to crypto IDX, with the only difference being four different coins: Ripple, Ethereum, Litecoin and Monero.
These two indexes can be traded and can also be used to state the overall trend of the associated coins of that index. Therefore, if a trader is trading a particular coin, he can take the signals from the associated index as an additional signal for trade entry.
If you want to create your own penny IDX, then which 4 penny assets will you choose and what is the reason behind choosing those four assets. Define Penny currencies. (Explain, no screenshot required).
Any coin with a value less than a dollar value can be called penny currency.
As the professor has asked to create a Penny IDX, I have to choose 4 penny coins from Coinmarketcap.
The coins I choose for penny IDX will be:-
(1) Siacoin (SC)
(2) Tron(TRX)
(3) Zilliqa(ZIL)
(4) IOST(IOST)
All the four penny currencies are best in their own rights.
Siacoin(SC) made its debut the decentralized storage layer of the internet with cloud storage facility, smart-contract and trustless marketplace.
TRX is the native coin of Tron Blockchain. It is a cost-effective and high throughput alternative for Etherum. It is suitable for microfinance. The fee is considerably low. The fee charged is resource-based.
Zilliqa(ZIL) tremendously improves scalability by employing a shared network. For large scale business enterprises, a scalable platform is the main requirement. ZIL offered this at a time when the crypto market was plagued with scalability issues.
IOST(IOST) started its project with an aim to bridge the gap between the traditional market and the crypto market. So it is both customer-friendly and business-friendly with unique consensus algorithm proof of believability.
I have given a brief summary of these coins with their rank, supply, and price, etc.
| Coin | Current Price | Total Supply | Market cap | Rank |
|---|---|---|---|---|
| SC | 0.0166 | 49.68 Billion | 827 Million USD | 111 |
| TRX | 0.081 | 101.86 Billion | 8.251 Billion USD | 26 |
| ZIL | 0.072 | 12.18 Billion | 887 Million USD | 104 |
| IOST | 0.035 | 18.10 Billion | 633 Million USD | 125 |
Conclusion
no indicator in the world is 100% accurate and can only bring profit for you. Different indicators, therefore, needed additional indicators for forming confluence and one such confluence detector is the BICHI strategy. With the BICHI strategy, a trader can improve the probability of winning trades.
As the professional always says, always use STOP LOSS and TAKE PROFIT to manage the risk and rewards. Always keep the basic parameter to identify a trend, then use BICHI to make a valid entry.
Thank You
Cc-
@utsavsaxena11
Thanks for sharing Bollinger band w/ichimoku cloud significant for upward and downward movement of crypto currency/ share movements well:))) I hope you were become an expert in this field of crypto
@dharamps
Thank you
You prepared very well in in your homework task
Thank you