Technical Indicators - Steemit Crypto Academy |Season 4| Week 2| - Homework Post for @reminiscence01 by @dhanux94
Hello Steemians,
a). In your own words, explain Technical indicators and why it is a good technical analysis tool.
Industrial trade is a discipline that includes many unusual phrases and somewhat advanced concepts. In order to trade in crypto currency with profit without loss, one must have a good understanding of circulation. When traders evaluate assets such as crypto currency, they are mostly done through two methods, basic analysis and technical analysis. When talking about technical analysis, it is impossible not to talk about technical indicators. Which means,
It is difficult to trade without a very good understanding of technical indicators, a technical tool.
Technical indicators are basically data analysis calculations based on the price, volume or open interest of the assets. In short, trade analysis is a chart tool. These are mathematical formulas that are plotted on graphs based on price and volume data. It is through the use of indicators that we are able to know our future price movements on assets and the status of assets.
Although there are many types of indicators, the trader is motivated to use indicators that are important for a market with market-oriented trends and ranges because the indicators are useful for the trader to get feedback on supply and demand. There are different types of indicators for investors. These help investors to determine the market and get the right result. Technical analysis is solely concerned with evaluating statistical trends collected from trade data such as price and volume. Technical indicators are especially good for technical analysis tools, as they have the power to test crypto assets and predict market prices, generate confirmation signals to enter or exit a market, and educate traders in market analysis.

b). Are technical indicators good for cryptocurrency analysis? Explain your answer.
Yes, of course technical indicators are good for cryptocurrency analysis as I understand it. Because of a statistical tool, we can see the movements of cryptocurrencies through certain indicators and get an idea of how the market is moving. In cryptocurrency analysis it is important to use those indicators that we feel are most comfortable and secure. Indicators support and resist different prices to help us make better decisions in the financial markets. The mistakes we make when investing in the market are minimal. This historical data is very valuable for traders to identify long-term placements and trade replacements.

c). Illustrate how to add indicators on the chart and also how to configure them. (Screenshot needed).
We must first log into tradingview.com. Then select Chart.
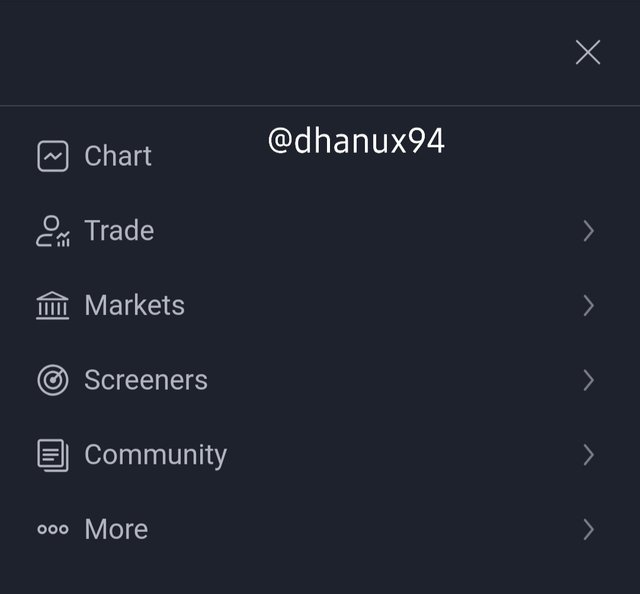
Screenshot taken from Tradingview
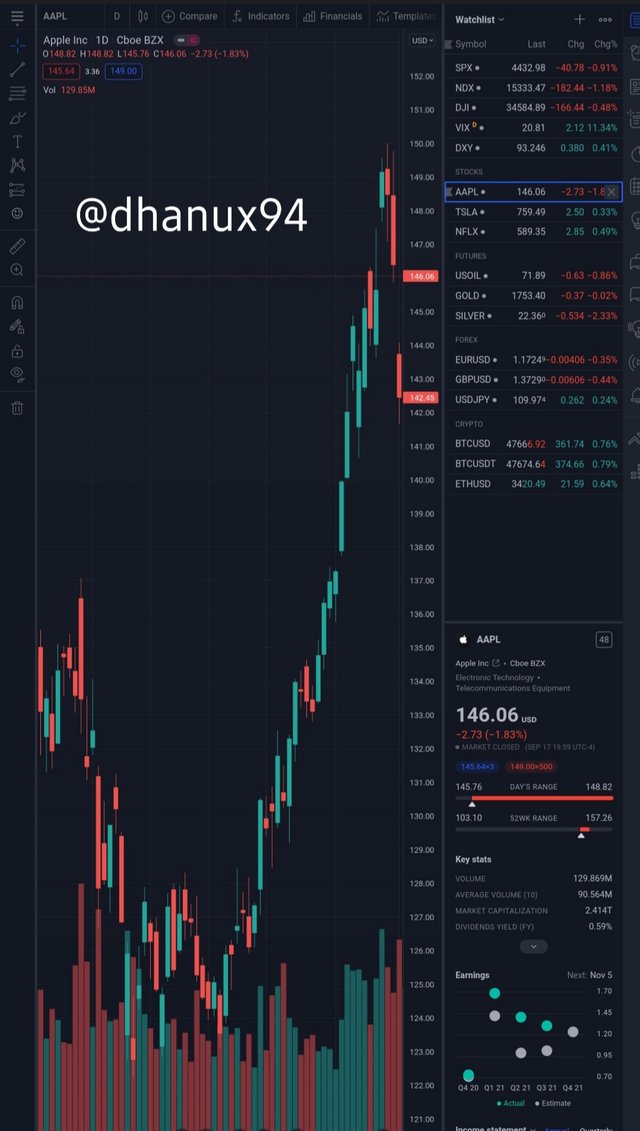
Screenshot taken from Tradingview
Then select the indicators and strategies.
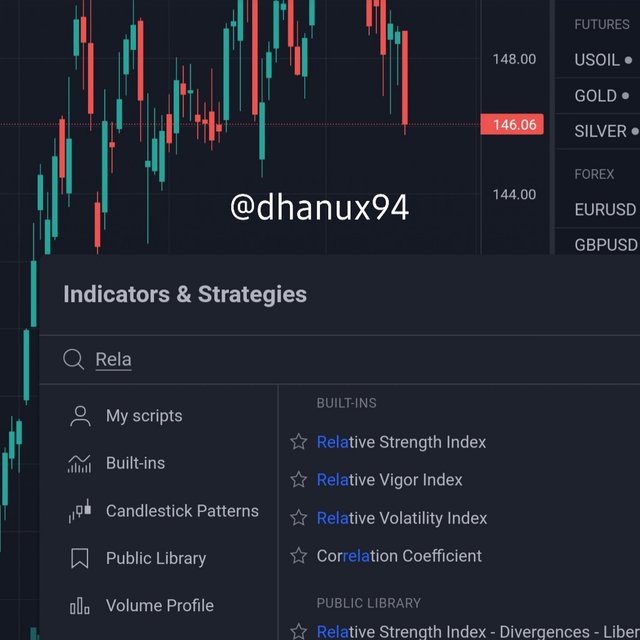
Screenshot taken from Tradingview
Then select the indicator type.
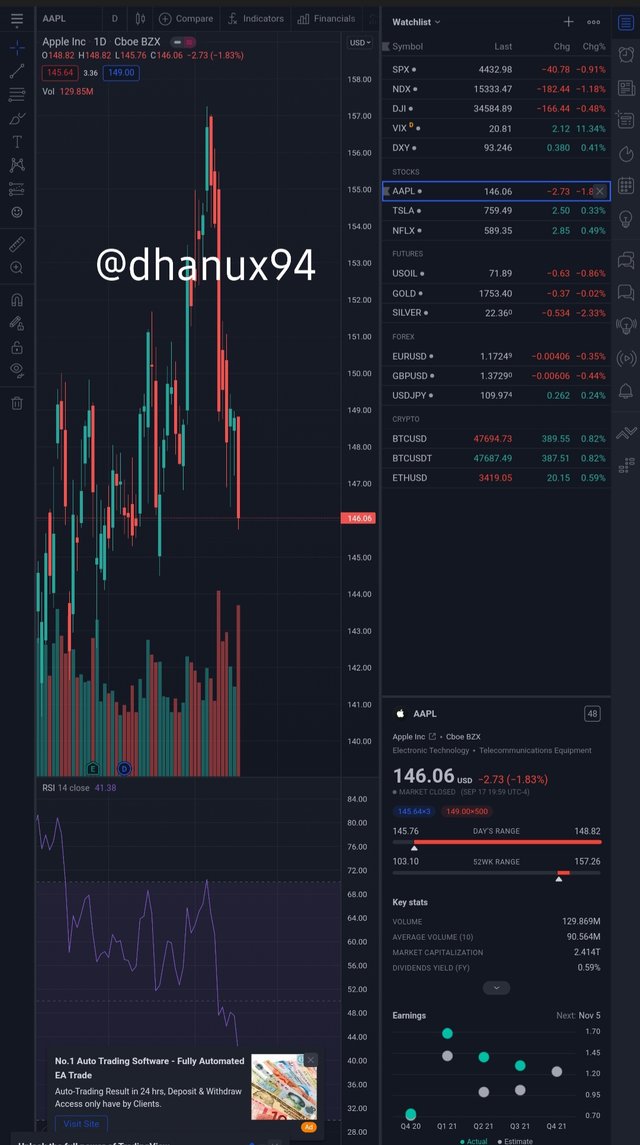
Screenshot taken from Tradingview
Now after clicking on the indicator a tool box is displayed on the screen.
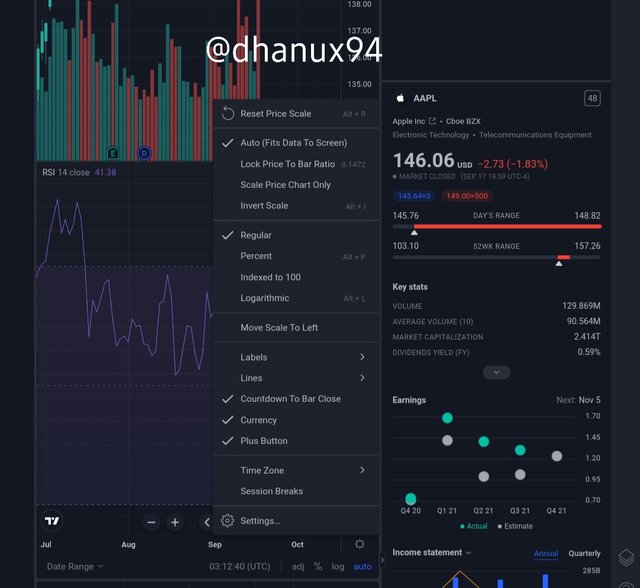
Here you can change the tools as required by touching the settings. You can use label, lines, plus button, currency, regular, session break etc.
Also click on setting where the RSI Indicator is displayed.
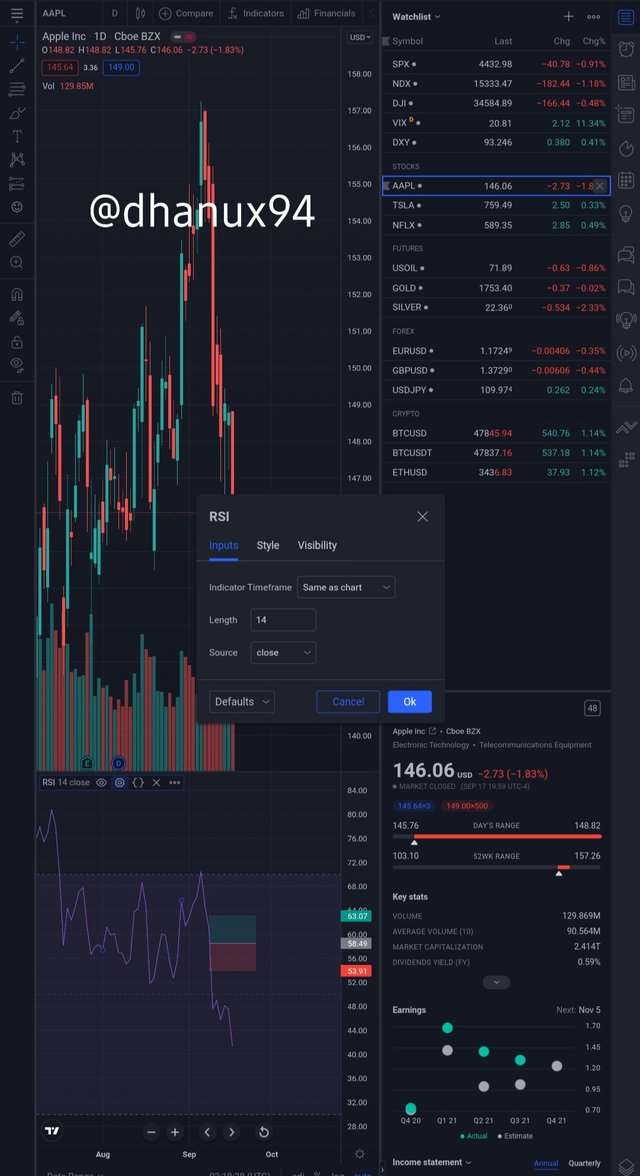
Screenshot taken from Tradingview
We can change the color of the lines by setting as we like. This makes it easier to clearly distinguish and keep working.
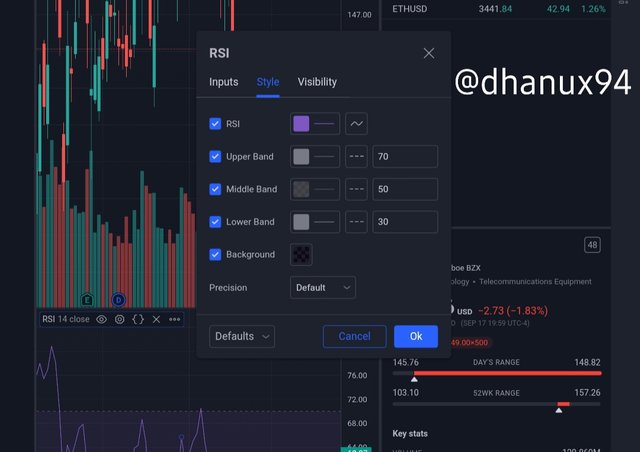
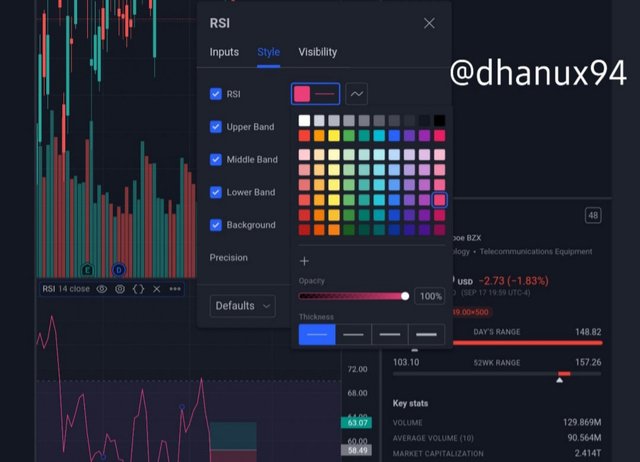
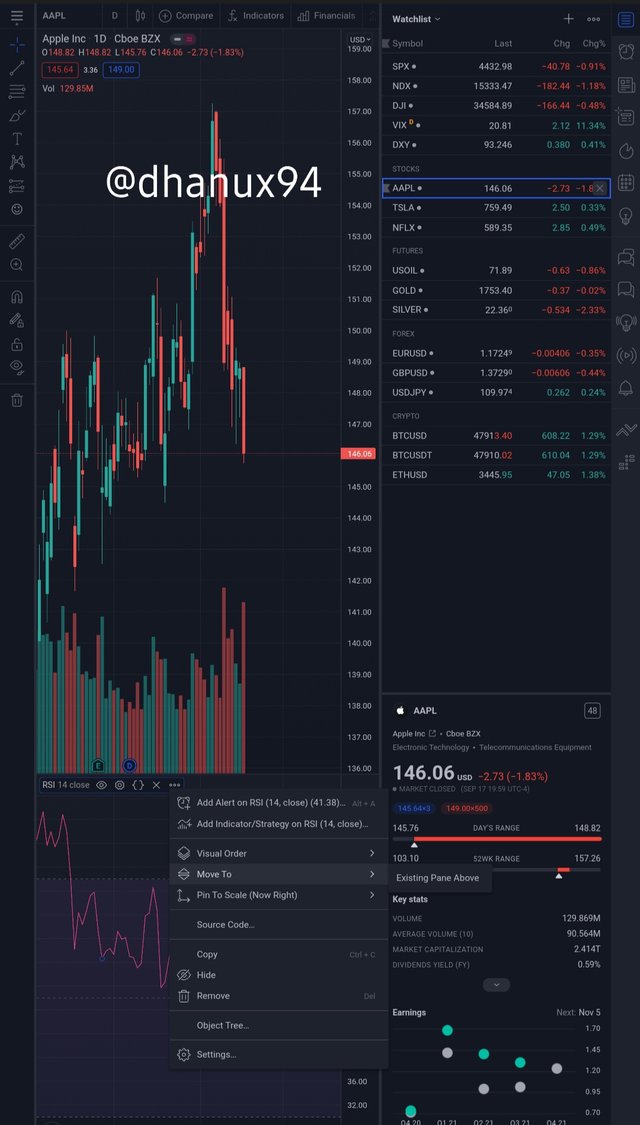
Screenshot taken from Tradingview
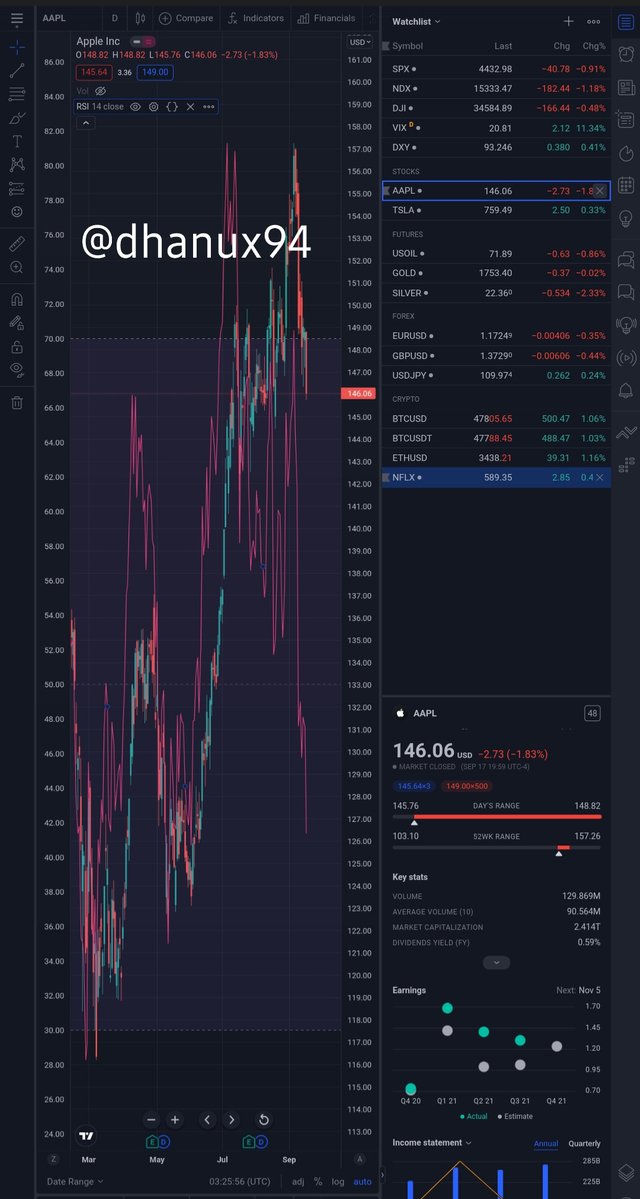
Screenshot taken from Tradingview

a).Explain the different categories of Technical indicators and give an example of each category. Also, show the indicators used as an example on your chart. (Screenshot needed).
There are different categories of indicators and they are,
• Trend Based Indicators
• Volatility Based Indicators
• Momentum-Based Indicators
Trend Based Indicators
This index is used to determine whether certain cryptocurrencies or digital asset charts are available or whether there are certain price range ranges in the market. With the help of a trend-based index, traders can identify the overall movement of the market over a specific period of time. Therefore, this indicator helps to identify the strengths and weaknesses of a trend and make good decisions about trade.
Example is Average Directional Index (ADX)
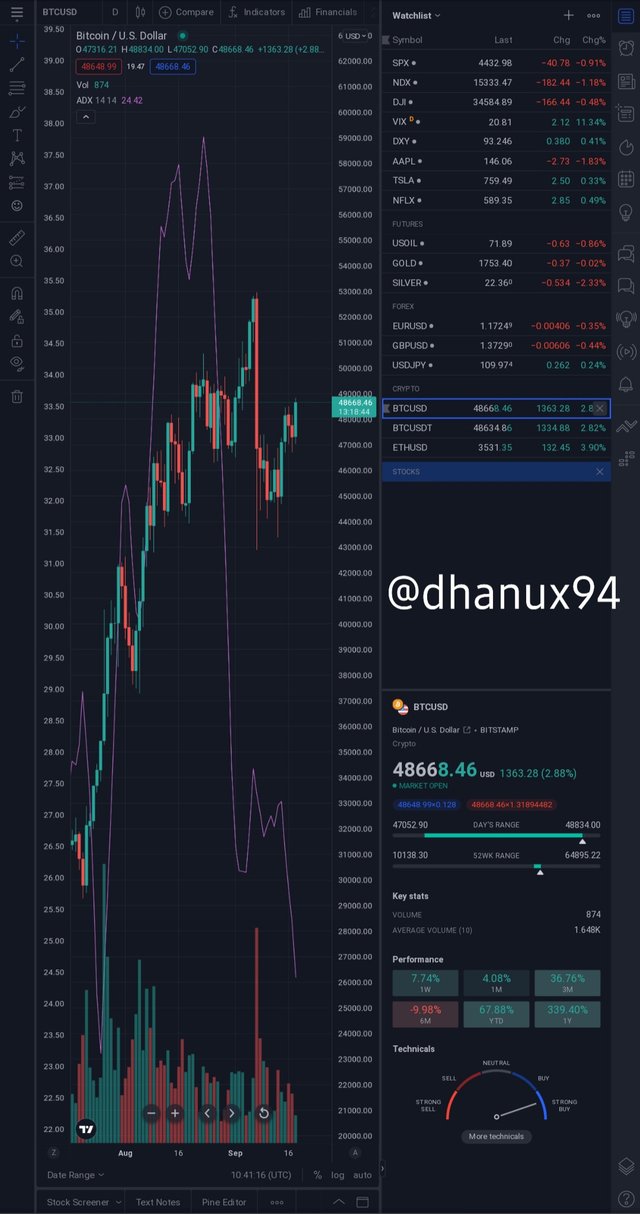
Volatility Based Indicators
The momentum index helps cryptocurrency traders measure the strength of a price movement by comparing prices that close over time. This is represented by a single line in the graph. The most valuable benefit here is the ability to identify when propensity increases or decreases. It is possible to determine how fast the price is moving. This index manages to quantify size and magnitude with rising and falling prices. It is therefore possible to understand the strength of the market.
Examples of such indicators are Average True Range (ATR), Bollinger Bands.
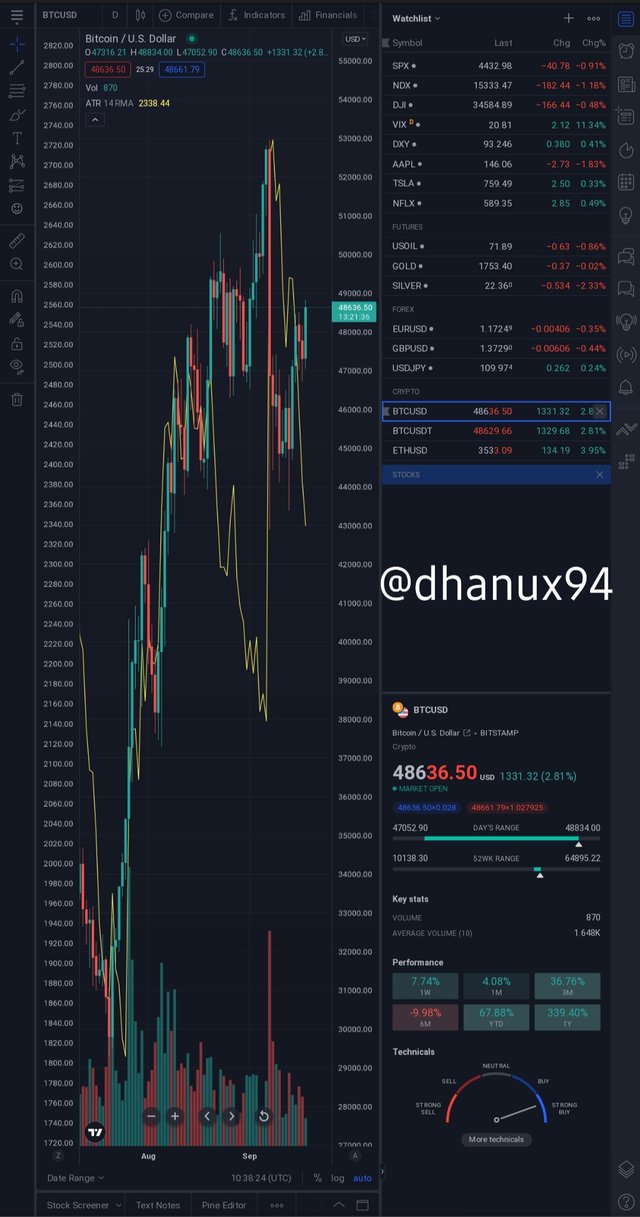
Momentum-Based Indicators
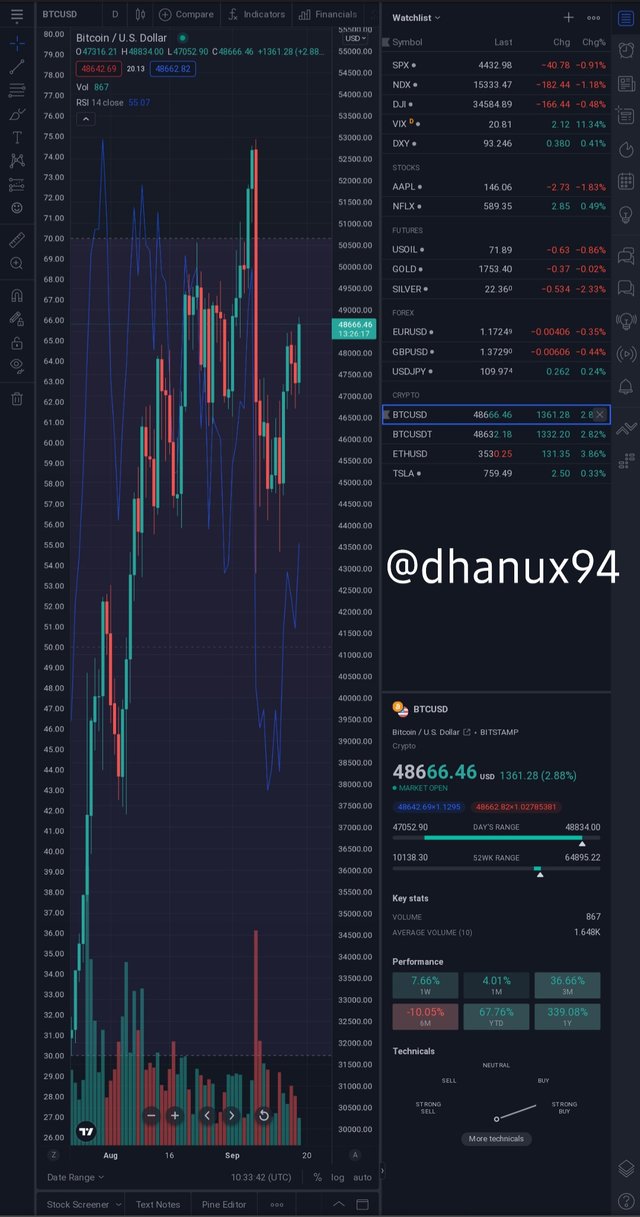
Fluctuation in the price of an asset over a period of time. An indicator based on instability. The change in this fluctuation in assets represents the selling and buying in the market. Statistically analyzing these fluctuations allows traders to interpret the location and direction of prices in the future. This index helps traders to buy lower and sell higher.
Examples are Moving Average Convergence Divergence (MACD), Relative Strength Index (RSI)

b). Briefly explain the reason why indicators are not advisable to be used as a standalone tool for technical analysis.
Indicators should be used in conjunction with technical tools such as price patterns, trend lines, support and resistance levels and should not be used alone. Because using this alone is risky. Traders can get into trouble. Indicators are also designed to allow traders to draw conclusions from the technical analysis of any digital asset in the market. The verification tool, which is one of the main functions of the indicators, can detect false signals and prevent them. Therefore, it is not advisable to use these as an independent tool.

c). Explain how an investor can increase the success rate of a technical indicator signal.
An individual cannot be successful just by being an investor. Must have an understanding of supply and demand for an asset. Both sellers and buyers need to have a good understanding of how assets are handled. Also special is the constant observation, long experience of working, handling technical tools and the understanding gained about it. When perfected through things like this, the investor will be able to choose favorable technical tools and be able to work effectively and efficiently. Then the support and resistance areas provided by the indicators can be identified and the gain and loss areas can be identified and a good entry can be obtained. Therefore, it is necessary to learn the basics, build a proper foundation, grasp the complex analytical indicators once the foundation is established, select the right opportunity and trade.
Thank you so much for reading my post.
Cc: @reminiscence01