Japanese Candlestick Chart - Steemit Crypto Academy Season 4 - Homework Post task 10
INTRODUCTION
Am really happy and grateful to participate in this tasks 10, Japanese candlestick is one of the most important tool when it comes to technically analysis of the assets price movement in the market.
I will be completing this tasks by answering questions. A very big thank you to prof @remiscence01 for the interesting and wonderful lecture.

Questions
Explain the Japanese candlestick chart? (Original screenshot required). In your own words, explain why the Japanese Candlestick chart is the most used in the financial market. Describe a bullish and a bearish candle. Also, explain its anatomy. (Original screenshot required)
Explain the Japanese candlestick chart? (Original screenshot required).
The Japanese candlestick chart is a chart that is being made up of 2 candlesticks which are the bullish and bearish candlestick and the have different colors bullish candle(green color) and bearish candle( red color) which makes it easy to be identify, it is a chart that is being combined with other technical tools in order for a trader to successfully analyse the market price of assets.
Using cryptocurrency pair of btcusdt
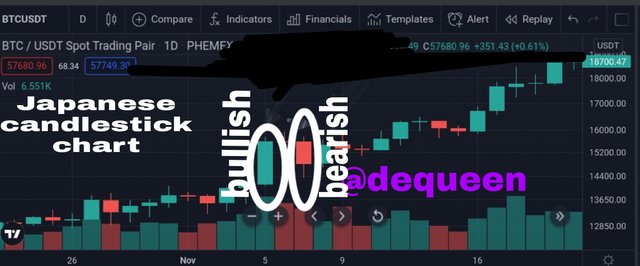
Source
It is a tool that is very important and was developed by a rice trader who was from Japan by the name Munehisa Homma. With this wonderful development, he was able to help traders perform a lots of things from the onset till today we are still making use of the Japanese candlestick chart. We make use of this to know the trends in which the market is if it is uptrend(bullish trend) or downtrend(bearish trend).
One wonderful thing about this chart, is that it is very simple and easy for newbies to be able to understand. The 2 candlestick have their own personal functions though the both have similarities such has helping traders to know how to know trend and price movement, the both of the have 4 parts which are the high, low, open and close and I will be explaining as I proceed.
The bullish candle is one of the best candle that a trader always want and wish because once seen the trader can enter the market and make profit.
Unlike the bullish candle the bearish is inverse of bullish, once seen the trader leave the market to avoid losses.
With this 2 candles, a trader will know when to enter and exist the market and which will help him when he wan to make decision in the market.
In your own words, explain why the Japanese Candlestick chart is the most used in the financial market.
Let me start by saying, when it comes to todays world people do not really want what will stress them but will rather will prefer the easy and simple to understand which is one of the reason people use the Japanese candlestick, it also plays a great role by helping the traders to be able to also analyse the market easily .
It help the trader to know the best decision the are to make when being combined with another technical tool and by this the trader will know if to enter or to exist the market in a particular moment.
It also helps the trader with it four dimensions to know the maximum price of assets in the market, the minimum price of assets, the opening price and the closing price of assets in a particular moment or particular time.
Another important thing is that, with the Japanese candlestick a trader will know the trend in which the market is if it is in bullish trend or in bearish trend.
Lastly, when it comes to predicting the future price of assets it helps because a trader can study it very well and predict the price or candle neks move.
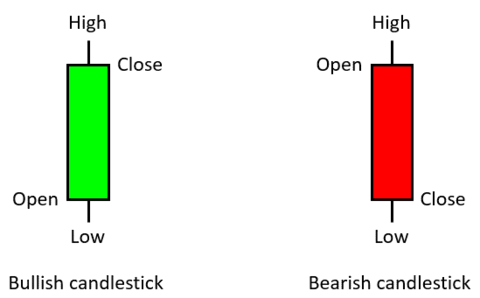
Describe a bullish and a bearish candle. Also, explain its anatomy. (Original screenshot required)
Description of bullish and bearish candle is very important thing to note, but first the trader should also know that even though the have their disadvantage, they also have great impact when it comes to trading because without them a trader may possibly be making more lost than profit but when you look at this two candles, (bullish and bearish) as a trader you will certainly know what the markets is up to, if it is on bullish trend or bearish trend which may automatically trigger you to enter the market or make you feel less concern(exist).
.png)
Source
with this two candles you can predict the market next movement with it simplicity and easy to understand. An old trader can always sit a newbie and educate him about all what cryptocurrency trading is all about making good used of the two japanese candlestick in the Japanese candlestick chart which are bullish ans bearish candle and I will be explained the anatomy as l proceed.
Bullish candle
The bullish is one of the candlestick in theJapanese candlestick chart.it is very important candle which means the bullish trends and that there is an increase in assets price which is always a positive signals to trade to capitalize on if on maximize the capital.
It is good candle when it comes to decision making.
Source
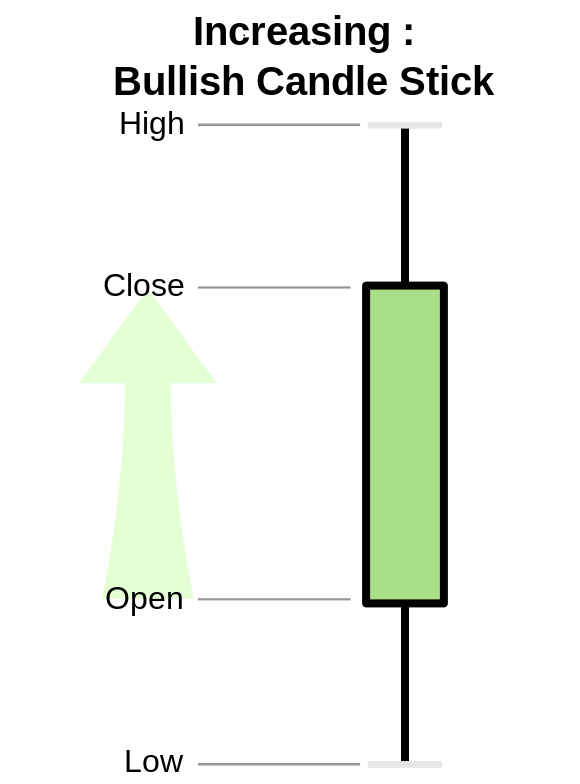
ANATOMY OF BULLISH
The bullish candle has 4 part which are the high, the close, the open and the low.
Source
The High
When we talk about the high in the bullish, this has to do with maximum price and assets has been able to reach at a particular moment in the chart in the bullish candle. It is very important for traders to take note when looking out for the bullish candle and bullish trend.
The low
Low is the inverse of high, it is the minimum price of an asset in the market at a particular moment in the bullish candle.
The Open
The open is the price the market start with(the starting price or opening price of assets) in a particular day.
The Close
Just as the market has opening price, the close is also about the price the market close with in the bullish candle which is the inverse of opening price. Very important to traders.
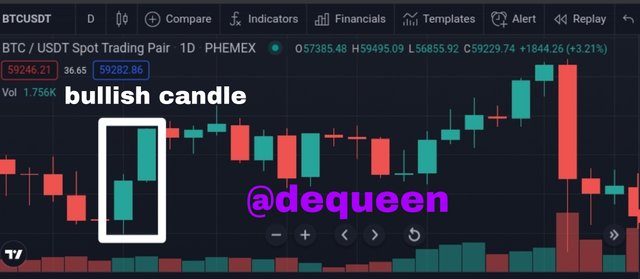
I will be using a chart of 2 crptocurrency pair(btcusdt) to show the bullish trend in the market.
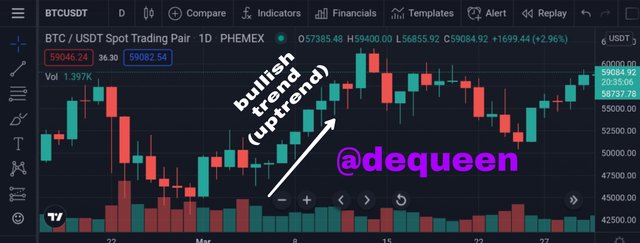
Source
Bearish candle
The bearish is one of the candlestick in the Japanese candlestick chart.it is very important candle which means the bearish trends and that there assets price is decreasing which is always a negative signals to trader to take note of it and exists the market immediately.
It is good candle when it comes to decision making.
Source
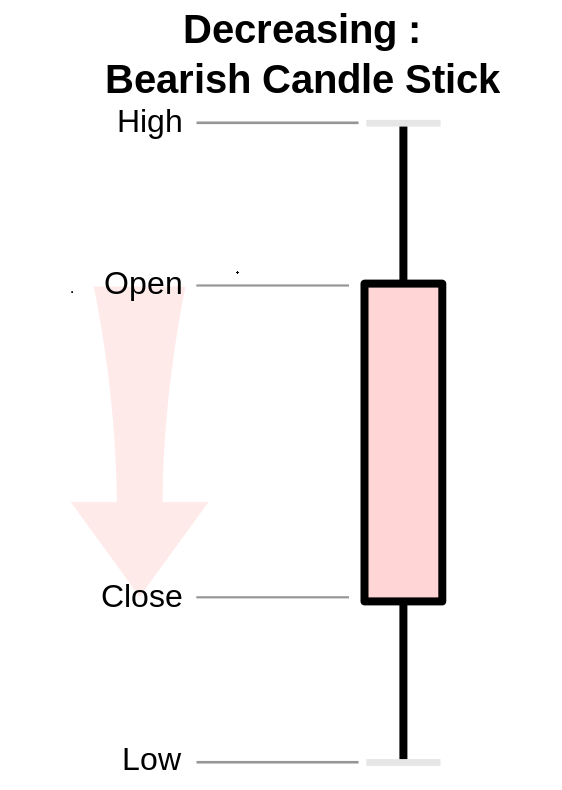
ANATOMY OF BEARISH CANDLE
The bearish candle has the same similarities has the bullish candle here, it also has 4 part which are the high, the close, the open and the low.
Source
The High
When we talk about the high, this has to do with maximum price an asset in the bearish candle has been able to reach at a particular moment in the chart. It is very important for traders to take note.
The low
Low is the inverse of high, it is the minimum price of an asset in the market that is on bearish at a particular moment.
The Open
The open is the price the market begins with(the starting price or opening price of assets) in a particular day.
The Close
Just as the market has opening price, the close is also about the price the market stop with which is the inverse of opening price. Very important to traders.
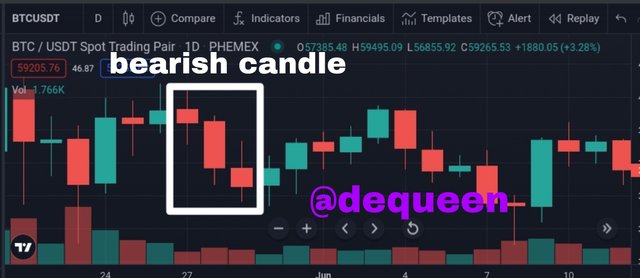
I will be using a chart of 2 crptocurrency pair(btcusdt) to show the bearish trend in the market.
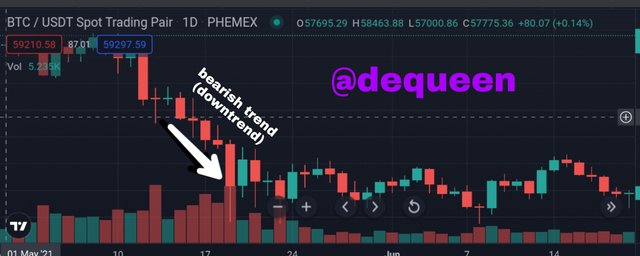
Source
CONCLUSION
With the simplicity of the Japanese candlestick chart and how it is easy to understand, I will always recommend it to all trader because it is one of the reasons that makes the market looks easy.
The Japanese candles(bullish and bearish candle)is very important with the 4 part in which I will always advice traders to always keep sight on them.
With due respect am grateful for this wonderful lecture from the wonderful prof @reminiscence01, thanks to @dilchamo and @nane15