Steemit Crypto Academy Temporada 2-Semana6 @kouba01 | Comercio de criptomonedas con indicador MACD // pot @decuartae //

Saludos Profesor @kouba01 esta semana su clase estuvo fantástica, aprender sobre el tema de los indicadores y osciladores fue muy bueno, aquí presento las repuestas a sus interrogantes:
Greetings Professor @ kouba01 this week your class was fantastic, learning about the subject of indicators and oscillators was very good, here I present the answers to your questions:
**

MACD que es lo mismo ha Media Móvil de Convergencia y Divergencia. Es un indicador técnico que además de seguir las tendencias y sus cambios también nos permite saber si el precio de un activo se encuentra sobre comprado o por el contrario esta sobre vendido.
El Indicador MACD consta de Tres Componentes
La Línea MACD que se obtiene al restar una media móvil de 26 períodos con una medida móvil de 12.
La Línea Señal que es la media móvil de 9 períodos de la MACD y por Último el Histograma que es una representación gráfica de la distancia existente entre las dos líneas
Este indicador creado a finales de los años 70 por Gerald Appel, siendo una media móvil, utiliza varias medias móviles, y establece como estándar tres medidas exponenciales 12 - 26 y 9 períodos, pero como todos los indicadores, estos valores se pueden adaptar a las necesidades de cada trader, e incluso al mercado que se esta operando, es el indicador más usados por los Traders.
MACD, which is the same, has Moving Average of Convergence and Divergence. It is a technical indicator that, in addition to following trends and their changes, also allows us to know if the price of an asset is overbought or, on the contrary, is over-sold.
The MACD Indicator consists of Three Components
The MACD Line that is obtained by subtracting a 26-period moving average with a moving measure of 12.
The Signal Line which is the moving average of 9 periods of the MACD and finally the Histogram which is a graphic representation of the distance between the two lines
This indicator created at the end of the 70s by Gerald Appel, being a moving average, uses several moving averages, and establishes as standard three exponential measures 12 - 26 and 9 periods, but like all indicators, these values can be adapted to the Needs of each trader, and even the market that is being operated, is the indicator most used by Traders.
Definitivamente siii es un indicador que nos permite analizar la fortaleza del mercado. El MACD nos indica si un movimiento es alcista y se esta fortaleciendo o bajista y se esta debilitando, además nos permite identificar cambios en el impulso de la acción del precio de una criptomoneda.
Son muy variadas sus aplicaciones por eso el indicador MACD es una herramienta útil y de gran importancia para el mundo cripto
Definitely siii is an indicator that allows us to analyze the strength of the market. The MACD tells us if a movement is bullish and strengthening or bearish and weakening, it also allows us to identify changes in the momentum of the price action of a cryptocurrency.
Its applications are very varied, that is why the MACD indicator is a useful and very important tool for the crypto world.
**
3_. What is better MACD or RSI?

Sin duda los dos indicadores son muy usados, pero existen varias diferencia entre ellos
El RSI como lo vimos en la tarea pasada es un indicador muy útil pero tiene mucha diferencia con el MACD ya que el MACD se establece con las medias móviles y el RSI como ya vimos calcula la velocidad y las ganancias y/o pérdidas del precio promedio
Dicho esto los dos indicadores tienen su ventajas y desventajas y aunque el RSI es el más recomendado, por muchos, no cabe duda que es el MACD el más usado y favorito de los Traders.
Y hay que tener claro que los indicadores técnicos si bien nos permiten tener un sistema preciso y de posibles ganancias, también es obvio que no existe un indicador que sea 100% acertado, todos tienen sus funciones y dan buenas señales pero también dependerá de su buen uso y aplicación. No me atrevería a asegurar cual de los dos es mejor, creo que al usarlos juntos conjugando las funciones de ambas sería una excelente estrategia y tendríamos lo mejor de ambas.
Undoubtedly the two indicators are widely used, but there are several differences between them
The RSI as we saw in the last task is a very useful indicator but it has a lot of difference with the MACD since the MACD is established with the moving averages and the RSI as we have already seen calculates the speed and the gains and / or losses of the average price.
That said, the two indicators have their advantages and disadvantages and although the RSI is the most recommended, by many, there is no doubt that the MACD is the most used and favorite of the Traders.
And it must be clear that technical indicators, although they allow us to have a precise system and possible gains, it is also obvious that there is no indicator that is 100% correct, they all have their functions and give good signals but it will also depend on their good performance. use and application. I would not dare to say which of the two is better, I think that using them together combining the functions of both would be an excellent strategy and we would have the best of both.
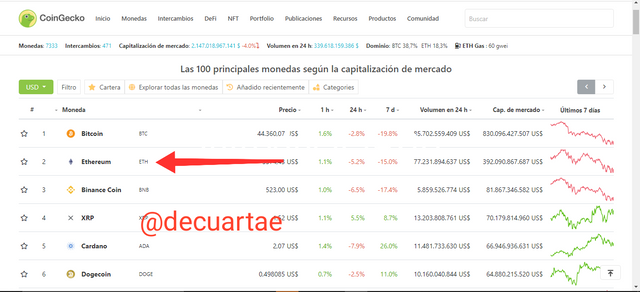
Para agregar el indicador MACD debemos entrar a cualquier páginas de análisis del mercado criptográfico, en este caso lo haré desde Coin Gecko
Enlace
Estando allí seleccionamos la Moneda a la cual le vamos a aplicar el MACD
**
To add the MACD indicator we must enter any crypto market analysis pages, in this case I will do it from Coin Gecko
[Link] (http://www.coingecko.com)
While there we select the Currency to which we are going to apply the MACD
Buscamos la pestaña que dice TradingView
We look for the tab that says TradingView
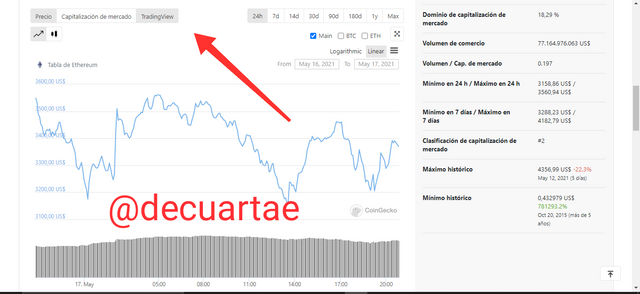
Nos dará la pantalla con una gráfica, buscaremos el botón Indicador
It will give us the screen with a graph, we will look for the Indicator button
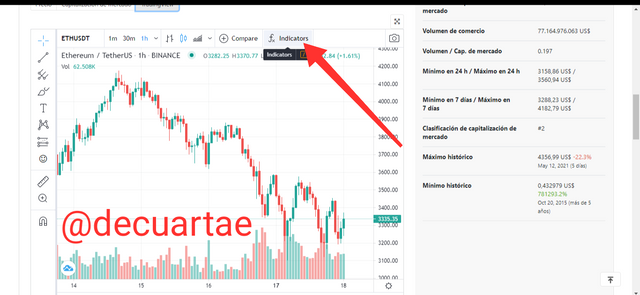
Allí en la franja del Buscador, colocamos el nombre de nuestro indicador en este caso será MACD
There in the Finder strip, we put the name of our indicator in this case it will be MACD
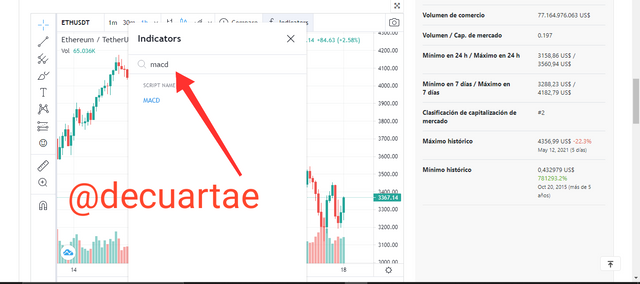
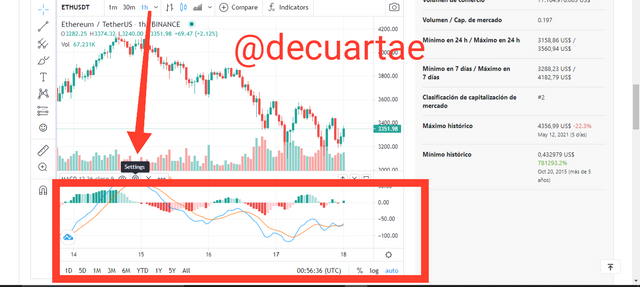
Al presionar allí, nos aparece una gráfica donde nos aparece el indicador MACD fuera de la gráfica en la parte inferior, inmediatamente presionamos el botón de la configuración
When pressing there, a graph appears where the MACD indicator appears outside the graph at the bottom, immediately we press the configuration button
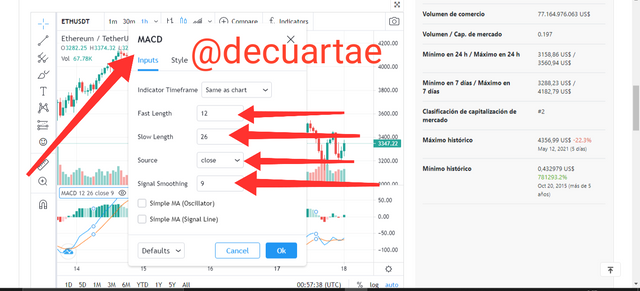
De allí mismo nos desplegará una pantalla, donde estará el botón Inputs donde nos abrirá los parámetros a establecer para la configuración de nuestro MACD
En ella aparecen configurados los parámetros estándar del MACD ya establecidos y en este caso lo vamos a dejar igual
From there it will display a screen, where the Inputs button will be where it will open the parameters to be established for the configuration of our MACD
In it, the standard parameters of the MACD already established are configured and in this case we will leave it the same
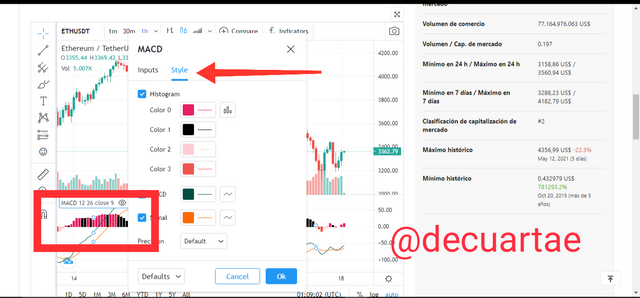
Si le damos al botón Style, vamos a poder personalizar nuestros gráfico a nuestro gusto, le realice unos cambios de color para que notarán la diferencia
If we click the Style button, we will be able to customize our graphics to our liking, make some color changes so that you will notice the difference
Como nos pudimos dar cuenta la configuración es muy sencilla, y con ella pudiéramos lograr beneficios en cuanto a las
As we could see, the configuration is very simple, and with it we could achieve benefits in terms of
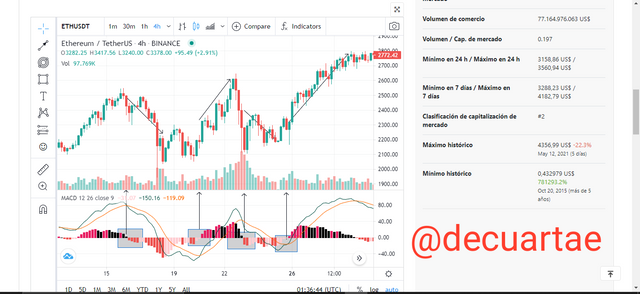
Luego de la Configuración del MACD se puede ver como se logra el cruce entre ma línea MACD y la línea de señal, como se muestra en este gráfico sucedió en varias oportunidades. Y observamos de igual manera el momento en él que se realiza el cruce de la línea cero en un primer momento anunció una baja, luego vino la subida y seguidamente manifestó una baja y por último un movimiento alcista significativo.
**
5_. How to use MACD to cross the MACD line and the signal line? And how to use the MACD with the crossing of the zero line? **
¦After the MACD Configuration you can see how the crossing between the MACD line and the signal line is achieved, as shown in this graph it happened several times. And we observe in the same way the moment in which the crossing of the zero line is made, at first it announced a low, then the rise came and then it manifested a low and finally a significant upward movement.
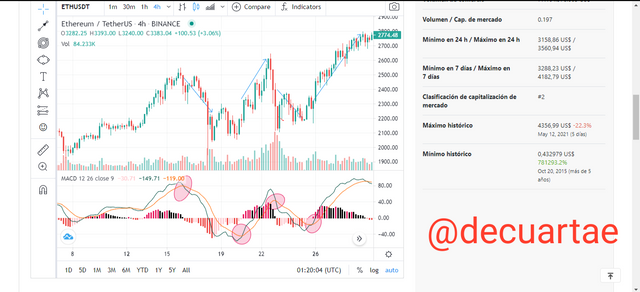
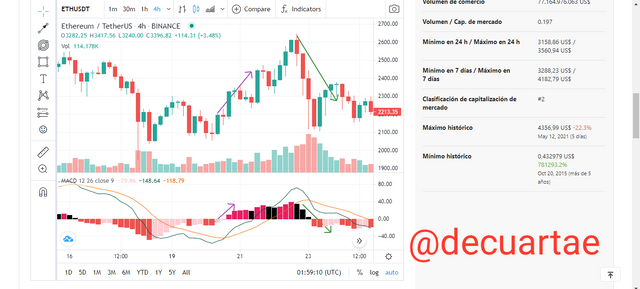
Con la información que nos proporciona el Indicador MACD sobre la tendencia en la que se encuentra el mercado, lo vemos analizando su Histograma.
Cuando el Histograma de MACD aparece por encima de la línea cero, junto con la línea de señal se encuentra en un mercado Alcista
Por el contrario cuando el Histograma de MACD se ubica debajo de la Línea cero, junto a la línea señal esta en un mercado Bajista
Veamos esto en siguiente gráfico con la flecha morada señalo el momento Alcista y con la flecha verde cuando estaba el mercado Bajista
**
6_. How to detect a trend using the MACD? And how to filter false signals? (Screenshot required) **
With the information provided by the MACD Indicator about the trend in which the market is, we see it by analyzing its Histogram.
When the MACD Histogram appears above the zero line, along with the signal line it is in a Bull market
On the contrary, when the MACD Histogram is located below the zero line, next to the signal line it is in a bear market
Let's see this in the following graph with the purple arrow I indicate the Bullish moment and with the green arrow when the bear market was
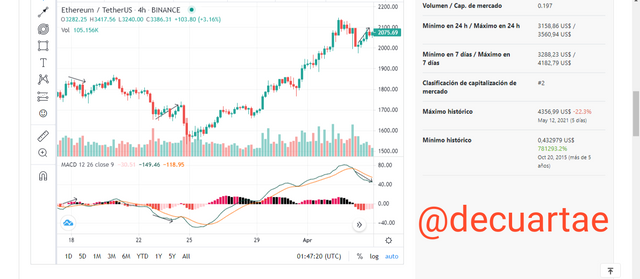
Para filtra las señales falsas, debes tener en cuenta que las divergencias que puede generar un indicador son esas señales de momento, las mismas se producen cuando el precio y el indicador no están a la par. El precio sube o baja y el indicador no lo sigue.
Las divergencias son señales que nos indican un cambio de tendencia.
En el gráfico podemos ver que se presentan en el MACD una divergencia alcista pero se puede observar en el gráfico real que no es así
En un segundo momento se observa una divergencia bajista y en el gráfico se observa la tendencia alcista.
To filter false signals, you must bear in mind that the divergences that an indicator can generate are those signals at the moment, they occur when the price and the indicator are not at par. The price rises or falls and the indicator does not follow it.
Divergences are signals that indicate a change in trend.
In the chart we can see that there is a bullish divergence in the MACD but it can be seen in the real chart that this is not the case.
In a second moment, a downward divergence is observed and the upward trend is observed on the graph.
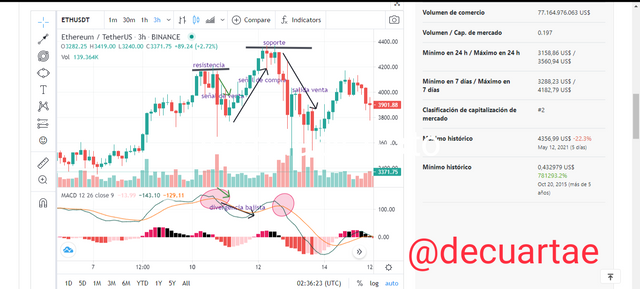
En el gráfico, partimos de una señal en el cruce de la línea MACD y la línea de señal, definiendo un primer punto de resistencia, lo que nos indica que hay señal de venta, por encontrándose en mercado Bajista, pero puedo notar que se presenta una divergencia bajista, por lo cual se omite esa señal de divergencia y nos vamos al gráfico principal que nos incida una tendencia alcista es decir señal de compra, de igual manera establezco un límite de soporte esperando la siguiente señal que se produce en otro cruce de las líneas MACD y señal finalizando con una tendencia bajista con su señal de venta
**
7_. How can the MACD indicator be used to extract support and resistance points or levels on the chart? Use an example to explain the strategy (Screenshot required) **
In the chart, we start from a signal at the crossing of the MACD line and the signal line, defining a first resistance point, which indicates that there is a sell signal, because it is in the bear market, but I can see that it is presented a bearish divergence, for which this divergence signal is omitted and we go to the main chart that an upward trend affects us, that is, a buy signal, in the same way I establish a support limit waiting for the next signal that occurs in another cross of MACD and signal lines ending in a downtrend with its sell signal
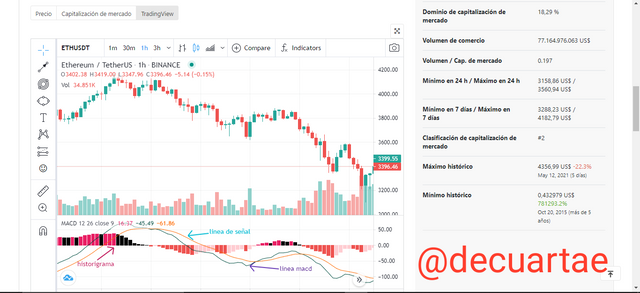
En el indicador MACD se representan gráficamente mediante líneas, una, la líneas señal y la otra la línea MACD y además de un Histograma o lo que vendría a ser un gráfico de barras.
Utilizando las. Monedas Ethereum y Tether, en el gráfico representamos con el Color Fuscia al Historigrama
Con el Color azul identificamos la señal
Y por último con el color morado la línea MACD
**
8_. Check the chart of any pair and present the various MACD signals (Screenshot required) **
In the MACD indicator they are represented graphically by lines, one, the signal lines and the other the MACD line and also a Histogram or what would be a bar chart.
Using the. Ethereum and Tether currencies, in the graph we represent the History Chart with the Fuscia Color
With the Blue Color we identify the signal
And finally with the purple color the MACD line
Podemos concluir que el indicador MACD es el indicador más usado por su versatilidad, y además por su dualidad al anunciar la tendencia y el impulso del mercado, teniendo mejor capacidad para lograr adaptarse y ser útil a cualquier mercado, para el trading y la inversión.
Aunque es efectivo y muy fácil de usar. Como todos los indicadores no son 100% acertados, como vemos. Presenta muchas señales falsas. Este indicador puede aplicarse a cualquier período de tiempo es por ello que es el. Consentido de los Traders.
Aunque no fue nada fácil la solución a esta tareas, espero estar en lo. Correcto y recibir la evaluación y observaciones correspondientes de parte de profesor.
Agradeciendo una vez su clase.
We can conclude that the MACD indicator is the most used indicator for its versatility, and also for its duality when announcing the trend and the market momentum, having a better ability to adapt and be useful to any market, for trading and investment.
Although it is effective and very easy to use. As all the indicators are not 100% correct, as we see. It has many false signals. This indicator can be applied to any period of time that is why it is the. Consent of the Traders.
Although the solution to this task was not easy at all, I hope to be in it. Correct and receive the evaluation and corresponding observations from the teacher.
Thanking your class once.

Hello @decuartae,
Thank you for participating in the 6th Week Crypto Course in its second season and for your efforts to complete the suggested tasks, you deserve a 7/10 rating, according to the following scale:
My review :
Good job. you answered the questions clearly. It remains that you did not delve deeper into analyzing some points, especially in the last question, where you did not address the change in price movement based on the MACD signals.
Thanks again for your effort, and we look forward to reading your next work.
Sincerely,@kouba01
Professor, I appreciate your evaluation so much and I will take into account your observation to give more details on the topics. Thanks