Steemit Crypto Academy Season 2-Week4 @kouba01 | Cryptocurrency Trading with RSI | Por @decuartae

Saludos a todos, la verdad esta semana estoy más motivada en cuanto a la realización de las tareas de la criptoacademia, hoy les comparto mi propuesta para el profesor @kouba01 quien luego de su excelente la clase nos deja las siguientes preguntas:
Greetings to all, the truth this week I am more motivated in terms of carrying out the tasks of the cryptoacademy, today I share my proposal for the teacher @ kouba01 who after his excellent class leaves us the following questions:

RSI es en Teoría una herramienta, utilizada para calcular el volumen de los movimientos registrados en los precios, de igual forma monitorear la velocidad que experimenten dichos movimientos.
Es decir que es un oscilador que permite observar los movimientos sean en sobreventa o en Sobrecompra, dentro de un gráfico como resultados de los cambios que experimenten los precios en el mercado.
Esta técnica fue desarrollada a finales de los años 70 por Welles Wilder, su propósito principal era que los inversores tuvieran la oportunidad de evaluar el rendimiento de un valor en un periodo de tiempo establecido.
RSI is in theory a tool, used to calculate the volume of the movements registered in the prices, in the same way to monitor the speed that these movements experience.
In other words, it is an oscillator that allows us to observe the movements, whether they are oversold or overbought, within a graph as a result of the changes experienced by prices in the market.
This technique was developed in the late 70s by Welles Wilder, its main purpose was that investors had the opportunity to evaluate the performance of a security in a set period of time.
¿Cómo se Calcula?
Como es sabido hoy en día con el auge de la tecnología se puede automáticamente realizar el cálculo del RSI Pero no podemos dejar de conocer la fórmula original ideada por su creador para conocer con exactitud cómo se calcular el Índice de Fuerza Relativa
Para el cálculo hay varios factores a tomar en consideración en primer lugar debemos
cotejar las últimas actividades en sus variables de precios (ganancias promedios y pérdidas promedio) en un período establecido.
La fórmula a aplicar sería :
RSI = 100 - 100 / ( 1 + SRI)
Dónde RS (fuerza Relativa) = ganancias media / pérdida media, estableciendo las medias de las últimas subidas entre la media de las últimas bajadas.
How is it calculated?
As is known today with the rise of technology, the calculation of the RSI can be automatically carried out.But we cannot fail to know the original formula devised by its creator to know exactly how the Relative Strength Index is calculated.
For the calculation there are several factors to take into consideration, first of all we must
collate the latest activities in their price variables (average gains and average losses) in a set period.
The formula to apply would be:
RSI = 100 - 100 / (1 + SRI)
Where RS (Relative strength) = average gain / average loss, establishing the means of the last rises between the average of the last decreases.

Sin duda alguna el RSI es una herramienta que brinda muchas buenas opciones y sin duda seria una opción muy confiable y recomendable para usarla en el mercado de las criptos, son quizás los beneficios que ofrece que la hacen confiable, como lo es el hecho de que nos muestra la velocidad y la amplitud de los cambios de precio, además con el RSI podemos verificar los precios de cierre de las velas actuales y las pasadas lo que nos indicará la fuerza de la tendencia.
Si bien es cierto que en el mundo de las criptomonedas es de gran ayuda usar el indicador RSI, después de la investigación comprendí que quizás para este mercado la configuración a un período de 14 no sería la mas aconsejable debido a la alta volatilidad, que se registra, lo que sería mas recomendable usar una configuración de 21 Períodos.
Undoubtedly the RSI is a tool that offers many good options and without a doubt it would be a very reliable and recommended option to use in the crypto market, it is perhaps the benefits it offers that make it reliable, such as the fact that It shows us the speed and the amplitude of the price changes, in addition with the RSI we can verify the closing prices of the current and past candles, which will indicate the strength of the trend.
Although it is true that in the world of cryptocurrencies it is very helpful to use the RSI indicator, after the investigation I understood that perhaps for this market the configuration at a period of 14 would not be the most advisable due to the high volatility, which is registers, which would be more advisable to use a configuration of 21 Periods.

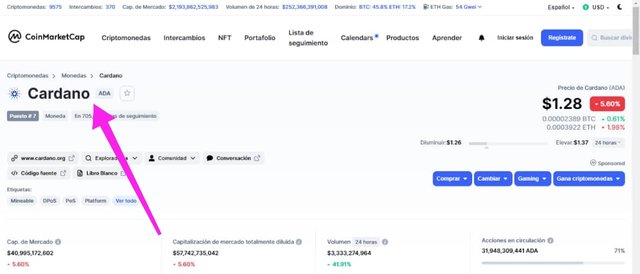
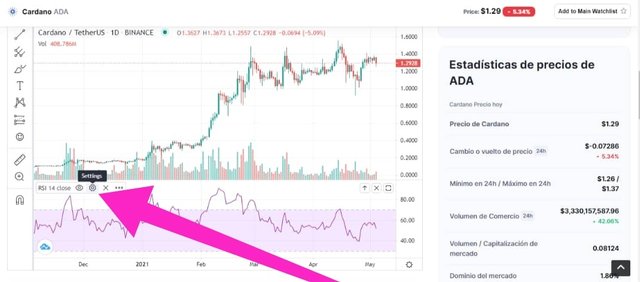
Para realizar la configuración del indicador RSI debemos buscar una página en Internet que maneje gráficos, en este caso lo hice desde Coin Market Cap
Y debemos seleccionar la moneda a la que vamos a monitorear
To configure the RSI indicator we must look for a page on the Internet that handles charts, in this case I did it from Coin Market Cap
And we must select the currency that we are going to monitor
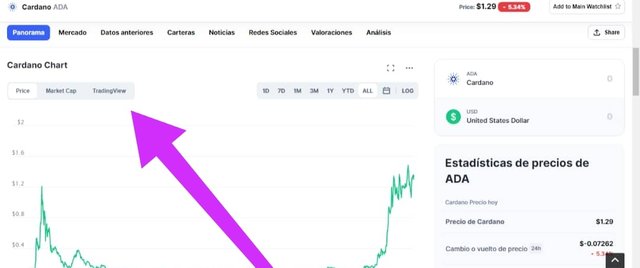
Enseguida debemos darle clic a la palabra TraidigView
Next we must click on the word TraidigView
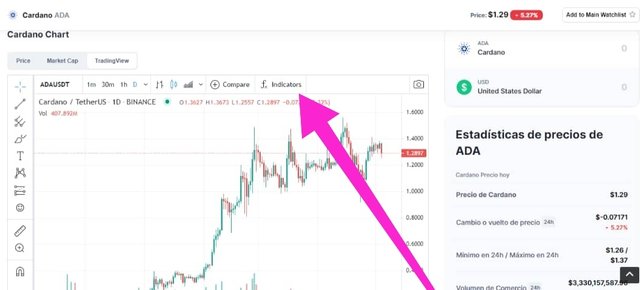
Luego daremos clic a la palabra Fx indicators
Then we will click on the word Fx indicators
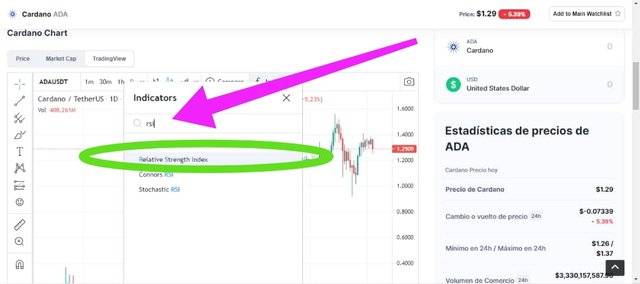
En esa pestaña debemos colocar el nombre de nuestros indicador (RSI) y al indicarnos las opciones le vamos a indicar que queremos saber el Relative strength index
In that tab we must place the name of our indicator (RSI) and when we indicate the options we will indicate that we want to know the Relative strength index
Inmediatamente buscaremos el botón de configuración y seleccionamos
We will immediately look for the configuration button and select
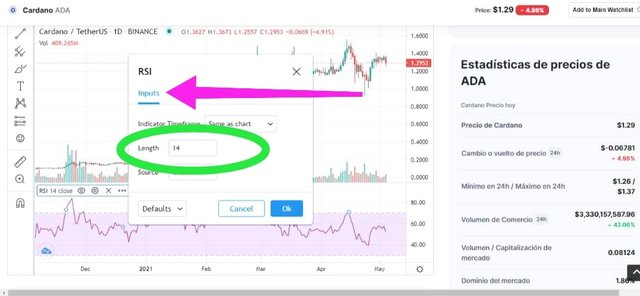
Seguidamente le daremos al botón de Inputs donde vamos a colocar la longitud, como estamos estudiando el oscilador RSI la configuraremos a 14 que es la establecida por willer
Next we will give the Inputs button where we are going to place the length, as we are studying the RSI oscillator we will configure it to 14 which is the one established by willer
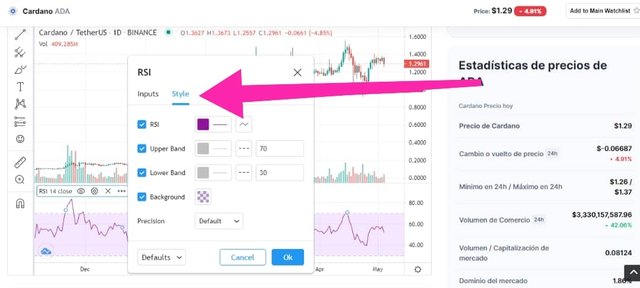
Una Vez que indicamos la longitud, vamos a darle clic al boton Style donde podemos personalizar nuestro gráfico.
Once we indicate the length, we are going to click on the Style button where we can customize our graphic.
Y así se vería Nuestro Gráfico, después de haberlo configurado al indicador RSI
And this is what Our Chart would look like, after having set it to the RSI indicator
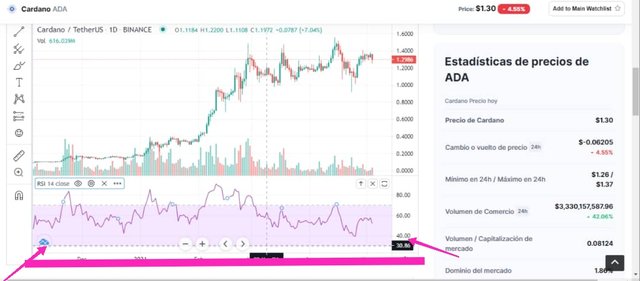
Cuando Welles Wilder creo la herramienta, estableció el 14 de longitud, como la medida más idónea para poder ver los diferentes niveles que reflejarán los gráficos, por ellos se establecen los 14 de longitud como un estándar, y es el método mas empleado.
Por otra parte se puede cambiar, perfectamente ajustándolo a las necesidades o requerimientos que como inversionistas o empresarios deseemos en un momento determinado. Todo dependerá del por y para que lo Usemos.
En este ejemplo que presento a continuación podemos observar que esta configurado al estándar 14 de longitud, y nos muestra un gráfico con sus espacios, donde podemos observar detalladamente los movimientos en subidas y bajadas, teniendo como un control de como se va registrando.
When Welles Wilder created the tool, he established 14 in length, as the most suitable measure to be able to see the different levels that the graphics will reflect, for which the 14 in length is established as a standard, and it is the most used method.
On the other hand, it can be changed, perfectly adjusting it to the needs or requirements that as investors or entrepreneurs we want at a given time. Everything will depend on why and what we use it for.
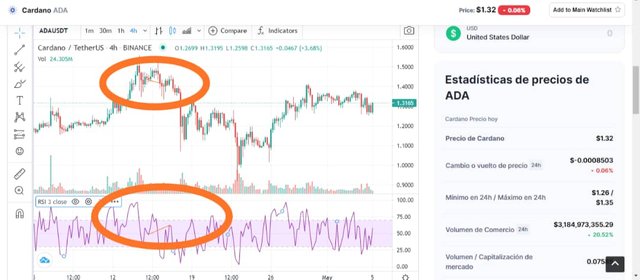
In this example that I present below, we can see that it is configured to the standard 14 in length, and it shows us a graph with its spaces, where we can observe in detail the movements in ascents and descents, having as a control of how it is recorded.
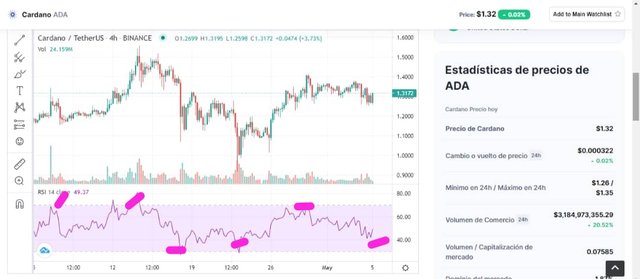
Ahora bien es este Capture que a continuación les presento se hizo la configuración al 3 de longitud, y nos podemos dar cuenta que no existen espacios para ver que sucede, todo pasa muy rápido y sin orden
Now it is this Capture that I present below, the configuration was made at 3 in length, and we can realize that there are no spaces to see what happens, everything happens very quickly and without order
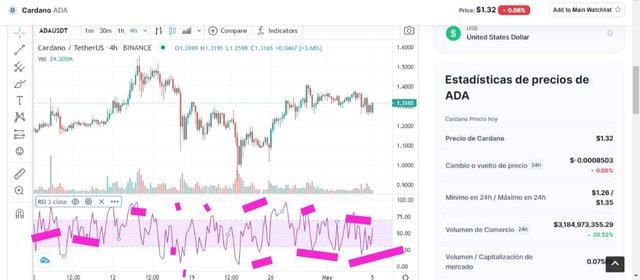
Es por esta razón que es preferible medir la longitud, siempre con el estándar de 14 por defecto, aunque estamos claros que todo dependerá de las situaciones y además las necesidades de cada usuario del RSI
It is for this reason that it is preferable to measure the length, always with the standard of 14 by default, although we are clear that everything will depend on the situations and also the needs of each RSI user

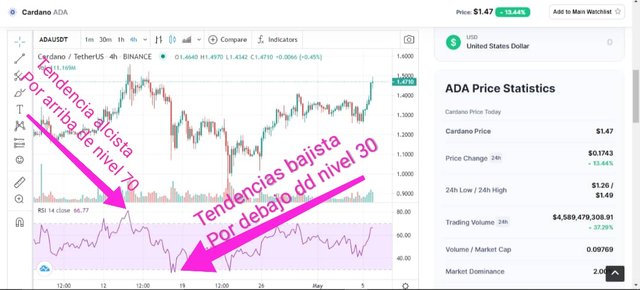
Aquí llega la parte donde vemos como se manera el RSI desde las altas y las bajas, es decir las altas es cuando llega al momento de la sobreventa y en baja indica que está en el momento de la sobrecompra.
De una manera sencilla la sobreventa se dará cuando el nivel esta por el margen de los 30 lo que indica que los precios han bajado y los movimientos dejan de tener fuerza.
Por otra parte la sobrecompra se manifiesta sobre el nivel de 70 y aquí los precios tienen un alza lo que podrá traer como consecuencia una caída, donde lo mas recomendado es vender, siempre dejándonos llevar por la herramienta RSI y observando sus niveles tanto altos como bajos.
Here comes the part where we see how the RSI is formed from the highs and the lows, that is, the highs is when it reaches the moment of overselling and the low indicates that it is at the time of overbought.
In a simple way, the oversold will occur when the level is around the 30 margin, which indicates that prices have fallen and movements are no longer strong.
On the other hand, the overbought manifests itself above the level of 70 and here the prices have an increase which may lead to a fall, where the most recommended is to sell, always letting ourselves be carried away by the RSI tool and observing its levels both high and low. .
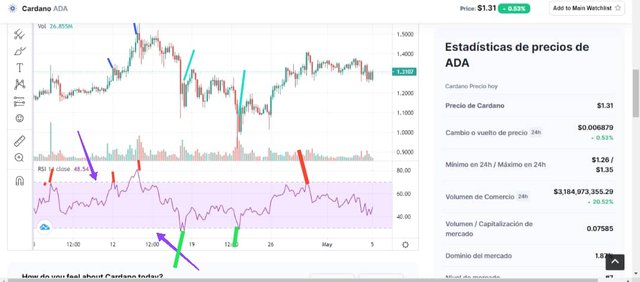
Para entender mejor el gráfico de arriba dejo la leyenda.
El Color Rojo 🔴 nos Indica la sobrecompra
El color Verde 🟢 la sobreventa
Con el Morado 🟣indicamos los niveles 70 / 30
Con el Azul 🔵tenemos las velas indicador de alza
En el Turquesa🔘 vemos las velas indicador de bajas.
To better understand the graphic above I leave the legend.
The Red Color 🔴 Indicates the overbought
The color Green 🟢 oversold
With Purple 🟣 we indicate levels 70/30
With the Blue 🔵 nemoswe have the bullish indicator candles
In Turquoise🔘 we see the downside indicator candles

Exiten varios métodos aplicables para filtrar señales falsas que suelen aparecer debido a los tiempos cortos en los que se opera, uno de ellos es el ADX en 14 o el MACD en 3, 81, 29 o bien en configuraciones de 3" 10, 16.
Desde mi manera de ver la situación el motivo de las señales falsas se debe a las innumerables divergencias ya que al no estar sincronizadas con el movimiento real se confunden los movimientos. Comúnmente se presentan divergencias entre el precio y nace siendo una señal de fuerza para el agotamiento en la tendencia del momento, por ejemplo si tenemos establecido mínimos que van de mayor a menor en el precio y el MACD que nos está generando nuevas bajas estaríamos al frente de una señal falsa.
Lo cierto del caso es que en el mismo gráfico se refleja los cambios que viene a consecuencia del agotamiento es decir que si la tendencia del momento es baja, la interpretación nos pudiera alertar debilidad de ventas, caso contrario si es alta debilidad de compra.
Analizando lo antes expuesto tendríamos dos escenarios y todo dependería si se mantienen operadores de peso, para que sea debilidad se pueda convertir en beneficio de la tendencia del momento. Para todo esto tenemos aue tener la suerte que operadores estén activos y entren al momento de la caída para cuando venga la tendencia alta, o en su defecto la recompra si está en baja.
Esto es mas complicado que el ajedrez pero si te asesoras bien y estás pendiente de tu inversión difícilmente caerás en las señales falsas.
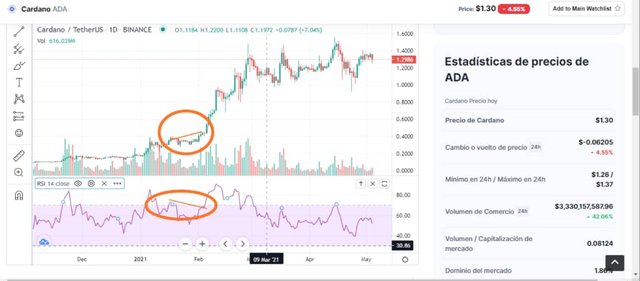
A continuación coloco dos ejemplos con respecto a mi gráfico
Aquí la señal del RSI sería alcista pero la tendencia real es bajista.
There are several applicable methods to filter false signals that usually appear due to the short times in which it operates, one of them is the ADX at 14 or the MACD at 3, 81, 29 or in 3 "10, 16 configurations.
From my way of seeing the situation, the reason for the false signals is due to the innumerable divergences since, as they are not synchronized with the real movement, the movements are confused. Commonly there are divergences between the price and it is born as a sign of strength for the exhaustion in the trend of the moment, for example if we have established minimums that go from higher to lower in the price and the MACD that is generating new losses we would be in front of a false signal.
The truth of the case is that the same graph reflects the changes that come as a result of exhaustion, that is to say that if the current trend is low, the interpretation could alert us to weak sales, otherwise if it is high purchasing weakness.
Analyzing the aforementioned we would have two scenarios and everything would depend on whether weight traders are maintained, so that it is weakness it can become a benefit of the current trend. For all this we have to be lucky that operators are active and enter at the time of the fall for when the high trend comes, or failing that, the buyback if it is down.
This is more complicated than chess, but if you advise yourself well and are aware of your investment, you will hardly fall for false signals.
Below I put two examples with respect to my graph
Here the RSI signal would be bullish but the actual trend is bearish.
Aquí seria todo lo contrario el RSI muestra una tendencia bajistas pero el gráfico muestra la tendencia alcista.
Here it would be the opposite, the RSI shows a downtrend but the graph shows the uptrend.


Para finalizar podemos decir que es muy fácil el uso del RSI además sus múltiples ventajas, como ser de fácil interpretación, determinar tendencias en el mercado de valores y además el hecho de permitir ver si el mercado esta en las áreas de sobreventa o sobrecompra lo. Convierten en una herramienta muy útil, no por nada lleva casi 30 años en el mercado.
Por otra parte es importante aclarar que es importante saber determinar la configuración correcta del RSI dependiendo de lo que deseemos invertir.
Agradezco mucho la evaluación y las sugerencias que deban hacerme y también el apoyo y los conocimientos que hemos adquirido durante las clases y las asignaciones de la Criptoacademia
Finally, we can say that it is very easy to use the RSI in addition to its multiple advantages, such as being easy to interpret, determining trends in the stock market and also allowing us to see if the market is in the oversold or overbought areas. They become a very useful tool, not for nothing has it been on the market for almost 30 years.
On the other hand, it is important to clarify that it is important to know how to determine the correct RSI configuration depending on what we want to invest.
I greatly appreciate the evaluation and suggestions that you should make me and also the support and knowledge that we have acquired during the classes and assignments of the Cryptoacademy
Todos los Captures fueron Tomados desde mi Teléfono Redmi 8
All Captures were Taken from my Redmi 8 Phone

Hi @decuartae
Thanks for your participation in the Steemit Crypto Academy
Feedback
Good work. Well done with your research on RSI trading indicator.
I have noticed some point that you need to correct;
That should have been oversold NOT an overbought.
Homework task
7
Gracias Profesor 🙏🙏 quería salir de esa clasificación de 5 y le dedique mucho a mi asignación Agradezco su Evaluación y sugerencias que ya mismo Revisaré.