Steemit Crypto Academy Season 3-Week 1 | Trading Crypto With Ichimoku-kinko-hyo Indicator - Part 1
First, I must appreciate Professor @kouba01 for taking us through such a beautiful lecture that is highly proficient in placing trades and I'm happy participating in this week's opening lecture of season three in this academy.
What is the Ichimoku Kinko Hyo indicator? What are the different lines that make it up? (screenshots required)
This is actually an indicator developed by a Japanese journalist named Goichi Hosoda, which was an invention he started working on before the second World war of September 1939. but it was precisely created in 1940.
It is an indicator which aids in easily identifying the support and resistance levels in a market trend.
Nevertheless, it has a very distinct system of measurement in which it spots 6 days of the week as the Japanese has 6 business days, 26 days in a month with Sundays in exemption but including Saturdays and 52 days in 2 months being 60 days less 8 sundays as a default. But all these days are counted as periods in the chart.
This indicator is made up of three lines which are: kijun Sen, Tenkan Sen and Chikou Span
- KIJUN SEN:
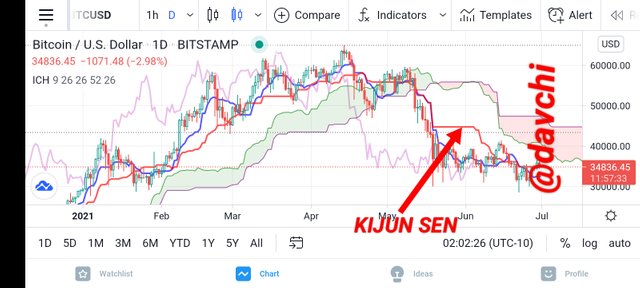
This line is actually the conversion base line which is calculated as the highest high and the lowest low average of the regressed 26 periods, which according to the concept of this indicator is just 30 periods less 4. being the Japanese business days. so it is the average measurement of the made high and made low of a trend, calculated within the past 26 periods.
- TENKAN SEN:
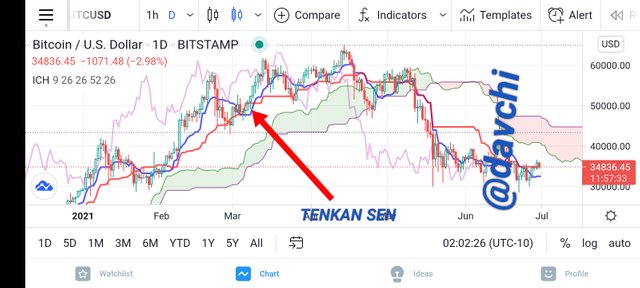
This is the conversion line of Goichi's invention which is calculated with the average of the lowest low and the highest high of the lagged 9 periods.
- CHIKOU SPAN:
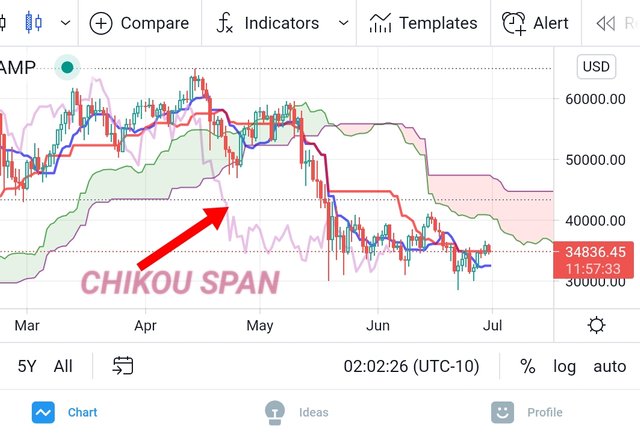
This line could also be known to be the periods regression or lag line.
It is calculated as today's actual closing price regressing 26 periods of the month, that is today's market closing price plotting back to 26 days.
This indicator is characterized by two Senkou Spans which are:
- SENKOU SPAN A:
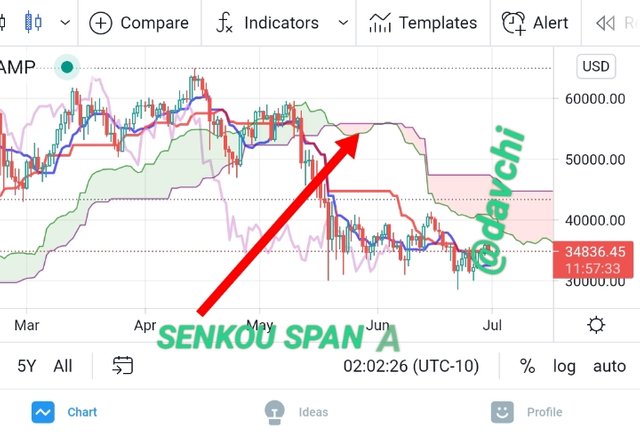
This Span is actually one of the two clouds in this invention which stands between the base line and the conversion line simultaneously, therefore it is more progressive in the chart as it stretches 26 periods ahead.
- SENKOU SPAN B:
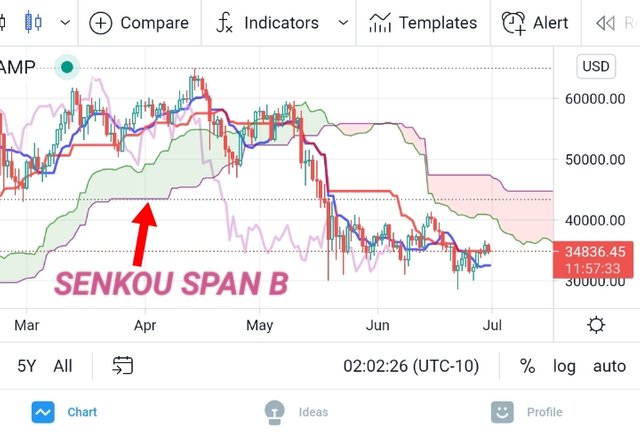
This is also a leading span in this invention, calculated as the average of the lowest low and the highest high of the past 52 periods and also plots 26 periods ahead/further
Finally it is noteworthy that from our conventional bearish and bullish trend, these two clouds can actually indicate them.
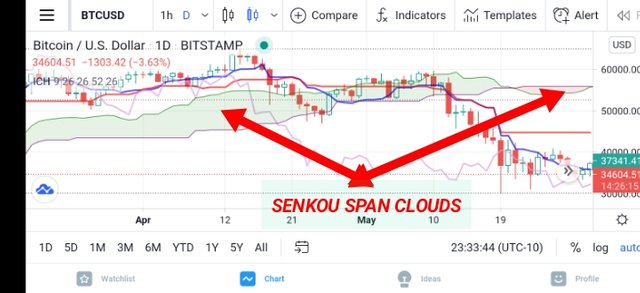
Nevertheless, if price is below the cloud, the price is Bearish and if it is above the cloud, it is Bullish and the two clouds can also serve as resistance and support checks for the chart.
Moreso it is observable that whenever SENKOU SPAN A is above, the cloud turns green and whenever SENKOU SPAN B is above, the cloud automatically turns purple.
How to add the Ichimoku indicator to the chart? What are its default settings? And should it be changed or not?(screenshots required)
Now on grounds of adding the indicator into a trade chart, these are the procedures although I'm using trading view to authenticate this.
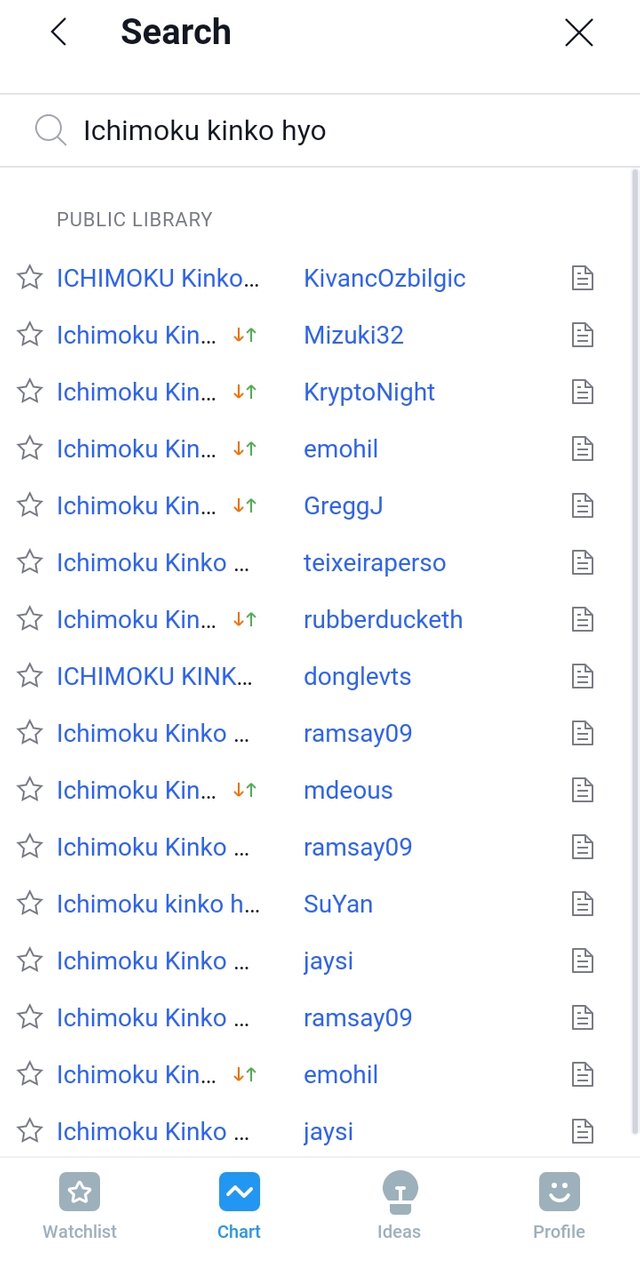
- First, on my trading interface I click on indicator as it opens then I click on built-in as it opens, I now search for Ichimoku kinko hyo using the search icon.
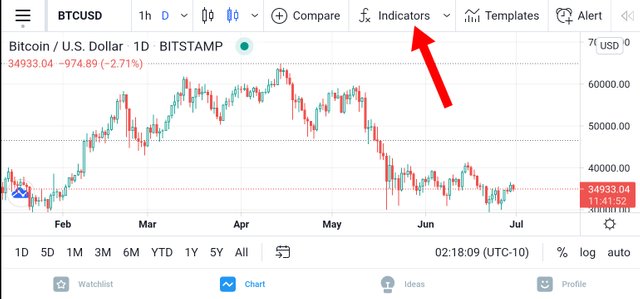
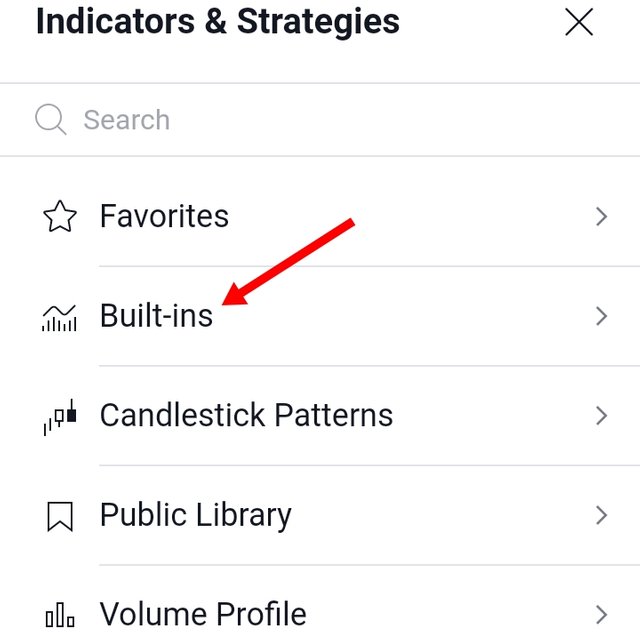
- Next I click on the built-in indicator I'm looking for which is (Ichimoku kinko hyo) and finally proceed to my trading interface to continue.
NOW LET'S GO ON ITS DEFAULT SETTINGS, THESE ARE THE PROCEDURES;
FIRST ON THE INPUT LEVEL:
Tenkansen length is inputed 9, indicating 9 periods.
Kijunsen length is 26, indicating 26 periods.
Chikouspan length is 26, indicating 26 periods.
Senkouspan A is 26, indicating 26 periods.
Senkouspan B is 52, indicating 52 periods.
NEXT ON THE STYLES:
| LINES | COLORS |
|---|---|
| Tenkansen | line is blue |
| Kijunsen | line is red |
| Chikouspan | line is pink |
| Senkouspan A | line is green |
| Senkouspan B | line is purple |
On the other hand, I don't think it's expedient to change its default settings since they are in consonance with the inventors theory of days/period especially the figures because changing it will actually cause a deviation from the inventors master plan. But based on the users ability to work with different styles (colour) they can actually manipulate it to suite them but the input figures should not be touched for the sake of inbuilt accuracy of this indicator.
How to use the Tenkan Sen line? How to use the Kijun Sen line? And How to use them simultaneously?(screenshots required)
Now to use the Tenkansen line, this actually the median of the made high and made low of a corresponding period of 9 days calculated as low level + high level ÷2 of 9 periods.
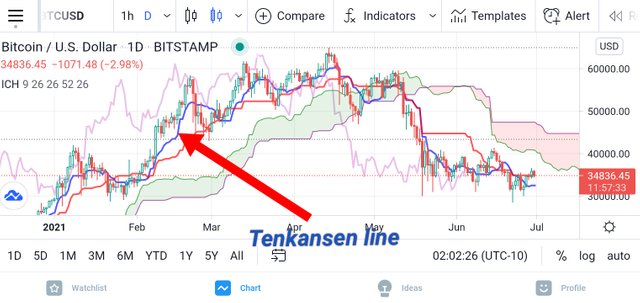
Hence Tenkansen is an indicator line which could be used to place a short term buy and a short term sale in the market trend and within this short periods, if the market volatility is actually high and the trend is going up, one can place a buy trade and on the other hand if the effect of market volatility is pushing the trend downward, it's advisable for a trader to place a sell trade and finally if the market volatility is too low is advisable to hold and observe the trend. This period is actually identified in 9 candle chart if a trader is using candle chart for instance.
A high volatility in the market will actually dent this line in a more effective and obvious way either high or low within the identified 9 periods.
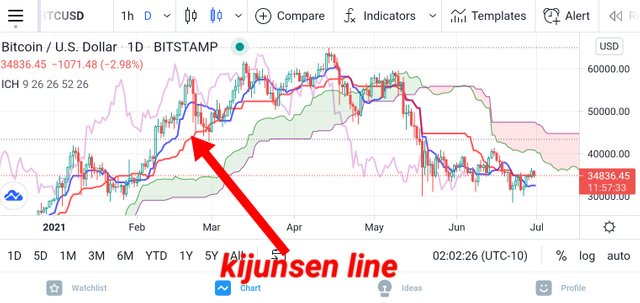
Next on the usage of the kijunsen line; This line actually estimates the median of the low and high levels of price trend in 26 days but divided by 2.
It looks into the trend of price performance from the current view drafting it 26 periods backwards which is obviously observed in 26 candle charts.
On like the Tekansen, the kijunsen also indicates the level and spots of market performance either up or down for the past 26 periods from the instant view and it could also be used to identify positions of placing either a buy or a sale trade. based on price or market volatility.
Finally when there is an upward movement this line, it is advisable to place a buy trade and on the other hand, when there is a downward movement of this line, it is also advisable to place a sale trade but in cases of less market volatility it is good to scrutinize the next price action before placing any trade.
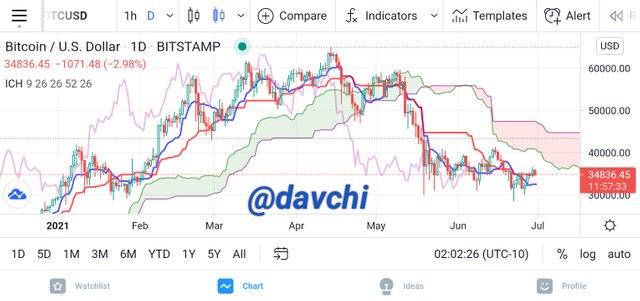
A simultaneous use of these lines is actually a perfect strategy in making profit from trade.
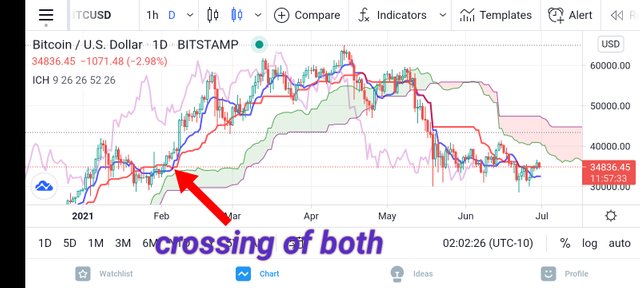
Hence from a perfect observation indicates that an upward trend of the Tenkansen show a price increase and it's downward trend indicates price decrease and when ever the Tenkansen is crossing the kujensen from under, it is an indication that there will be a price increase and on the other hand, if the Tenkansen is descending andcrossing the kujensen from above, it's an indication that there will be a price decrease and this will promulgate a trader to either place a buy order that is when the Tenkansen is ascending and crossing the kujensen from beneath and on the contrary a trader should place a sell order when the Tenkansen is descending and crossing the kujensen from above it.
And from my above screenshot, the crossing of the two lines where the Tenkansen is crossing the kujensen in an ascending position which is a clear indication of price increase.
What is the chikou span line? And how to use it? And Why is it often neglected? (screenshots required)
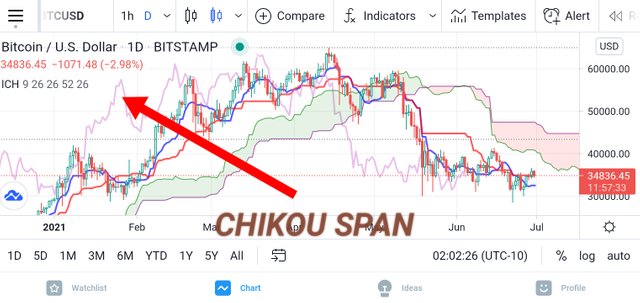
The Chikou span line is a line in the ichimoku indicator which shows the chat lag at the past 26 periods but not actually from the current chart of the market trend on like the Tekansen and the kujensen line that shows their lag from the most current chart.
Based on its usage, it obviously indicates past periods of high and low volatility of the market trend. If it is taking an upward trend, it actually indicates price increase and a trader at this point should go for a buy trade but cautiously because of the density of it's lag nature and on the other of it is taking a bearish trend, a trader should go for a sale trade but also taking note against price reversal because you are actually working with a highly regressed lagged line.
And from my spotted indication above it can be noticed that the line took an upwards bullish trend which is an indication of price increase.
The cause of the negligence of this line is very simple, i believe that no one will keep working with a system that is back dated without any current effect as it's clearly indicated that this line has no current effect in chart trend and we can see that it missed the current chart in 26 periods and there is no need of working with it since the trend can not be reversed in that 26 periods as to work with this line.
What's the best time frame to use Ichimoku? And what is the best indicator to use with it? (screenshots required)
I believe that time frames are dependent on individual techniques in trade as I may like to use an hour for my trade, another trader may decide to use 5munites or more. I also believe that there are traders that places long term trade and may not have time to be checking on their trades frequently, so these set of traders may be going for a day or a week time frame. Finally the best time frame is contingent upon the traders preference.
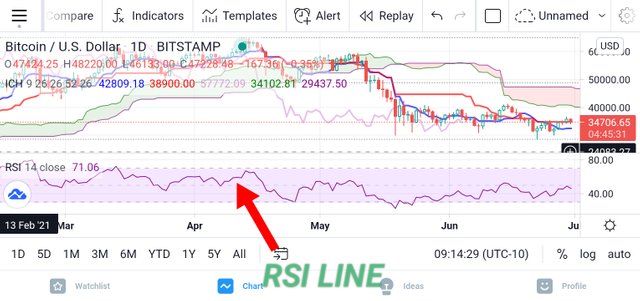
The best indicator to merge along with Ichimoku amongst other indicators for me is the RSI. Because with the help of the RSI, one can easily spot the over bought or the over sold region as to ascertain the next trend.
nevertheless we all know that if the trend gets up to 70% of the RSI indicator, it points out that the trade is at the over sold region a has the possibility of reversing back and on the other hand, if it is at the 30% of the RSI level, it is also an indication that the price has got to the over bought region and has the tendency of reversing upwards again. Finally with the help of the assertion made by the RSI, it will actually aid a trader to easily know where to place his trade and also the trend if the market.
This built-in chart indicator is actually a very proficient one in placing trades as it does not only show price movement but also determine positions of support and resistance which can aid favourable trade.
A clear knowledge of this indicator does not actually require much indicators to be inserted into a trade chart as it can absolutely give a trader what he really can rely and and trade confidently.
thanks to professor @kouba01 for this exposition into another trading indicator and I'm grateful for patiently going through.
Cc: @kouba01
Dear @davchi
Thank you for participating in Steemit Crypto Academy Season 03 and making efforts to complete the homework task. You got 9/10 Grade Points according to the following Scale;
Key Notes:
We appreciate your efforts in Crypto Academy and look forward to your next homework tasks.
Regards
@cryptokraze
Thanks professor @kryptokraze for actually going through my work, I really appreciate but most times I prefer using my phone for ease and speed of work but on the other hand, I will start using my PC for maximum reward. I think that'll be better. Thanks.
Phone is good for trading. To make better charts that have better clarity and readability, you should use desktop version of Tradingview. You will be surprised to see your posts having more aesthetic value.
I hope you understand this point.
Regards
@cryptokraze
Ok thanks professor, this is a good idea using desktop version.