{Steemit Crypto Academy - Season 2, Week 8} The Wyckoff Method - El Método Wyckoff

First i must congratulate professor @fendit for this week's incredible lecture which Is a great exposure into the market operation I'm grateful participating.
Share your understanding on "Composite Man" and the fundamental laws. What's your point of view on them?
This concept is actually a depiction and a theoretical analogy into the different criteria upon which the market is partterned and operated.
It further investigate and ascertains the causes of price fluctuations and individual behavioural approaches as against commodities which actually pose the up and down trend in prices of assets even as formulated by the stock market investor wyckoff and properly expantiated by professor @fendit respectively in her context.
Now how does this concept or theory influence individuals.
Nevertheless I have to agree to the fact that this theory is actually an extension of composite demand; which is really the diverse use of a good and at which the increase in the demamd of a particular good leads to a fall in the price of other commodities, although this is abit contrasting to the contextual meaning of the wyckoff theory in that his theory exerts that the increase in the accumulation of a particular good or certain goods will at its apex lead to a fall in the same commodity or asset.
Now the composite man is all about the market operation or mechanism, what is its function? This entells as sellers or keeps flooding a particular asset or good into the market, the market will accumulate to the extent it will draw other potential investors to purchase the same good at a reduced rate which is as a result of the law of demand and supply, which explains that an increased supply of a particular product will lead to a fall in it's price and also an increase in the demand of a particular good will lead to a rise in it's price.
So far, let's take a practical and analytical dichotomy into this theory using a chart trend even as exhaustedly expressed by professor @fendit.
.jpeg)
From the chart we can deduce the following which is actually the function of the composite man or concept. And hence it is segmented into four phases. So let's take them in bit.
The Accumulation Stage:
This is the stage at which the market gathers or accumulates more asset and is now set for investors. And it is not worthy that at this point, the prices of assets are comparatively low which enables investors to place high demand on the available assets.
The Markup Trend:
This is the stage that due to the magnanimous effect of demands made or placed by investors on a particular asset, the market on the other hand automatically adjust because of the invisible hand of demand and supply, there by inflating or increasing the price of the asset in question.
On this trend, there is also the tendency of investors re-accumulating more assets due to the believe that there will be a further increase in price, and hence this takes us to the Apex level being the distribution stage.
The Distribution Stage:
This is actually the apex stage of the wyckoff market cycle where the investors at noticing the great hike in price now floods the market with their accumulated assets and this will in turn lead to a fall in the price of the said asset. Which is also as a result of the fundamental law of demand and supply which hints that the higher the supply, the lesser the price.
The Markdown/Down trend:
This is the point or trend where investors has virtually sold a very large quantity of their holdings which automatically compels the market to adjust into a decrease in price or in other words a bearish trend caused by high rate of supplies by investors.
With respect to the application of this theory, one should first gain a good knowledge of the market, investigating into it's pasts functioning and then choose an assets that is viable that is an asset that is elastic in price and that can easily adjust positively.
Next, you check on the current trend of your choice asset if it is actually taking a bullish trend and then you employ your best trading patterns, further it is also very wise to compare the strength and price of your chosen asset against other leading cryptoes or assets like the Bitcoin or the Ethereum.
Then if this criteria are met, one can invest in an asset as this theory is reliable
enough to assist in undertaking any rational investment either in Cryptocurrencies or other assets.
Share a chart of any cryptocurrency of your choice (BTC or ETH won't be taken into account for this work) and analyze it by applying this method. Show clearly the different phases, how the volume changes and give detail of what you're seeing.
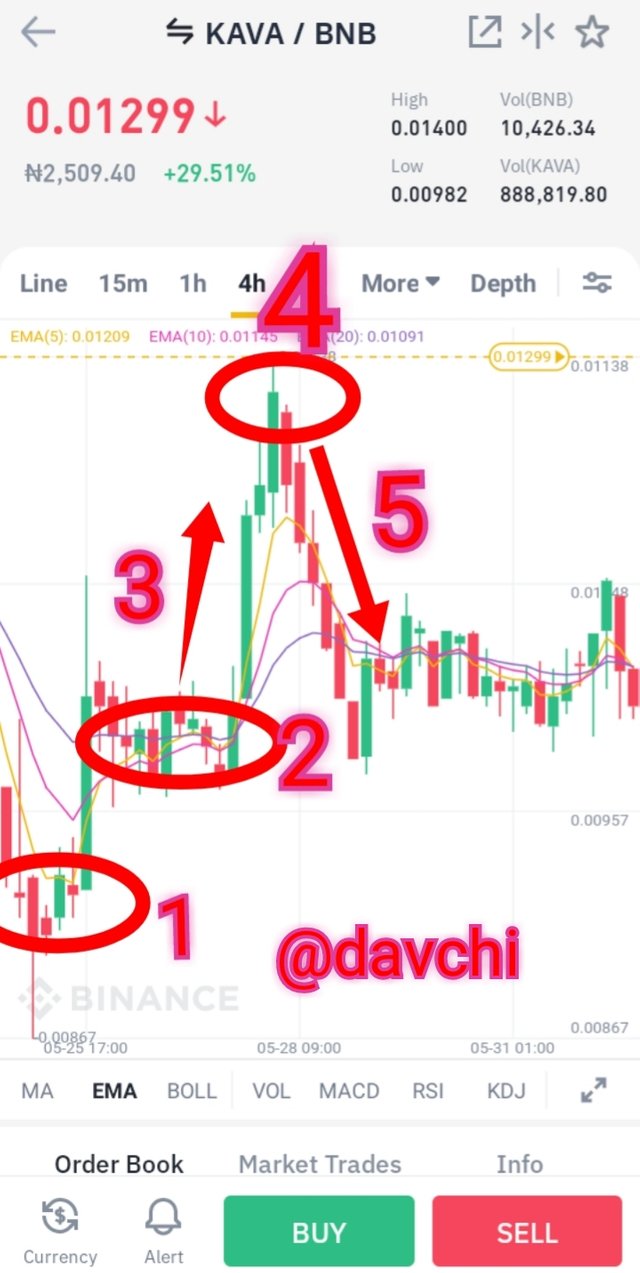
This is a screenshot from Binance indicating the trend and price of KAVA to BNB.
- Phase 1: This point I marked 1, is actually the accumulation period where investors purchase as much KAVA as they could relative to it's low rate of price.
Consequent to this, there will be an ensued rise in price of KAVA due to the high rate at which it is demanded by investors in the market.
- Phase 2: This trend is caused by insatiability in individual behaviour where most investors would like to accumulate despite the rise in price and some will accumulate because they have sold come of their hold of the KAVA crypto, but specifically as price rose after the high demand of KAVA at phase 1, investors has to re-accumulating the same asset intending another rise in it's price. On the contrary, phase 2 is also contingent upon the fact that there was a little sale by investors who has an excess hold of the KAVA assets and this sale resulted to a discontinuation in the trend of the KAVA asset resulting to it's depreciated value which further resulted to a re-accumulation of the same asset by investors.
Phase 3: This trend is brought about by the increase in the rate of demand of KAVA at phase 2 which now tend to the increase in it's price currently at phase 3.
Phase 4: This phase is intrinsically the Apex level in the Wyckoff theory. Here there is no further increase in the price of KAVA because of the high volume of supply of KAVA caused by price increase which is actually a fundamental law of supply " the higher the price, the higher the supply". Nevertheless, this is the stage where the KAVA stabilizes as to take a dowmark trend.
- Phase 5: This phase is marked by a bearish trend of the KAVA crypto, caused by the excessive supply of the same asset in consonance to it's price increase which get resisted in phase 4.
The Wyckoff theory is absolutely an incredible and confidential analysis into the true market operation, and a real exposure into the operation of the invisible hand even as well expressed and interpreted by professor @fendit.
It is actually a law that is backed by fact, which is the responsiveness of the market trend in consonance with price, demand and supply in the market. Thanks for patiently going through my work, I'm grateful.
Cc: @fendit
Thank you for being part of my lecture and completing the task!
My comments:
Your work was fine and really clear!
Although, in the chart you showed,it's missing the volume and that's a vital part of this method. I wish you had included the chart with that showing and, also, that you had identified the different phases in there as well.
Overall score:
6/10
Wow, I'm grateful for your incredible visit ma @fendit, thanks for your observations, scrutiny and assistance.