Introduction to the Principles of Crypto Analysis - Crypto Academy S4W7 - Homework Post for @imagen

1.) What are the differences between Fundamental Analysis and Technical Analysis? Which one is used most often?
The Concept Of Fundamental Analysis
This is the diverse processes which investors utilize in analyzing the state or condition of the market so as to determine whether to invest or never to invest as to either make profit or avert risk.
Nevertheless, there are many factors that have contributed to this action of investors,
they includes:
The On-chain Metrics: which is a tool that provides very active and useful information to users such as total transaction, transaction value and number of active users which helps investors in analysing particular assets, of which its most fundamental tools are: transaction values, hash rate, status, active addresses and fees.
Market capitalisation: this is yet another tool for fundamental analysis which offers an approximated value of a coin, and also exposes us to the total volume of the coin in circulation, the value of the coin and some other analysis about the coin which can aid an investor into making or taking a decision on either to invest or not to invest in such a coin or asset.
Some other tools four fundamental analysis include; liquidity and trading volume, Circulating supply, project metrics, background analysis, white paper, competitor comparison, road map, tokenomics and utility etc.
The Concept Of Technical Analysis.
This is a concept that tries to make predictions using certain market psychology, which is based on the ideology that history repeats itself.
This tries to demonstrate that price movements are not always random; rather they try to follow long and short and also down and up movement as the case be.
In conclusion, this tries to emphasize more about what is happening in the market than why it happened as it focuses on the demand and supply of an asset rather than some other variables that contribute or that are more paramount to the cause of a particular trends and prices of the asset in view.
For instance reading of candle charts, understanding of trend lines, mastering trade volume, utilisation of the relative strength index (RSI), choosing of time frames, understanding moving averages etc these are actually some of the things that constitutes technical analysis.
Having understood this concept, let's now dive into the variation that exists between the two of them.
| S/N | Fundamental Analysis | Technical Analysis |
|---|---|---|
| 1. | This type of analysis tries to evaluate the inherent features or values in an asset using different mediums like On-chain Metrics, market capitalization etc. | this normally uses chat tools in determining or analysing the strength and weakness in an asset |
| 2. | This uses quality information about an asset | This uses technical charts, indicators and Volumes in analysis |
| 3. | Users of this analysis are up for investment, possibly long term investment. | This is mainly for the analysis on how to engage in trade to make a long or short term profit. |
| 4. | This uses previous and obtainable future data in it's mood of analysis | This normally uses previous actions in the trend of an asset in making analysis |
| 5. | This takes an absolute view into an asset as to determine its market worth and possibly to determine its profitability if invested in | This analysis tries to investigate price direction and possible support and resistance points, that is, the entry and exit positions in the market. |

2.) Choose one of the following crypto assets and perform a Fundamental Analysis indicating the objective of the Project, Financial Metrics, and On-Chain Metrics.
Cardano (ADA)
Solana (SOL)
Terra (MOON)
Chiliz (CHZ)
Polkadot (DOT)
Polkadot:
This invention was founded by Gavin Wood in 2016, a Co-founder and Chief Technical Officer of Ethereum.
This was built to enable the utilization of web 3.0 network which is a decentralized internet base Blockchain that permits users to gain control over their own data due to the efficiency of the network and security options provided by the platform.
This invention has tried to address the major challenges that is faced by Blockchain technology over the years as it has contributed in inventing toolkits that have aided developers in building their own usable blockchains.
One of its major contributions has been the enablement for diverse blockchains to communicate with each other with shared security and also a plug a play security system that has aided blockchain developers in avoiding wastage of time and resources committed in hiring operators in setting up of a new Blockchain.
Finally, Polkadot is strategizing a system of open governance to reflect the true value of the people which modifies it as a democratic and flexible Blockchain technology and the system utilizes the DOT token as its native currency. During this initial coin offering in 2017, they were able to raise about $140m as the project received a significant figure of one hundred million dollars from two of its private sales
The Objective Of Polkadot
is to connect other chains to itself and provide communication between them. Although ethereum currently is the biggest programmable Blockchain in the cryptocurrency industry but ethereum network hasn't kept up with it's growth since it can upgrade to ethereum 2.0, the system is slow congested and expensive and also it does not work well with other networks so POLKADOT was designed to be fast and with other networks.
Taking a financial analysis of the token:

From the coinmarketcap which is a compendium of its financial analysis, it is identifiable that as of the time of taking this screenshot, the market capitalization of DOT is stipulated at $43.9b, with a fully diluted market cap of $49.1b, and it has traded at the volume of $2.1b, nevertheless the circulating supply had reached 987,579,314.96 DOT, it has a total supply of 1,103,303,471 and currently its price is stipulated at $44.44.

Finally from the screenshot above, the DOT token has since its inception into the market made an all time high of 48.7 according to the chart and although it has not exceeded that limit till date, it is believable that with its current market capitalization, it should trade above that value if it should continue in this weighted trend.
ON CHAIN METRICS ANALYSIS
Polkadot has over number of 1000 transaction per seconds and from the screenshot, it is observable that the token has a high increasing supply due to its high demand in the market.
It was able to record its highest transaction since inception on the 2nd day of May 2021 which is about 953,169 transactions on its network .
3.) Make a purchase from your verified account of at least 10 USD of the currency selected in the previous point. Describe the process. (Show Screenshots).
I will be using my verified account from Binance to illustrate this, so let's go through the process below.

- From the screenshot of my spot wallet above, we can see the available USDT balance on it and I will be using 100% of the balance to make the purchases.
Next, I go to the trade menu box and search for a pair of DOT/USDT, so I click on it since this is actually the asset I wish to purchase as it takes me to the different purchasing options which is; limit option, market, stop limit and ICO option.
So I click on the market, which is used for instant purchase of any asset.
On the market menu, I click on 100% and then click on BUY DOT.
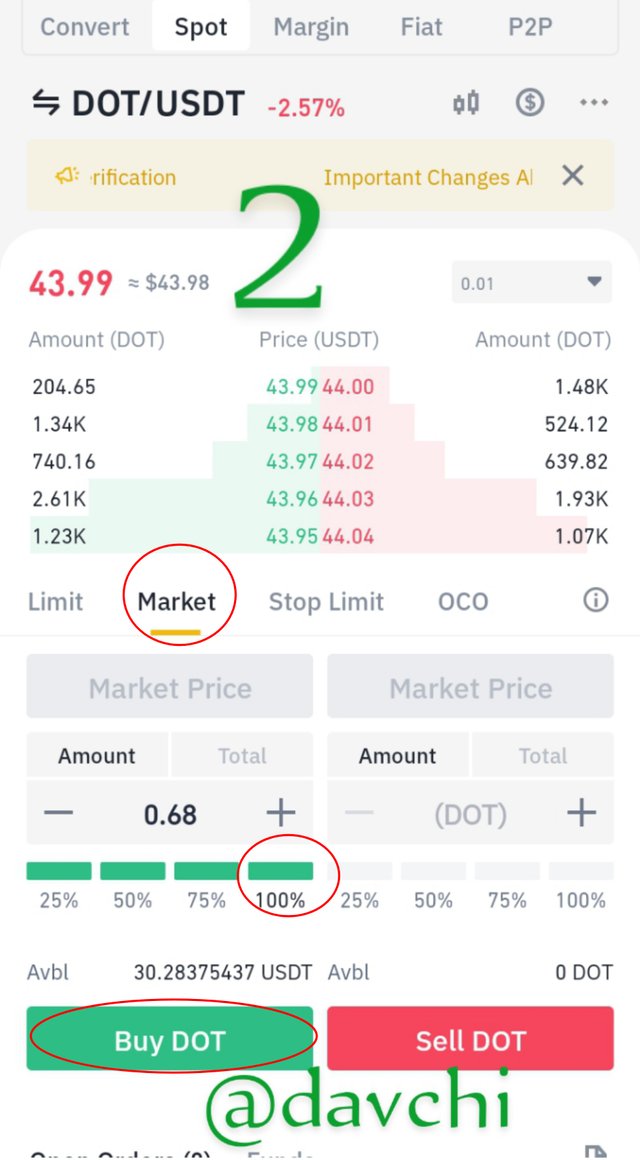
After an instant filling of the order, I then go back to my wallet for a confirmation, and from my wallet below we can see that the order has been filled meaning that with 100% of $30.28 will give me 0.6 worth of DOT.


4.) Apply Fibonacci retracements to the previously selected asset with a 4-hour time frame on the platform of your choice. Observe the evolution of the price at 24 and 48 hours, did it go up or down in value? Look to identify resistance and support levels. (Show Screenshots at 0, 24, and 48 hours of purchase where the date and time are observed).

Taking a 24 hours time frame it is observable that the trend or the price of the dot token against the USDT was in a full beer trend which means that the price went down.
Nevertheless in 24 hours time there was an opening of price at $46 and it is actually closing at $44.34 which means that this is a very strong beer trend

Using a four minute time frame and retracing it within 48-hours, It is observable that the price actually went a bit high and then there was a bear confirmation in the price this chant was the flow chart of the DOT TOKEN on 21st of October 2021
Taking a 48 hours time frame or period of thread there was an opening of price at $42 I'm currently it is closing at 43 dollars, which is an indication that's in the past 48 hours that there is about 1 dollar, increase although there were positions the trend went higher than the stipulated value.
5.) What are Bollinger Bands? How do they apply to Crypto Technical Analysis? With which other tool or indicator do you combine Bollinger Bands to analyze a Crypto? Justify your answer.
Bollinger Bands are defined as volatility bands placed above and below a moving average. Volatility is based on the standard deviation which changes as volatility increases and decreases. The bands suddenly widen when volatility increases and narrow when volatility decreases. The Bollinger Bands can be used to identify MTops and Wbottoms and also the strength of trend. Standard deviation are used to describe the dispersal pattern of a data set. The area between the moving average and each band produces a range or channel. The area above the moving average is the buy channel as prices displayed, prices falling below the moving average are in the sell channel.
HOW IS BOLLINGER BAND APPLIED
Bollinger Bands is made up of three lines, the middle line is the moving average which takes the average of the pervious candle sticks and plots them as a line on the chart. The upper and lower bands are controlled by the standard deviation.
With the concept of Mean Reversion (returning to average) that is waiting for price to stretch out in one direction and looking into a trade expecting it to return to the average.
In a chart when the price is stretching out to the upside then the trader is going to place a sell trade with the expectation that price will move back down and when a price is stretching out to the down side then the trader is going to place a buy trade with the expectation that the price will back up.
RELATIVE STRENGTH INDEX (RSI) is combined with Bollinger Bands to analyze a cryptocurrency. RSI is an oscillating indicator that is designed to determine a cryptocurrency momentum which is both the speed and the size of price changes. RSI is used to determine whether a cryptocurrency is overbrought or oversold and to also to determine the entry and exist signals.

The overbrought refers to when a cryptocurrency that has increased rapidly in a short period of time and may reverse lower. Oversold refers to when a cryptocurrency that has decreased sharply in a short period of time and nay reverse higher.
When the RSI crosses back above the 30,it generate a buy signal and as a potential bullish entry signal. Traders use RSI value above 70 as overbrought when it crosses back below 70 it generate a sell signal and a potential exist signal.
To justify that RSI can be combined with Bollinger Bands to analyze a cryptocurrency
In a chart if price closes outside of the upper bollinger bands then the trader is going to look to place a sell trade then wait for the RSI to hit a level of at least 75 before existing and placing a buy trade and if price closes outside the of the lower bollinger bands then the trader is going to look to place a buy trade then wait for the RSI to hit the extreme level at least 25 before entering and placing a sell trade.
6.) Conclusions
With the idea of fundamental analysis and technical analysis a trader can able to determine the future of demand and supply in cryptocurrency and also determine the movement if price in a chart and I suggest that a trader can apply the principle of fundamental analysis and technical analysis in a trade.
Thanks to prof @imagen
Gracias por participar en la Cuarta Temporada de la Steemit Crypto Academy.
Continua esforzandote, espero seguir corrigiendo tus asignaciones.