Crypto Academy Season 03 - Week 06 | Advanced Course - Trading Liquidity Levels The Right Way
I wish to appreciate Professor @cryptokraze for this week's incredible lecture, here are my take for your questions as partaining to the lecture, thanks.
1 - What is your understanding of the Liquidity Level. Give Examples (Clear Charts Needed)
MY CONCEPT OF LIQUIDITY
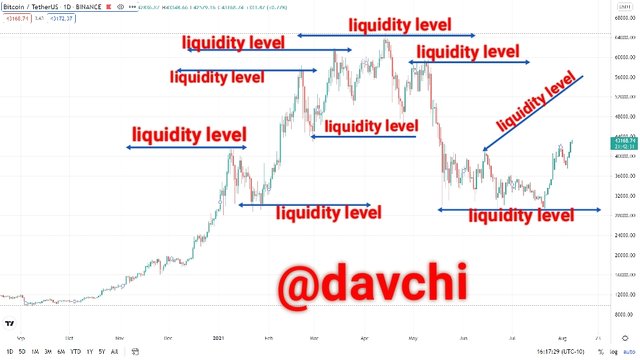
First, the concept of liquidity points is the possibility of easy conversion of ones asset into cash but the focal point isn't about the "cash" but specifically about the keyword "conversion" of ones asset into another asset which a trader intended having.
Therefore, liquidity level or levels in the technical market are those strategic points in the price chart where certain orders of either buyers or sellers are filled or satisfied at intermittent intervals. So they are positions where liquidity is provided to fill market orders of traders.
Nevertheless, these levels can also be as a result of the volatility of the asset in trade, which does not really call for consistency of such market trend after providing liquidity to traders at those respective levels.
These levels are often spotted with speedy reversal of price charts, which is an indication that they are not consistent market trends.
They are also spotted with hammer-like positions in the case of candle charts which could either be at high or low points as against the congruency of the price chart.

2 - Explain the reasons why traders got trapped in Fakeouts. Provide at least 2 charts showing clear fakeout.
There are several reasons why traders are trapped in fakeouts, which are but not limited to these:
FAKEOUTS IN AN UP-TREND AFTER ENTRY POSITION
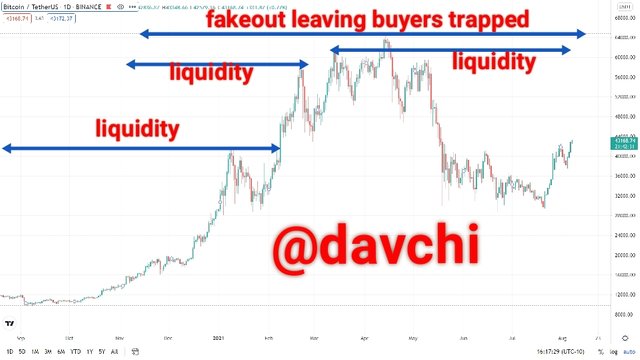
1- CONTINUOUS PRICE INCREASE:
We all know that buyers normally enters the market when asset prices are low and contrary to this, they also enter the market when there is an indication of market break or BRB that is using this strategy. Nevertheless buyers are trapped in fakeouts because they intended that the price chart will continue in their proposed or supposed direction.
2- DEFICIENT KNOWLEDGE OF CERTAIN MARKET INDICATORS:
Since the technical market is not a place a trader can thrive without perfect knowledge of workability using certain indicators, many buyers who lacks these technical knowledge are normally trapped in fakeouts for improper or imperfect use of indicators.
3- VERY HIGH SET PROFIT POSITIONS OR ORDERS:
It is also obvious that most traders are on the norms disposed to greed irrationally, so many buyers that entered the market goes too high in setting their take profit or liquidity position of which if not filled due to market fakeout, the only option left of them is the stop loss position.
4- LONG TIME TRADING POSITION:
we have seen scenarios where most traders prefer to go on long time trades normally one day, a week or a month trading position and on the cause of this long trading position, they are trapped since in market fakeout since they have no closer speculation and scrutiny of the market trend.
FAKEOUTS IN THE CASE OF SELLERS IN A POSITION TO BUY OR IN A DOWN TREND AFTER EXIT POINT
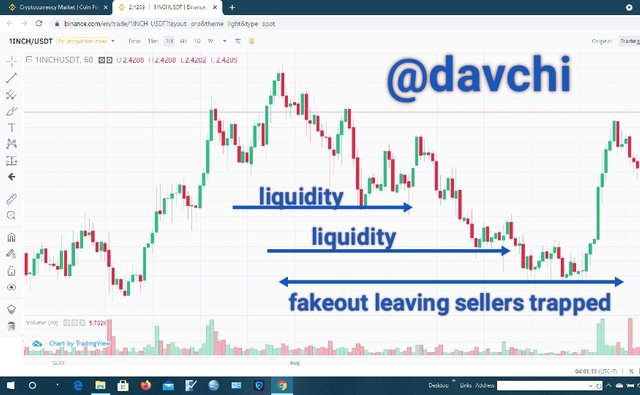
1- VERY LOW MARKET ORDER:
We will agree to the fact that sellers are traders who are exiting or about exiting the market after some profit positions or when the market trend goes against their prediction.
so most sellers are trapped after they have made their sales and are now set for a buy order which they may set at a very low positions which may not be filled. so for this case they are faced with fakeout although this does not have an intense malignant effect on them as they can also buy at the current market price.
2- IMPROPER USE OF MARKET INDICATORS:
most traders on their buy orders after sales do not properly use the market indicators which could have guided them to know whether the market trend will continue in a down state as to possibly get their orders filled but on the contrary due to this improper use of indicators, they are trapped in fakeouts whereby they couldn't get the least possible liquidity that could have filled their orders.
3- LONG TIME TRADING POSITION:
This situation of of long time trade have been the Achilles's heel of many traders. Nevertheless most traders that are in the entry position after sales are faced with fakeout because of lack of closer examination of their trade orders as a result of long time trading position.
4- GREED:
This normally happen to most traders as they would want to make the least possible price purchases of their intended asset and on the cause of this, they will set their buy orders in a very unattainable and doubtable low position which may ensue a fakeout position of their trade.
3 - How you can trade the Liquidity Levels the right way? Write the trade criteria for Liquidity Levels Trading (Clear Charts Needed)
Now let's go through the process of trading the liquidity levels appropriately.
I believe that with the familiarity and knowledge of MSB and BRB strategy one can conveniently trade different intervals of liquidity levels the right way in the market.
I will illustrate these positions using the buy and sell positions below and more specifically, I will be using the BRB for this illustration because this strategy provides a higher level of liquidity and also helps in trading with precision and accuracy because after the BRB strategic trading levels in buy and sell positions, the market has to make it highest high and lowest low points as to fill big investors orders and also the orders of some retail traders after which it reverses.
**TRADING LIQUIDITY IN MARKET ENTRY BUT SPECIFICALLY TO MAKE THE HIGHEST SELL OR FILLED LIQUIDITY POSITION **
1- The current market position should get to the resistance level of the previous trend and this point should be marked.
2 - Next is to wait for the current price to break the resistance point of the former trend and then make a swing high position indicating a clear break.
3 - Next is for the current price to retest the resistance level or point and then move up again for a clear up-trend.
4 - Now at this point, the current price should break the recent swing high level to validate the market break.
5 - finally, we are set for the highest high position where we can have our orders filled with a very high liquidity stake.
It is obvious that this is the criteria for a buy position but my emphasis is not to place a buy order but rather to vividly identify with clarity and truism that this trend is accurately in an obvious uptrend where I can place the highest liquidity order favourably with a high sense of precision.
Nevertheless, it is very expedient to set a stop loss as I earlier stated against facing a fakeout and on the contrary, it is more important to watch the price very closely and possibly using a short time frame like one and half hour or two hours precisely because this is actually your investment which must be treated with high level of concern and care
TRADING LIQUIDITY AT SELL POSITION BUT SPECIFICALLY TO BUY OR HAVE YOUR ORDERS FILLED FAVOURABLY AT A VERY LOW POINT
I would also prefer to use the BRB strategy in illustrating this because of its exquisite function in filling orders at high and low positions but at this point, it would be on grounds of a buy order
1-First the market should be encroaching a support level and there you should mark the level.
2 - Next is to wait for the price to break in tangent with the support level and make a swing low level.
3 - Next price should retest the support level and start moving down again for a clear down trend.
4 - At this point, the price should break the current swing low point to creat a valid price break.
5 - At this point, we are set for a buy order at a very minima liquidity level as possible, next is to set a stop loss which is very Paramount in every trade which must not be too low as to skunk the possibility of entering a fakeout position.
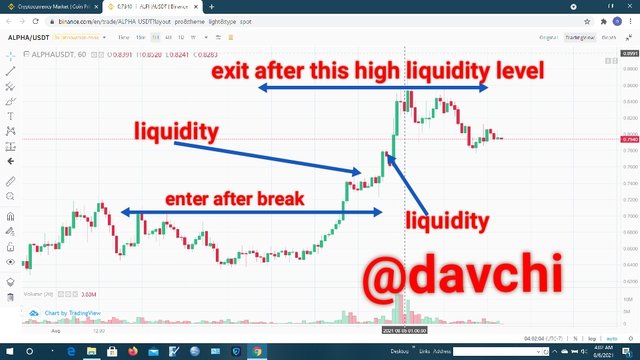
4 - Draw Liquidity levels trade setups on 4 Crypto Assets (Clear Charts Needed)
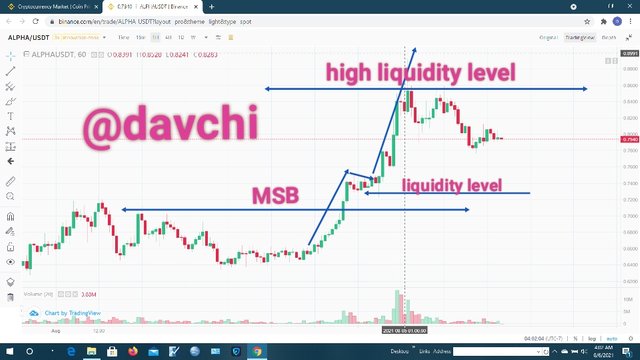
showing liquidity set-up into market entry using MSB on ALPHA/USDT
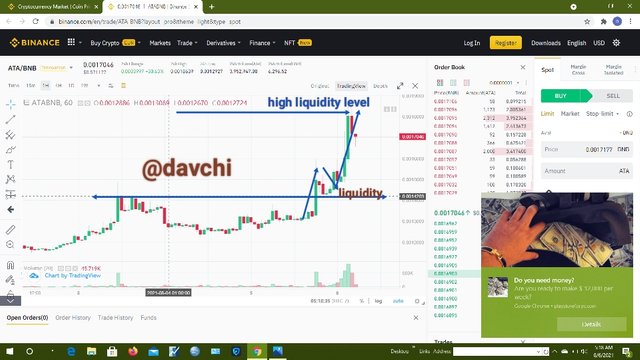
setting up liquidity level using BRB strategy in an entry position with ATA/BNB
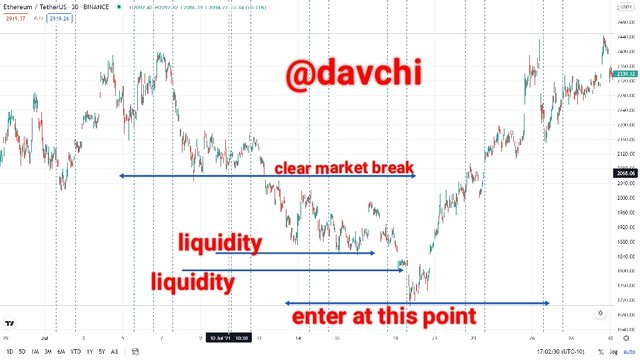
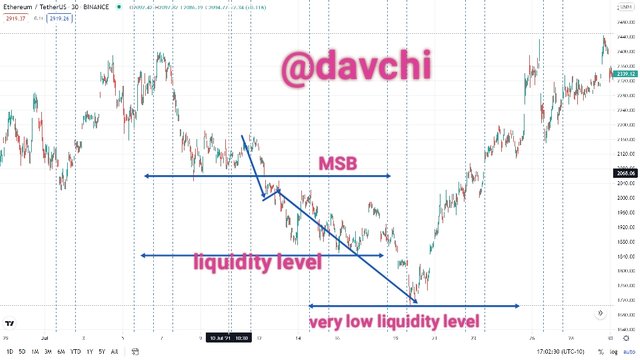
liquidity levels in a down-trend using ethereum/tetherUS
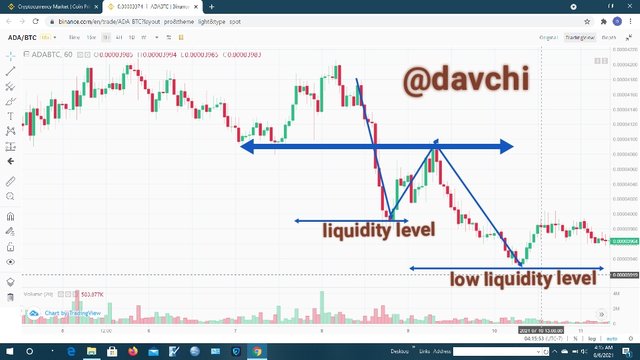
liquidity level set-up using BRB in a down trend on ADA/BTC
liquidity levels in a down-trend using ethereum/tetherUS
liquidity levels in a down-trend using ethereum/tetherUS
The liquidity levels in trade are actually points that every trader should pay proper attention to using well certified trading strategy like MSB and BRB and some other credible indicators like the MACD and RSI against fakeouts.
On the other hand, it will be expedient if traders should trade using short time frame as to be able to easily and closely monitor their trades still against falling victim to price fakeout.
Finally I would also encourage that in the case of long time trades, traders should set their positions of stoploss and take profit because of the tedious nature associated with trade monitoring as to skunk this issue of price fakeout.
I wish to state that all screenshots were taken and edited by me as I got them from trading view and binance exchange. Thanks for going through.
Cc: @cryptokraze