Crypto Academy Season 03 - Week 03 | Advanced Course - Break Retest Break (BRB) Strategy to Trade Continuation cryptokraze (71)Professor[Advanced]in SteemitCryptoAcademy • 6 days ago (edited)
First I must appreciate professor @cryptokraze for this week's incredible lecture on BRB strategy which has a very high positive effect on individual trading dynamic if properly utilized.
I'm grateful being a part of this class and below are my answers as pertaining to my comprehension of your questions.
My Concept of Break Retest Break Strategy
This is a concept that does not actually obey the fundamentals of support and resistance points on the norms. Nevertheless as every average trader believes that at a spotted resistance level, the market is under compulsion to go on the reversal of bear trend and on the contrary, when the market trend hits the support level, the trend is bent to go on the opposite direction of a bull trend.
So this concept is not actually in consonance with the hit support and reverse or get to resistance and reverse levels. On the other hand, I will be expanciating this concept using a few claims of break retest break at the support and resistance levels as it does not adhere to the normal support and resistance concept of market trend.
BRB AT RESISTANCE LEVEL:
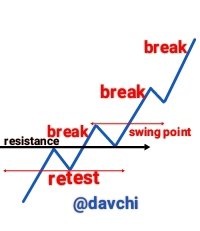
This is a bull market senario where the market trend tends to reverse at hitting the resistant level but pushes up against it's reversal continuously untill it gets to its final and elastic point where it could no longer push the market structure upwards as it takes the reverse of its trend as seen in the figure above.
BRB AT SUPPORT LEVEL:
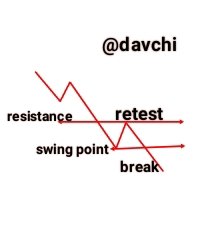
This is another market senario where the market trend intermittently breaks through the reversal of a support level in a bearish trend continuously untill it could stretch no further as it finally reverses. This could be viewed from the figure above.
Nevertheless, let's also locate these different trends using crypto assets for a better clarification at BRB on resistance and support levels.
** BRB AT RESISTANCE TREND**:
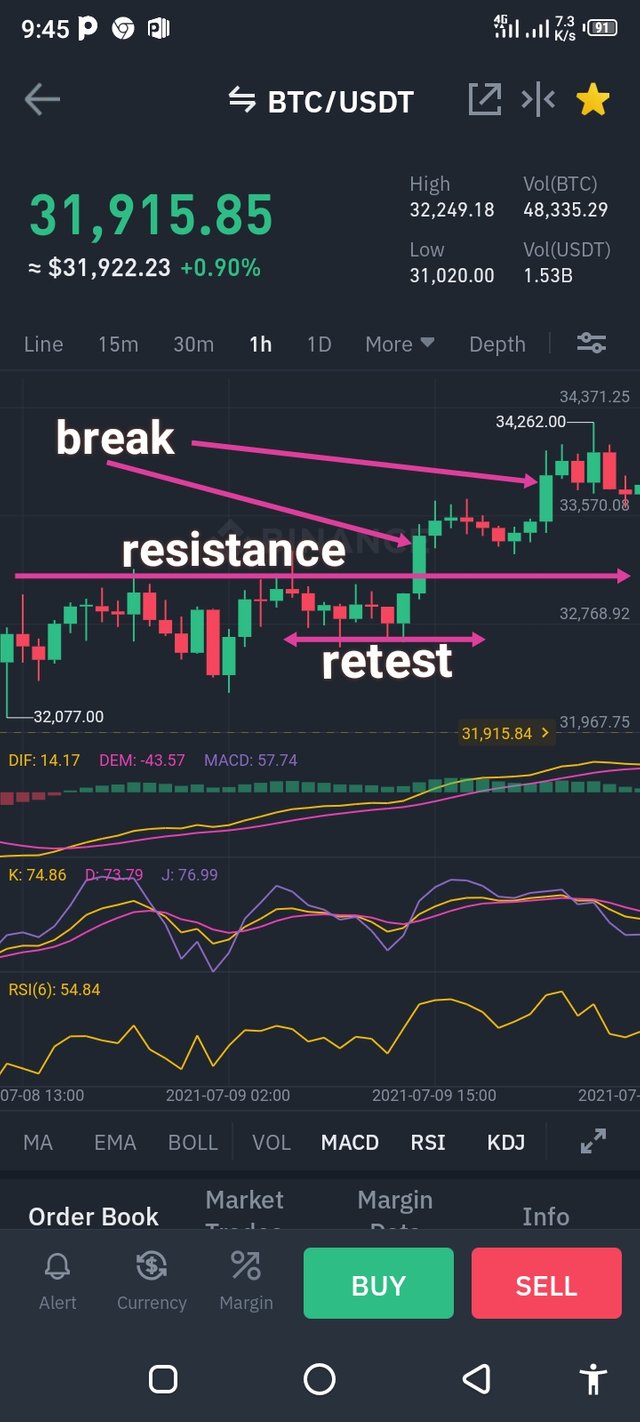
On like the illustration I gave above, using my sketch, we can also see the same scenario with the price chart of Bitcoin to USDT where the price of BTC seemed to have hit a strong resistant point but still, it swinged back and then break the very support level as it surges in a bull trend again.
BSB AT SUPPORT LEVEL:

This is another scenario of the subject matter where there is also a price break in a Bear trend as the price of BTC keeps hitting different support levels, resurges and takes a steeper bear trend which is normally against our basic concept of support level ideology.

Important Levels to Trade BRB Strategy using The Buy and Sell Scenarios
This is actually a very critical point in the SBS strategy an hence I wish to first identify the very strategic points where a trader can cautiously place a very favourable trade using this strategy.
BRB AT BUY LEVEL
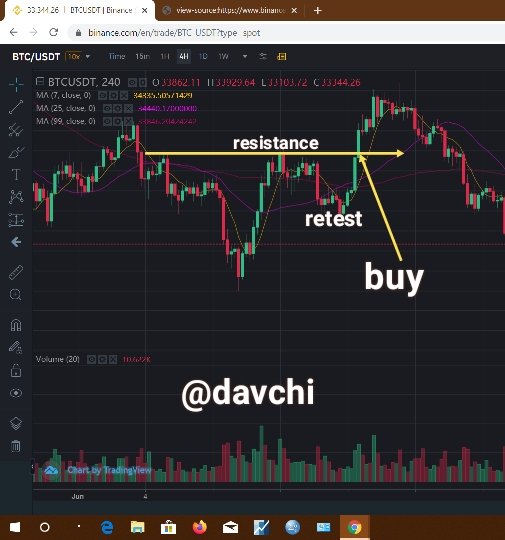
Now let's go through this illustration of BTC to USDT at the buy level. Here it's obvious that the price of BTC broke out and hitting the resistance level, it retraced and then pulled up again.
BRB AT SELL LEVEL
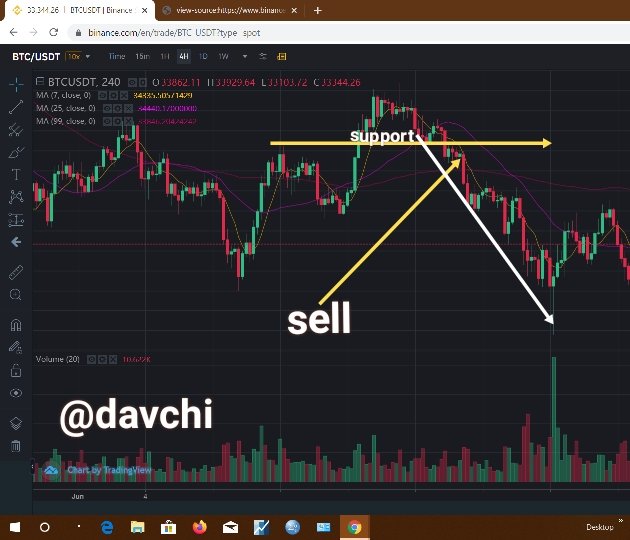
RBS at the sell level using the same pair of crypto we can also see the level of support and which later swinged back and then took it's break again
Trade Entry and Exit criteria for Buy and Sell Positions.
ENTRY CRITERIA FOR A BUY TRADE
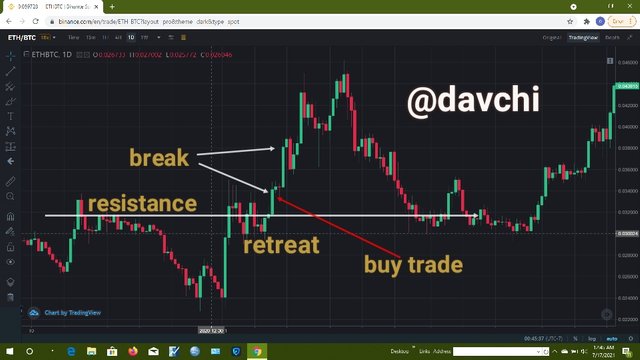
These are the criteria for trade entry even as explained by professor @cryptokraze which I will be explaining simultaneously with my chart
1- mark the level at which the market tries approaching the resistance level and this is obvious in the chart above
2- The next level is for the price to break through the resistance level which the chart actually did and later made a swing bull point
3- The next point is for the price to make a retest of the resistant point which the chart above also made and then took an up-trend
4- Next is for the chart to break the recent swing which the chart also did that validated it's break
5- The last point in this regard is to place my order which I also positioned after the break of the swing.
EXIT CRITERIA FOR A BUY TRADE
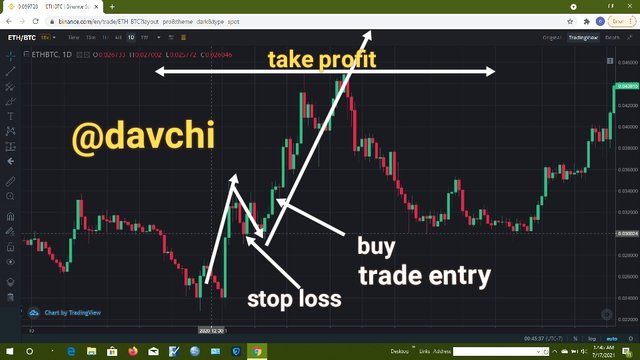
1 - We should set a Stop Loss Level in case our trade goes in the wrong direction after entry.
2-First is to set a stop loss against unwanted trend position which I actually set in the chart above that is below the resistant level at which price broke out.
3- In this regard, a break out of price above my stop loss level automatically invalidates this trade and hence stop loss is an essential strategy in this setting.
4- Next is to set a take profit level if fortunately the trend was able to go as predicted and it should be at 1:1 level and finally if price chart hits this level, the trade automatically sells by itself at the desired take profit level.
ENTRY CRITERIA FOR A SELL TRADE
-First is to mark the area where the market price tries to approach the support level and as the price breaks through the support position and made a swing and also retested the support area, as it break the current swing low position to validate the break outlay, this is actually a clear point of sell entry which must be below the break of the swing position.
I believe that all these positions are very obvious in the chart above which validates this criteria
EXIT CRITERIA FOR A SELL TRADE
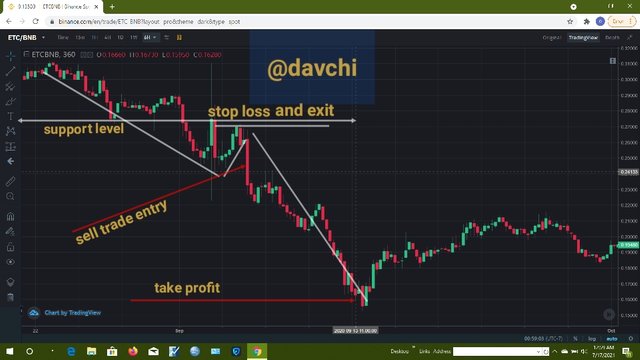
First is to set a stop loss against the trade taking an opposite trend contrary to our position and this should be at the level of price breakout above the market support level. Even as seen in the chart above.
Set risk reward ratio to 1:1 meaning that stop loss must equal take profit ratio level.
Let's now demonstrate this using the demo account. This is actually a demo trade I got from Olymp trade
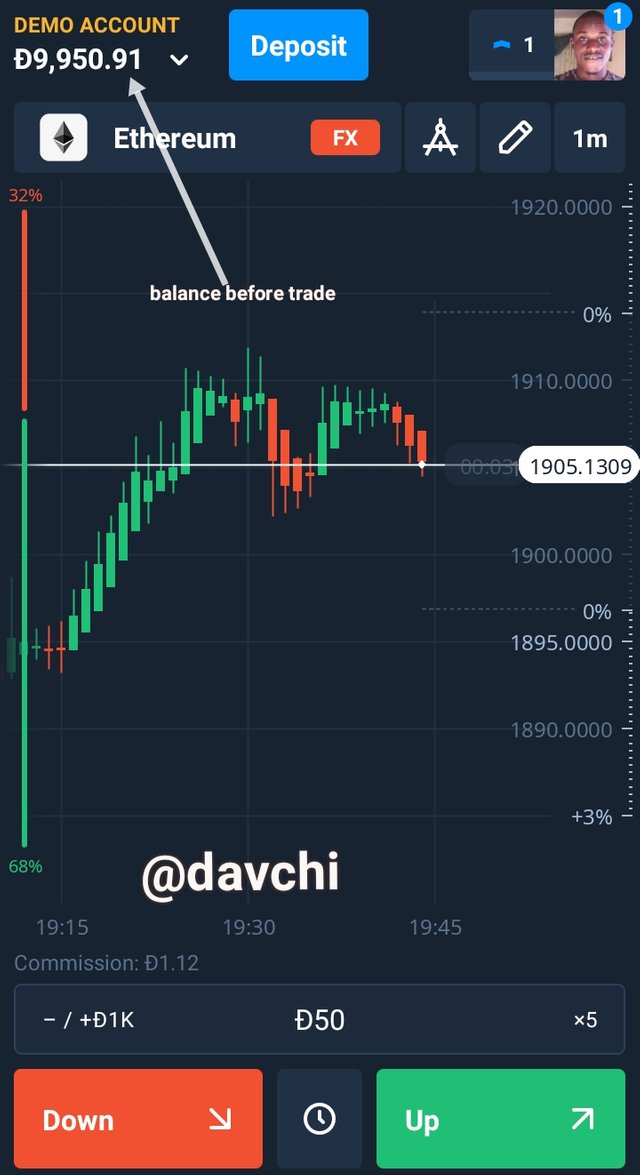
PLACING A DEMO SELL TRADE
Here you can see my ETH balance at 1950.91
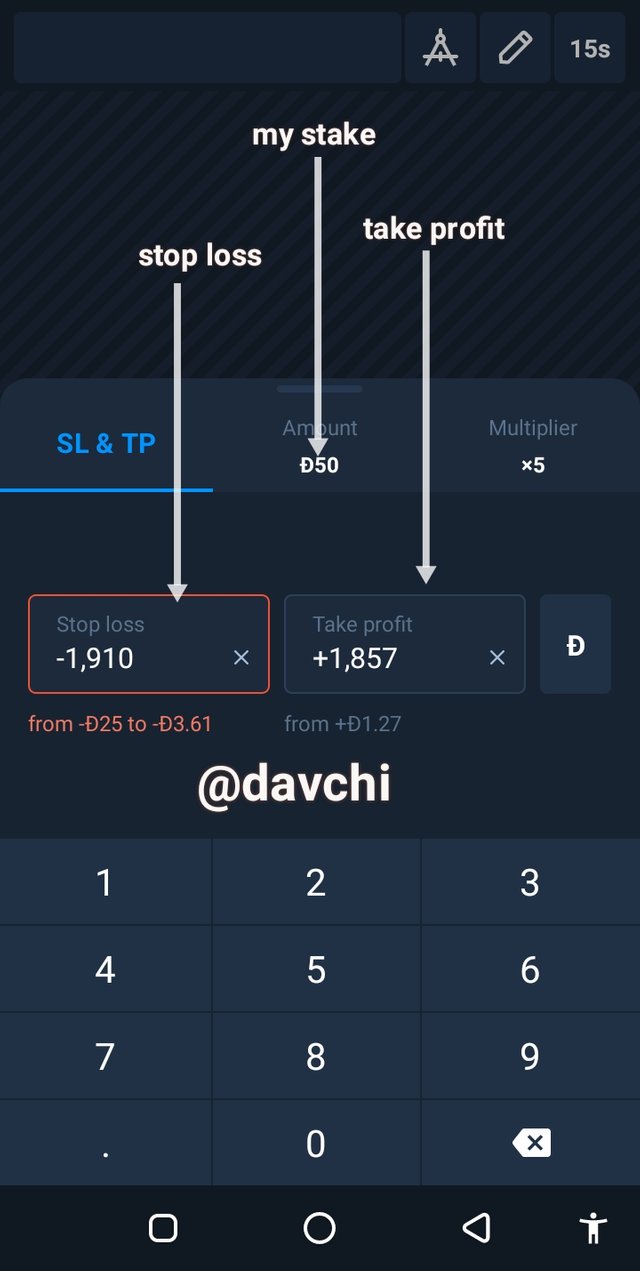
This is my stop loss position set at 1,910 the take profit is also set at 1,857 and I strike at price 50.
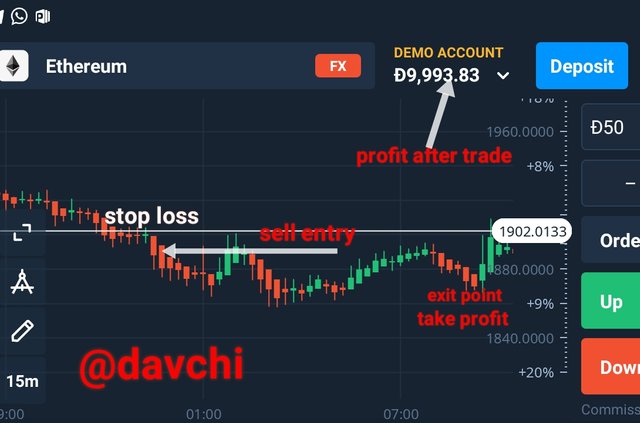
finally this is the profit I made after trade
BUY EXIT POSITION USING THE DEMO
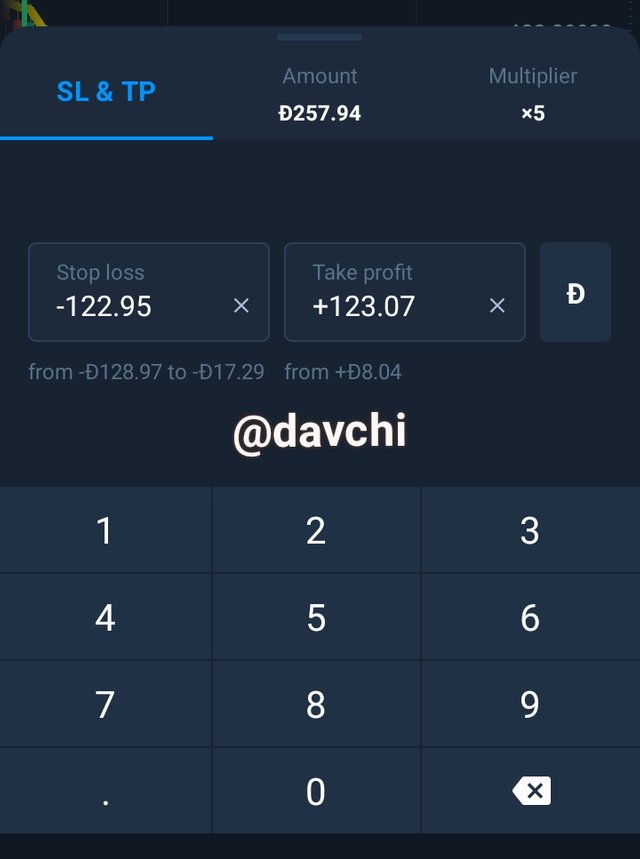
This is my account value before going for a buy trade using LTC
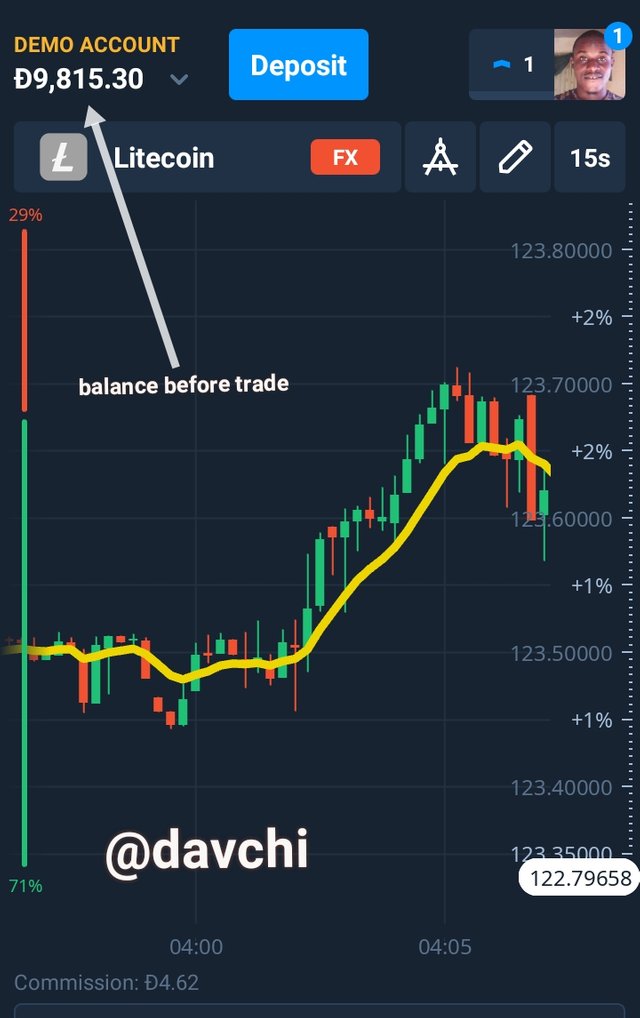
next, I set my take profit and stop loss at 123.07 and 122.95 respectively
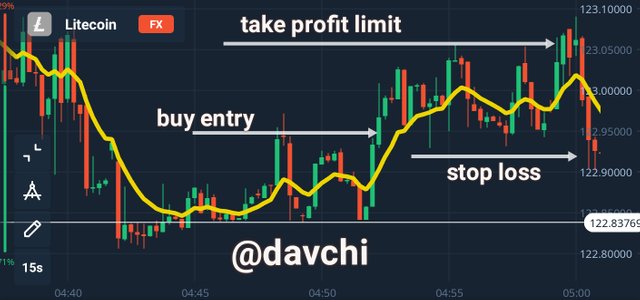
Then I set into trade at this trade position that I marked, but I exited the market after a while without because the time frame for this demo is very lengthy and even at chosing a short time frame, it will not still buy or sell at that point. so that was why exited without getting to their full hour time.
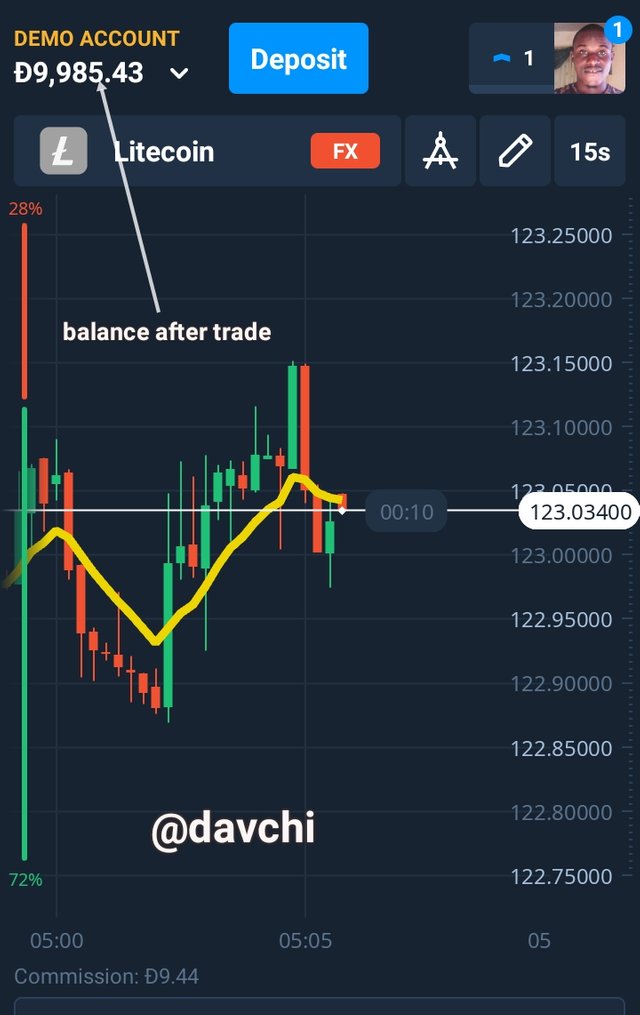
Finally, this is my account value after trade.
I must also appreciate professor @cryptokraze for such an incredible lecture as this and how he has put me on the line through another strategy that is high proficient in making a reasonable profit in the real technical market.
I still wish to add that I have deployed this strategy on the binance and it worked perfectly although it's not actually easy to work with this concept using most brokers but I must say that this strategy is confidentially proficient in any buy or sell positions in the market. Thanks.
cc: @cryptokraze