Crypto Academy / S5W3- Homework Post for @reminiscence01
Hello Friends, I'm excited to participate in today's academy homework and I'm grateful to Professor @reminiscence01 for such an incredible lecture.

1 a) Explain your Understanding of Trend Reversal. What is the benefit of identifying reversal patterns in the Market?
b) How can a fake reversal signal be avoided in the market? (Screenshot needed).
There are two reversal scenarios in the virtual market system which are the bear reversal and the bull reversal and these spots are very delicate points that have to be properly traded with against trading in a direction that has already elapsed. In this regard it is very paramount to trade using a well acquainted Indicator to easily identify these market points in the technical market, nevertheless let's examine the two reversal points in the market.
This is a market scenario where the market structure fails to break above the previous retracement and also the current higher high point and this is contingent upon many criteria and as such we may acclaim that the momentum exerted by sellers are greater than the buying pressure at the moment and we may also state that the trend has reached its elapsing period since there is no perpetual trend in the virtual market.
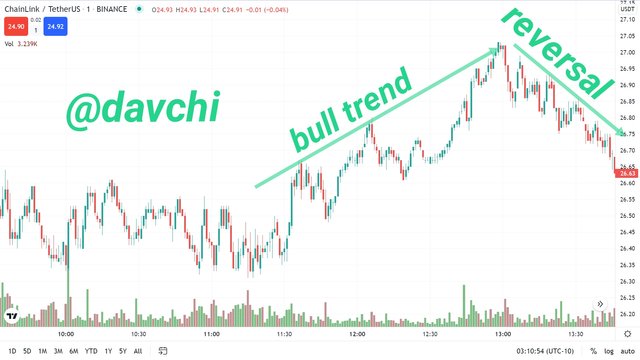
Using the crypto pairs of LINK/USDT above, we can see the reversal made by the current bull market which is an indication of a higher selling pressure due to the increment in price.
This is also a market scenario where a particular down trend has made its final bear trend by hitting a support level in the market and then reverses up as such we may presume that there is depreciation in the selling pressure as buyers dominate the market.
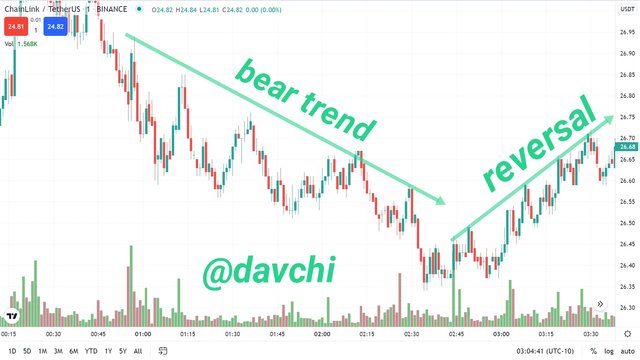
Also from the LINK/USDT chart above we can observe how a serious downtrend later reverses to an up-trend in confirmation that there is no precise perpetual trend in the market as a bull trend is followed by a bear trend while the exit of a bear market introduces the bull market vice versa.
2 Give a detailed explanation on the following Trend reversal identification and back up your explanation using the original chart. Do this for both bullish and bearish trends (Screenshots required).
a) Break of market structure.
b) Break of Trendline.
c) Divergence
d) Double top and Double bottom
Market structure break is a market scenario where the price chart forms an obvious price directional shift by creating a price shift above the current higher high or lower low positions as this is observed both in an up and downtrend market scenario.
This is a market formation where the current price chart creates a momentum swing above the previous higher high position while trending in the bull side of the market
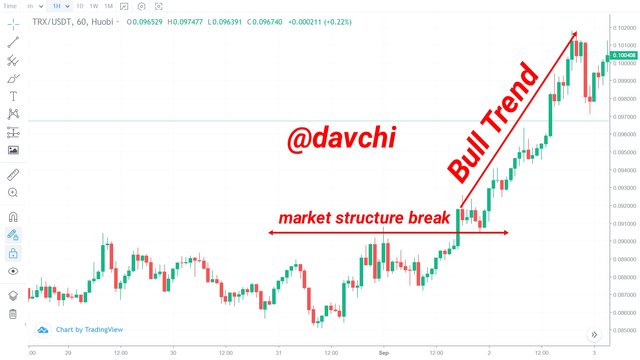
From the TRX USDT chart above, the market structure was able to create a strong momentum swing which created a breakout in the BTC price thereby confirming the market structure breakout in a Bull market.
This is a market scenario where the current price chart creates a strong momentum swing far below the previous lower low position to maintain a serious downtrend.
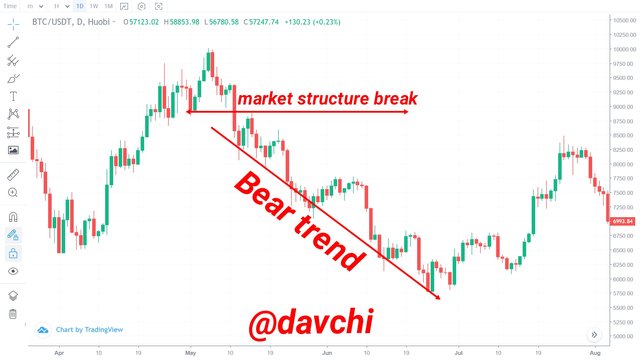
Using the BTC USDT chart above we can see the break of market structure in the Bear market after the price chart hit the resistance point and took off to the bear market, it was able to break off from the normal swing to consolidate a strong downtrend.
Break of trend line in a technical market is a true indication of price changes either to the bull or to the bear as the case may be and this helps in taking necessary trade actions against trading in an overdue market trend and we can observe this in the following market scenarios.
This is a market scenario where a trending bull market that has kept it's sequence against intermittent retracements and pullbacks does not have enabling momentum to keep to the Bull trend any longer as it takes a Bear reversal due to sell pressure.
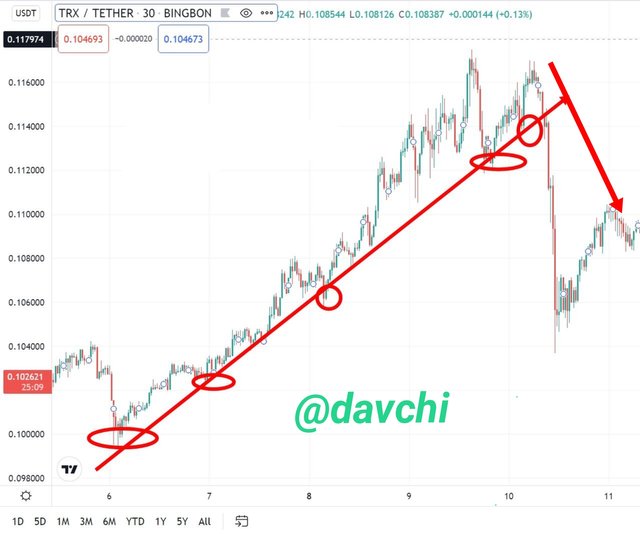
Using the TRX/USDT chart above it is observable that using the trend line, there was a cut off of the bull trend as the market plunges into a bear market to confirm the validity and exit of the TRX asset from trendline.
This is another market scenario where the current bear trend could not persist in it's direction due to a heavy buy pressure as the market further plunges into an uptrend.
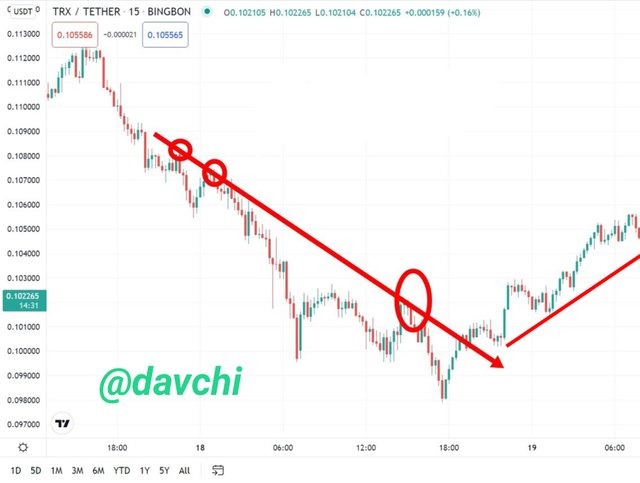
To confirm the concept of the break in trendline, the TRX/USDT chart above has a clear view of the logic behind the break of trendline in a Bear market and it is obvious that after the market has got to the climax of the bear market, it was able to cut off from the trend line to confirm an exit from the bear market.
Divergence in the market may be as a result of indicator deficient or possibly that a market prevailing trend is at the peak of diverting to an opposite trend as opposed to the currently viewed trend and this could be observed in both the Bull and the Bear trend but not without an indicator as an ordinary price chart can not indicate divergence in itself.
This occurs in an indicator when the price chart is in a bear spot while the indicator is in the Bull side which is actually a discordance of the Indicator and the price chart at the moment.
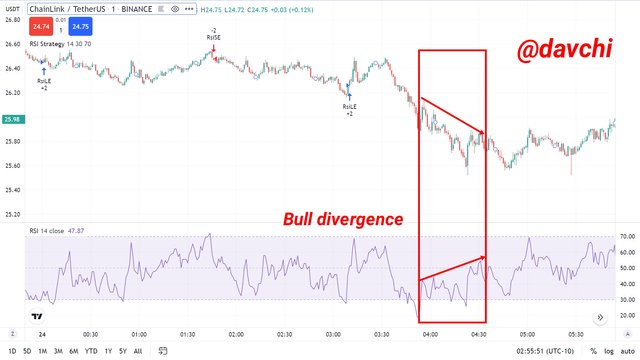
Using the LINK USDT chart above, we can confirm the Bull divergence from the chart as the RSI indicator makes a Bull move while the price chart is actually taking a bear trend before diverting to a true bull trend as the indicator corrected and confirmed the real direction of the market.
this is also a market scenario where an indicator in use takes an opposite direction against the trend of the price chart to probably launch a true but opposite trend direction as against the currently viewed trend of the price chart.
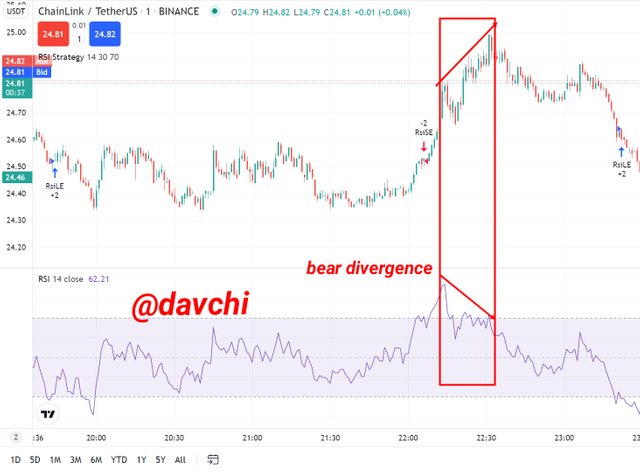
from the LINK/USDT chart above, we can confirm the divergence using the rsi indicator as the price chart was taking a bull trend, the indicator on the other hand was in a bear position although this was later corrected by both tools.
This concept in the technical market is a real scenario that is formed in an extreme high position in a bull market which also signals an impending Bearish reversal and this can also be seen to be a resistant point of price consolidation from the view of a possible downtrend.
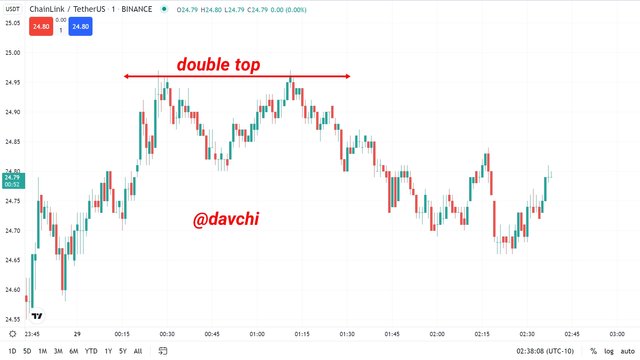
Using the LINK/USDT chart above, the two spots are indicated and we can also observe that after the double top positions, the market now plunged into a serious downtrend to confirm the concept that double top usually ushers in a downtrend.
Unlike the double top scenario, the double bottom suggests two valid bottom positions in the technical market that are formed at the lowered density of the price chart after a short and obvious uptrend demarcating the two bottom points and these double bottom may subsequently usher in a Bullish reversal.
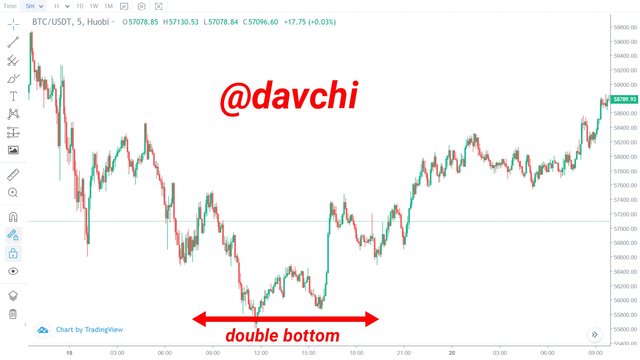
From the BTC USDT chart above, we can see the double bottom scenario and this further consolidate that most double bottom scenarios is followed by an uptrend and more so from the screenshot we can also confirm as the BTC price observed a serious bear trend to the point the double bottom was formed there after a strong Bull market sets in.
3 place a demo trade using any crypto trading platform and enter a buy or sell position using any of the above mentioned trend reversal/continuation pattern.
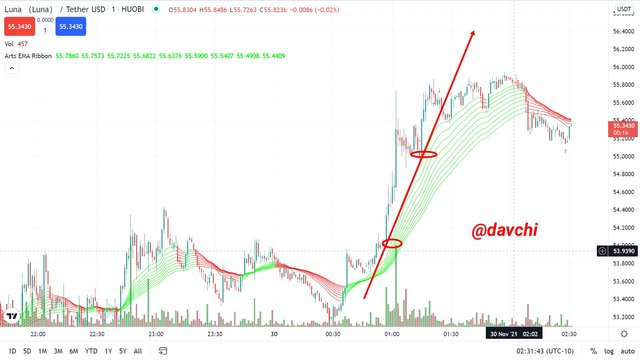
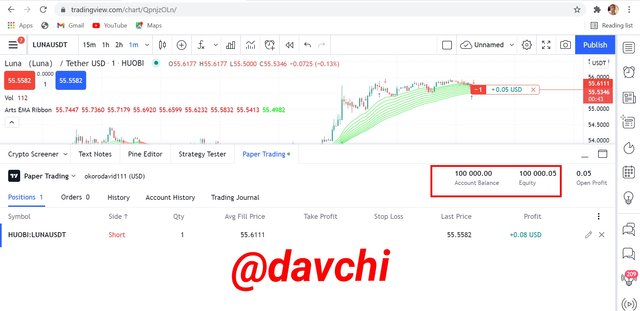
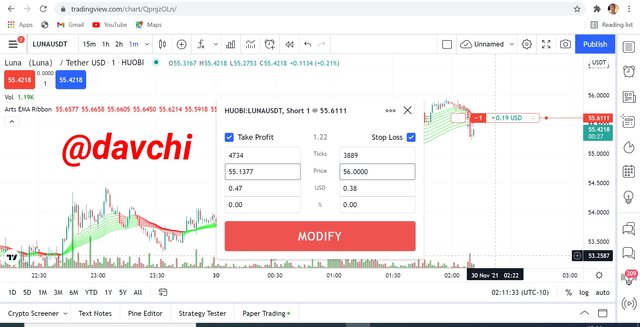
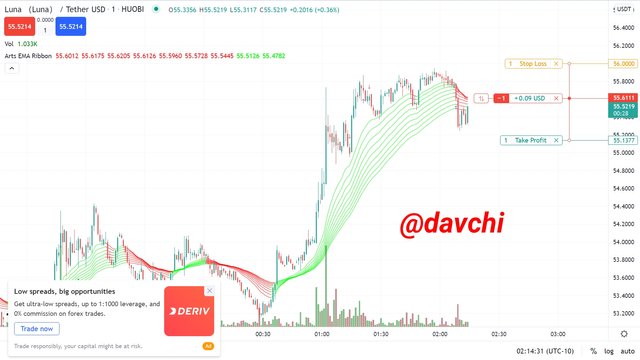
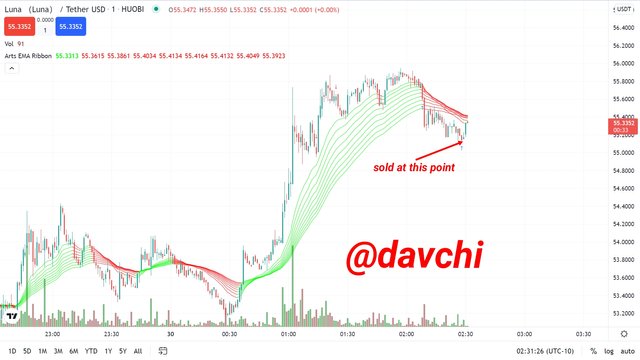
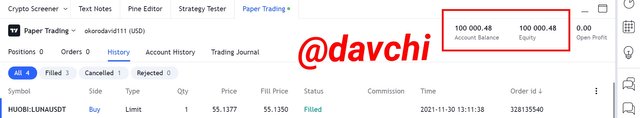
For this I will be trading the LUNA/USDT for a bear trend reversal and below are the procedures.
First at signalling the phasing out of the current LUNA Bull trend, I entered the market for a short sale trade option.
Source
Source
Source
Source
Source
https://www.tradingview.com/chart/
The crypto candle chart is one of the market tools that helps in determining the probable trend of the market despite the volatility caused by crypto assets. On the other hand, the use of Indicators will actually guide in taking rational steps as to easily determine the possible market trend using it's signals while minimizing risks due to uncertainties.
Cc: @reminiscence01
Hello @davchi , I’m glad you participated in the 3rd week Season 5 of the Beginner’s class at the Steemit Crypto Academy. Your grades in this task are as follows:
Observations:
What do you mean by virtual market?
Recommendation / Feedback:
Thank you for participating in this homework task.
Thanks Prof for you incredible remark on my post.
please I call on @steemcurator02 to check on my post as it will be expiring in 2hrs time thanks for your incredible assistance.