Crypto Academy / S5W1- Homework Post for @reminiscence01".

Greetings friends, it's actually my pleasure in participating in this season's academy lectures. My appreciation goes to professor @reminiscence01 and all the steemit bloggers who were able to make it to this session's academy lectures.

- a) What do you understand by a Trending market?
b) What is a bullish and a bearish trend? (screenshot required)
A trending market is a market scenario where there is an obvious trend which is normally caused by the prevalent force of either demand or supply without biasedness of positions. That is the trend must be in the bull or possibly in the bear at the moment.
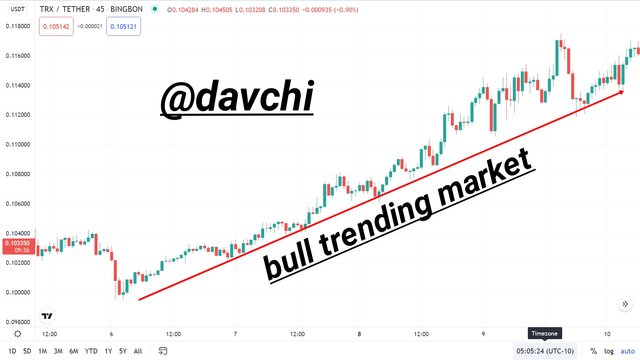
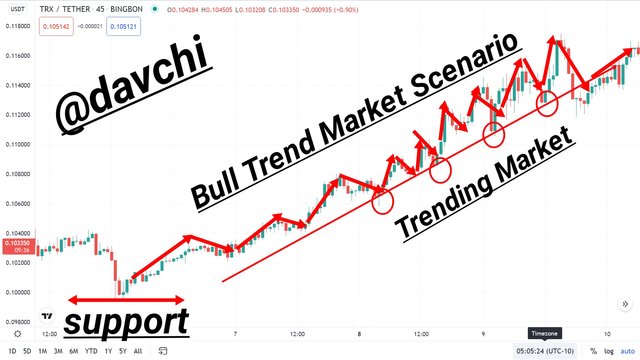
For instance, the trending market below could be observed as a bull trending market.

A bullish trend is a market scenario where the prevailing position is in an upwards direction or in other words, in an uptrend. and from the screenshot below we can confirm this using the TRX/TUSDarket below.
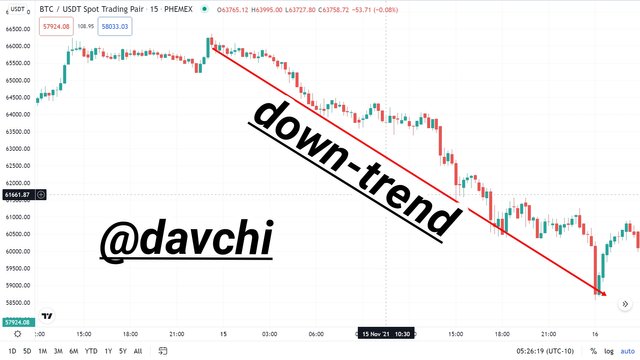
A bear trend on the other hand is a particular market position where the prevailing movement made by the asset price in the candle charts are in a serious downwards position, and this can be confirmed using the BTC/USDT chart below.
2 Explain the following trend identification and give an example of each of them. (Original screenshot needed from your chart). Do this for a bullish and a bearish trend.
i) Market Structure.
ii) Trendlines
This is a market scenario where there is a prevalent trend In the market at the moment this could either be in the bull, bear or perhaps in the range direction.
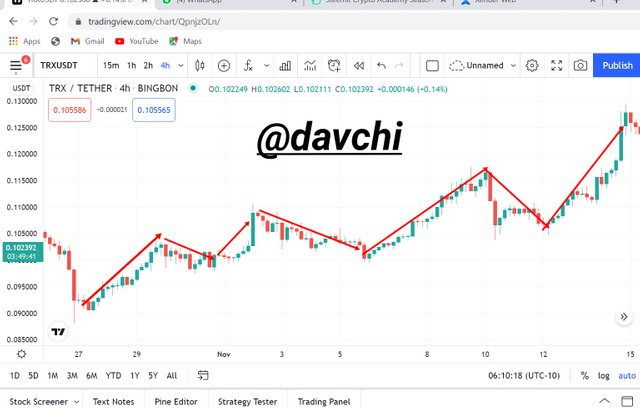
This kind of market structure is a position caused by a more buyers pressure over sellers and this is identified as a situation where there is a continuous higher highs and the subsequent high position closes higher than the previous high level confirming a true Bull market. Nevertheless we can confirm the Bull market from the TRX/TUSD screenshot above.
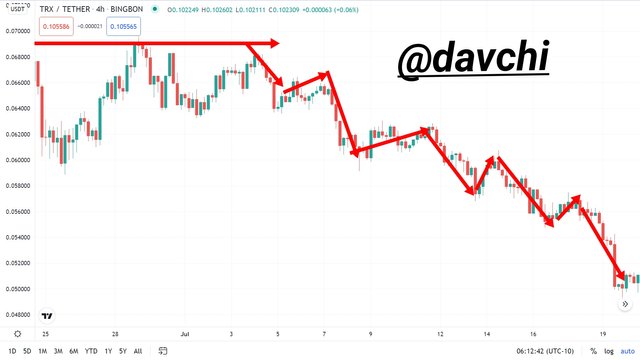
The bear market structure is also a trending market situation where the prevailing trend is in a continuous downtrend. In this scenario, the current low position closes below the previous low candle chart or position in the market. From the TRX/USDT screenshot above we can confirm the bear market structure.
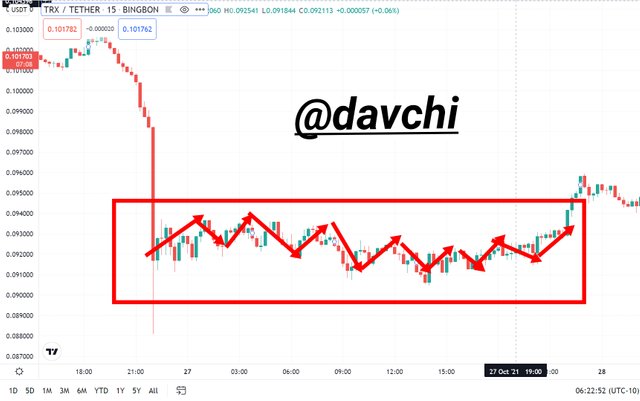
This kind of market structure is a situation in the market where there is a range of resistance and support levels but without a possible and obvious market direction or trend. In this market scenario a trader cannot be able to dictate whether the next position or trend of the market will either be in the bull or in the bear without the assistance of certain market indicators. Finally using the TRX/USDT screenshot above we can still confirm the range movement of the TRX/USDT.
These are strategic positions in the crypto market that help traders in identifying possible market directions till such a trend gets invalidated and this could either be used by the Bull or the Bear market.
A Bull Trend Lines
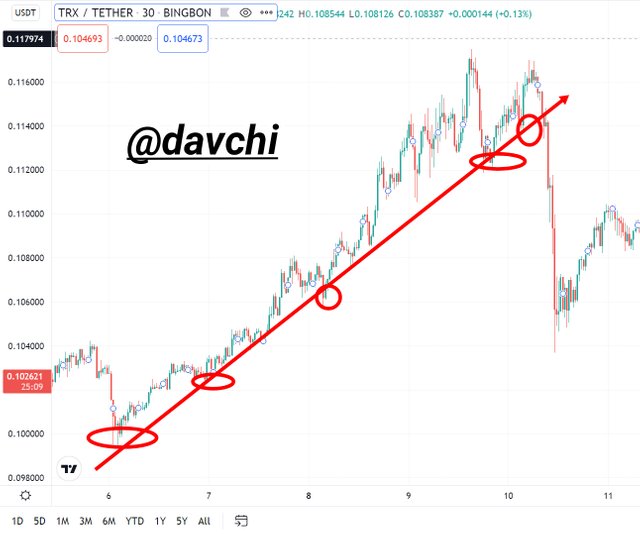
A Bull Trend line is a technical line used in identifying the possible trend position of an uptrend and also it's probable terminal point.
In applying this strategy for instance, a trader needs to stick close to the pull back of positions made while the trend is still on the bull until the observed trend reaches its possible elapsing period. The Bull trend line can also be confirmed through the TRX/USDT chart above.
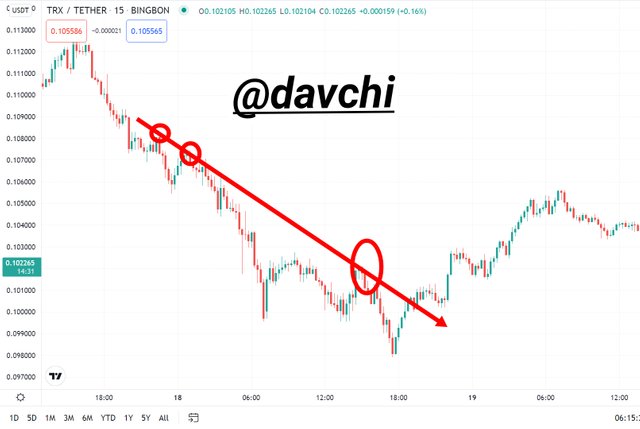
In the Bear trend line for instance, the trend moves in an obvious bear position while major concentration should be based on the pull up resistance points until the trend comes to its final position to signal the invalidity of its continuity. The Bear trend line can also be confirmed through the TRX/USDT chart above.
3 Explain trend continuation and how to spot them using market structure and trendlines. (Screenshot needed). Do this for both bullish and bearish trends.
Trade continuation can be seen as a market scenario where the market structure either in the Bear or in the Bull breaks, retraces and breaks higher or lower from the previous heights. So let's see this scenario in the Bull and in the Bear trend.
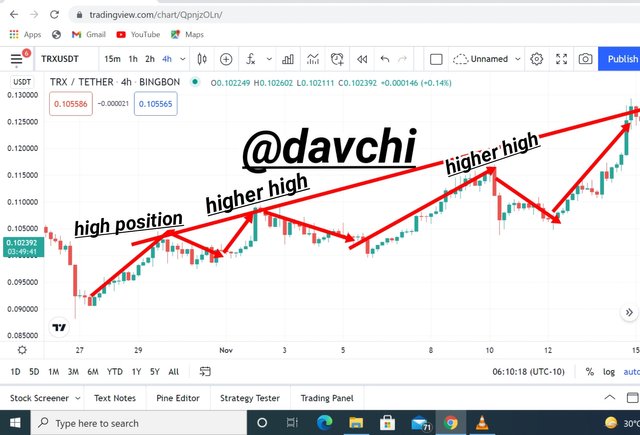
In this market scenario, the bull market breaks and keeps forming higher highs from previous high levels till the trend is completed as this is obvious in the TRX/USDT chart above.
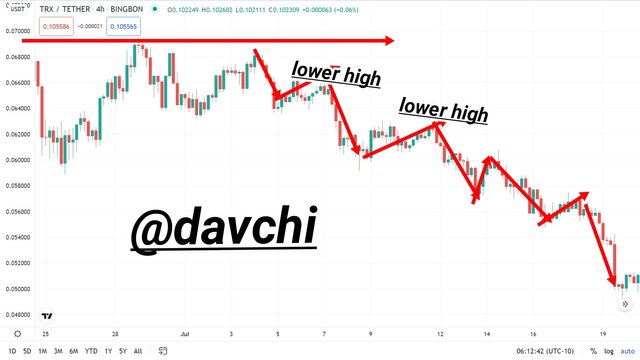
In this market condition, the market price breaks and retraces from the lower high positions till it's trend reaches the final support level and this can also be confirmed in the TRX/USDT chart above.
4 Pick up any crypto-asset chart and answer the following questions -
i) Is the market trending?
ii) What is the current market trend? (Use the chart to back up your answers).
Using the TRX/USDT chart above, it is obvious that this is a trending market in the Bull direction which is as a result of a more buy pressure prevalent in this market.
In every market scenario, there is always an obvious trend or movement prevalent at the moment and this could be a Bull, Bear or possibly a range market.
Understanding chart movements may not be easy but it can aid one in gaining great trading potentials.
Finally It is also wise to insert good indicators into one's trade if anyone wishes to trade as mere charts may not produce an obviously true trend signal needed to maximize returns from trades, thanks.
Cc: @reminiscence01
Hello @davchi, I’m glad you participated in the 1st week Season 5 of the Beginner’s class at the Steemit Crypto Academy. Your grades in this task are as follows:
Observations:
Trend continuation you mean.
Recommendation / Feedback:
Thanks, for submitting your homework task.