Metric Indicators - Crypto Academy / S5W2 - Homework post for pelon53
Hello everyone, this is my homework post for @pelon53. This week, we learnt about metric indicators. You can check out this link to the lecture. I learnt a lot and I hope you learn something from my post.

1.- Indicate the current value of the Puell Multiple Indicator of Bitcoin. Perform a technical analysis of the LTC using the Puell Multiple, show screenshots and indicate possible market entries and exits.
Puell Multiple Indicator

The Puell Multiple indicator was invented by David Puell in March 2019. This indicator is focused on the analysis of the supply of BTC and how it affects the market cycle.
Bitcoin supply is through mining. Those involved in mining Bitcoin are called miners. The miners are responsible for performing complex calculations to add blocks to the Bitcoin Blockchain. Upon the success of completing the calculations first, the miner receives an amount of BTC as a reward for adding the next block.
Mining requires strong computational power. Miners spend a lot of resources to attain the computational power needed for the mining operation.
From the Puell perspective, these miners are required to sell their BTC at some point to be able to provide the resources necessary for the mining operation. The Puell multiple indicates when prices are high which signals a possible sell operation by miners. It also indicates low prices which shows a good time for investors to perform buy operations.
When miners perform sell operations, the effect can be likened to that of a whale. This is because they sell in large volumes which affects the price movement of BTC significantly.
The Puell Multiple indicator works by calculating the daily supply value of bitcoins in USD divided by the 365-day moving average of daily supply value. The image below is the Puell multiple indicator of Bitcoin.
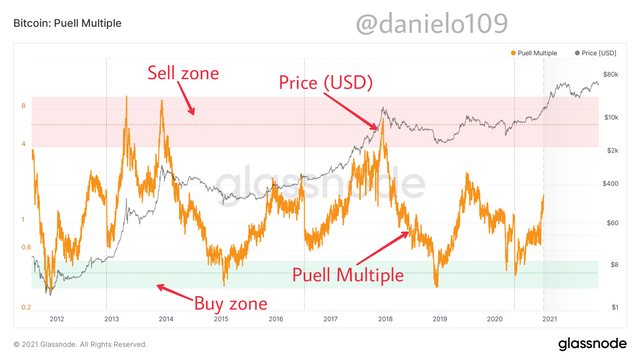
The Puell Multiple has a scale from 0.1 to 10. From the scale, there is a green and red zone. The green zone starts from 0.1 to 0.5 and it shows a good time to buy. The red zone signals a sell. It starts from 4 to 10 on the scale.
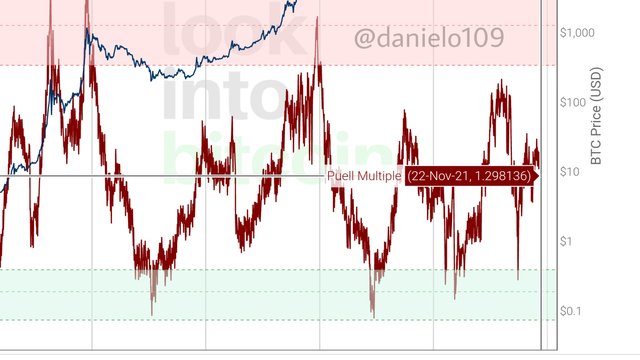
What is the current value of the Puell Multiple Indicator of Bitcoin?
At the time of writing this assignment, the date was 22nd November 2021. The value of the Puell Multiple of Bitcoin at the time was 1.298136. You can see that from the image below.
Puell Multiple of Litecoin
The image below shows the Litecoin Puell Multiple.
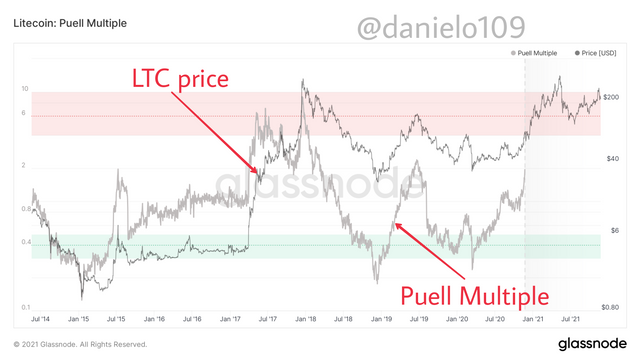
From the image, you can notice a similar correlation of the price of LTC with the Puell Multiple. An increase in the Puell multiple causes an increase in the price of LTC and a decrease in the Puell Multiple causes a fall in the price of LTC.
Earlier, I talked about the green and red zones in the Puell Multiple chart. These zones can be used as levels or entry points. Let's take a look at the image below.
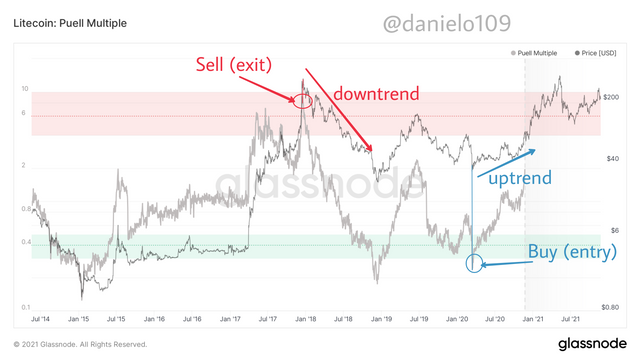
From the image above, I have indicated a strong entry and exit point. You can see that with the entry point, the Puell multiple was in the green zone. This signalled a buy. The market was still in a downtrend upon reaching the green zone and so the best thing to do was to wait for the asset to find support and make an entry upon the reversal of the trend. You can see that the trend after the entry point is an uptrend. The exit for this point can be when the Puell multiple gets to the red zone or once you notice a reversal of the trend. This is because there are times a reversal occurs without the Puell multiple reaching the other zone.
For the sell/exit point this point can be used to take a short position. At the same time, traders who bought before the Puell multiple reached the red zone can make their exits. When you take a short position you can exit when the Puell Multiple reaches the green zone or once you notice a reversal in the trend.
2.- Explain in your own words what Halving is, how important Halving is and what are the next reward values that miners will have. When would the last Halving be? Regarding Bitcoin
What is Halving?
Halving is simply an event where the rewards for mining or adding a block to the Blockchain is reduced by half. Bitcoin halving occurs after every 210,000 blocks which take about four years. It takes approximately 10 minutes to mine a block on Bitcoin.
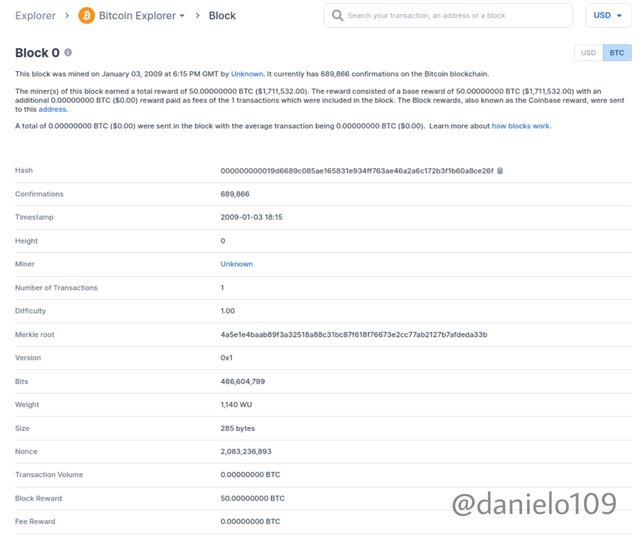
In 2009 when the first block was mined, the block reward was 50 BTC. You can see that from the image below which shows Bitcoins genesis block.
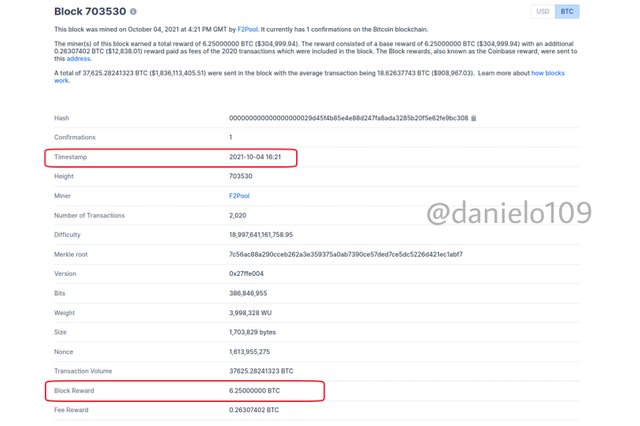
After 12 years the mining rewards has decreased to 6.25. You can see this from a block mined this year. The timestamp is 2021-10-04 16:21.
Bitcoin halving has occurred 3 times. The recent one which reduced the rewards from 12.5 to 6.25 BTC occurred on May 11, 2020. The first halving reduced the mining rewards from 50 to 25 BTC. The second halving reduced the block rewards from 25 to 12.5 BTC. The next halving would reduce the mining rewards from 6.25 to 3.125 BTC. This is expected to happen between February and June 2024. As stated earlier, each halving occurs after 210,000 blocks.
The max supply of BTC is 21 million. Out of the 21 million about 90% is in circulation or have been mined. Bitcoin halving would continue until all the total supply is mined out. This is expected in 2140.
What is the importance of Halving?
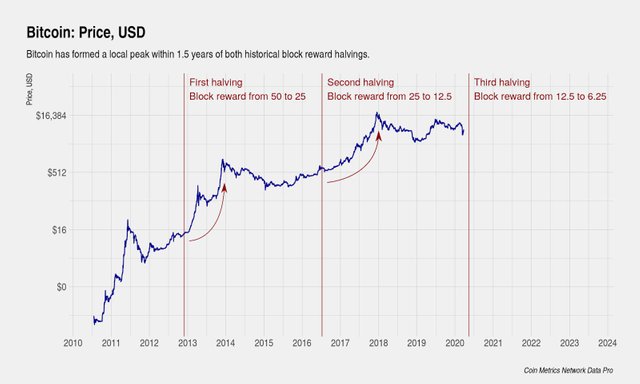
From the Bitcoin halving chat, you can notice that after every halving, there is an increase in the price of Bitcoin.
What happens after halving is that the supply of Bitcoin reduces. In economics, it's simple to understand how this causes an effect on the market. As we all know, a decrease in the supply of goods results in an increase in demand. And relatively, an increase in demand causes a price increase.
With the supply of BTC divided, the demand grows explosively. Bitcoin as the first cryptocurrency has the interest of everybody and is used by most people. When the supply reduces it causes the price to increase.
The importance of halving is that it increases the price value and integrity of Bitcoin.
3.- Analyze the Hash Rate indicator, using Ethereum. Indicate the current value of the Hash Rate. Show screenshots.
Hash Rate Indicator
The Proof of Work (PoW) consensus mechanism is what secures the Blockchain network and ensures decentralisation. This mechanism was the first consensus algorithm to be used on Blockchain networks. Later on, other mechanisms such as Proof of Stake, Delegated Proof of Stake and others were adopted to ensure consensus on Blockchain networks and provide solutions to the disadvantages of Proof of work.
Proof of work requires the use of equipment with strong computational power to be able to mine and validate blocks. Miners perform a series of complex calculations within the shortest possible time to be able to mine blocks on the network.
The Hash Rate indicator measures the average number of hashes produced by miners every second. Its value is estimated, thus it is not accurate.
How does this work?
Blockchain networks use cryptographic and hash functions. The Proof of work consensus mechanism uses a hash function called SHA-256. The miners perform complex calculations to solve the puzzle using the SHA-256 hashes.
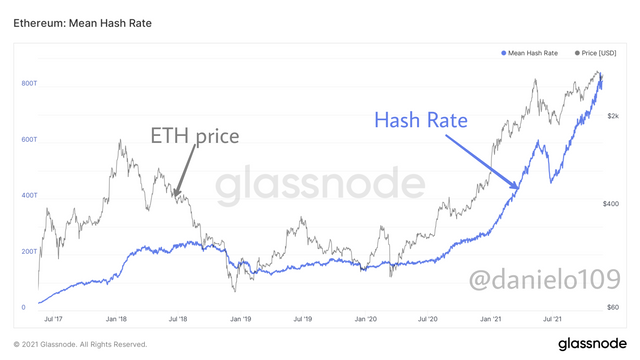
The Hash Rate indicator calculates the estimated number of hashes produced and forms a chart. Below is the Hash rate indicator of ETH.
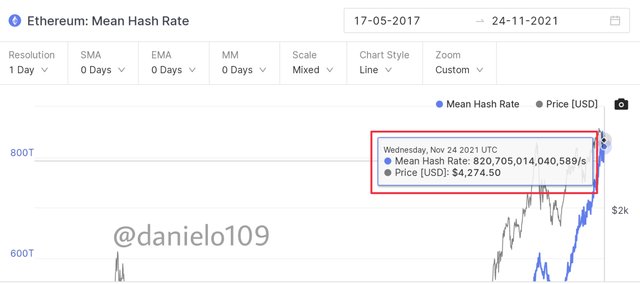
On November 24th 2021, the Hash rate of ETH was 820,705,014,040,589/s. You can check the Hash Rate from the image below.
There's is a correlation between the price of ETH and that of the Hash Rate indicator. The correlation became stronger in 2017. At that time the popularity of cryptocurrencies had increased and it lead to an increase in miners.
This increased the competition of solving the Proof of Work puzzle to mine blocks. This in turn increased the hash rate. As the hash rate increases, the mining difficulty increases as well. The image below shows the correlation between the ETH price and hash rate.
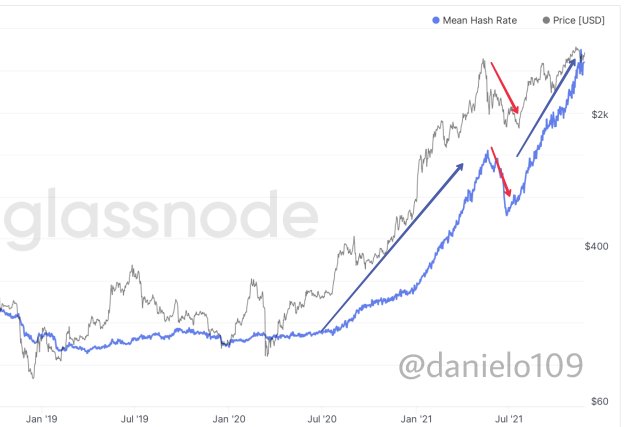
As you can see, an increase in the hash rate leads to an increase in the price of ETH. From the image above, you can see the uptrend in both curves on the chart which has been indicated with the purple arrow.
Conversely, a decrease in the hash rate also results in a decrease in the price of ETH. This was indicated with the red arrows. One of the reasons for the hash rate decrease was China's ban on mining. Miners had to relocate to other countries to be able to mine. This caused a decrease for a short while. As you can see currently, the hash rate is back up after the decrease and even more than it was initially before the decrease.
This shows that more miners have gotten into the mining of the asset.
4.- Calculate the current Stock to flow model. Explain what should happen in the next Halving with the Stock to Flow. Calculate the Stock to flow model for that date, taking into account that the miners' reward is reduced by half. Show screenshots. Regarding Bitcoin.
Stock to Flow Model
The Stock to Flow model is based on the assumption that scarcity affects the price of a good or commodity. The more scarce a good becomes the more expensive it is. This is similar to the supply of a good. A low supply makes a good scarce and that increases the demand which causes a price rise.
This model applies to Bitcoin. Just like the way mining of gold and other minerals cost a lot and have a limited supply, so does Bitcoin. Bitcoin as already stated has a max supply of 21 million BTC. Mining Bitcoin is also very expensive and the supply reduces gradually with the Halving event.
The current stock to flow model is calculated using the formula:
SF = Stock / Flow
Stock refers to the circulating supply and the flow is the annual production.
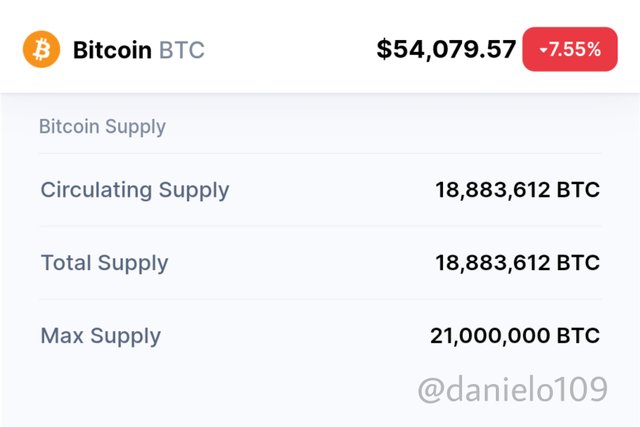
On 26th November 2021 at 12:48 UTC, the circulating supply of BTC was 18,883,612 BTC.
The flow can be calculated by multiplying the reward produced per block by the number of blocks mined per year. This will be 6.25 * 52,560.
The Flow= 328,500 BTC
SF= 18,883,612 ÷ 328,500
SF= 57.48
Having the value of SF, the indicator line can be calculated with the formula: 0.4 * SF ^ 3 which will give you the value of the stock to flow model.
Stock to Flow model= 0.4 * 57.48 ^ 3
Stock to Flow model= 75,964.43 BTC.
What will happen in the next Halving with Stock to Flow
The next halving is going to reduce the block reward for mining BTC from 6.25 to 3.125 BTC. This is going to reduce the supply of Bitcoin and make it even more scarce.
With this, Bitcoin is expected to rise in price. The stock to flow model is also expected to be greater than it is currently.
Let's calculate the value of the Stock to Flow model for that date.
We first need the value of the circulating supply for that date. This can be gotten by multiplying the block rewards by the number of blocks for every 4 years till that date.
That will be: (50 * 210,000) + (25 * 210,100) + (12.5 * 210,100) + (6.25 * 210,000)
The circulating supply will be= 19,687,500 BTC.
Therefore the Stock will be= 19,687,500 BTC.
The flow will be: 3.125 * 52,560
Flow= 164,250
The SF for the date will be = 19,687,500 ÷ 164,250
SF= 119.86
Now let's calculate the Stock to Flow model.
Stock to Flow model= 0.4 * 119.86 ^ 3
Stock to Flow model= 688,783.62 BTC
Therefore the stock to flow model for that date will be 688,783.62 BTC. Currently, the stock to flow model is 75,964.43 BTC. You can notice the stock to flow model has increased a lot per the calculations for the next halving. With this, the stock to flow model is expected to rise within the next halving. You can see that from the image below.
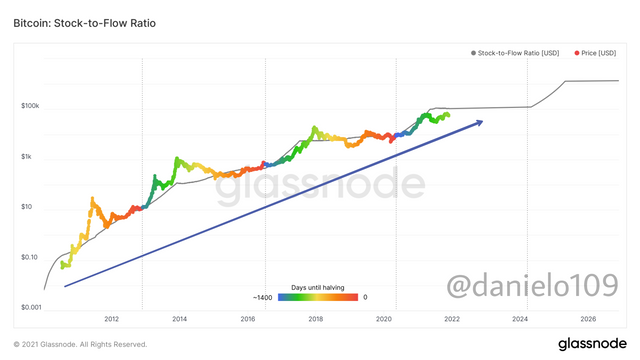
From the chart above you can notice the increase in the stock to flow model after every halving.
Conclusion
The metric indicators are very useful tools for making analyses to perform trades. From the information above you can notice a correlation between the metric indicators and the price of the asset. Understanding how to use them can make them very powerful tools for trading. For traders interested in investing or buying and holding for long periods, they can always use the metric indicators. Currently, there's a buy signal given by the Puell Multiple of Bitcoin.
The halving event is a very good mechanism that keeps the price of an asset stable and on the rise. From the stock to flow analysis you can see how that affects the price of an asset. Bitcoin was created to save the financial system with decentralisation and peer to peer exchanges. Unlike fiat, it has a maximum supply. This makes it scarce and allows the stock to flow model to be applicable to it.
I would like to thank @pelon53 for this interesting lecture. I really learnt a lot and added the indicators to my arsenal.