Crypto Academy Week 12 - Homework Post for @kouba01
Hello Professor @kouba01, thanks for the awesome lecture on trading with RSI. I'm much grateful for this opportunity to learn much from you. Would head straight to my homework.
Relative Strength Index(RSI)
RSI = 100 - 100 / (1 + RS)
where, RS(Relative Strength)= average positive change within n-time /average negative change within n-time
Can RSI be Trusted?
How to configure RSI indicator on a Chart
You can sign up on TradingView or other technical analysis platforms to use RSI indicator. I'd be using trading view.
Steps involved:
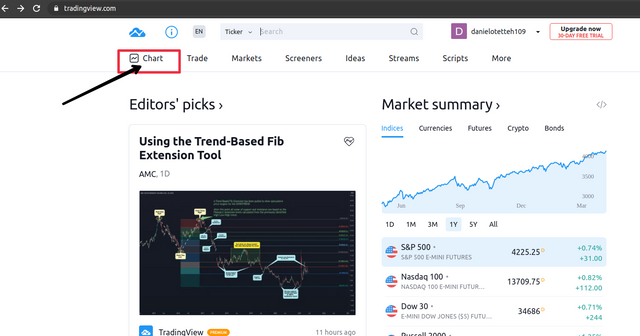
- Select charts at the homepage and select the cryptocurrency you want to view from your watchlist.
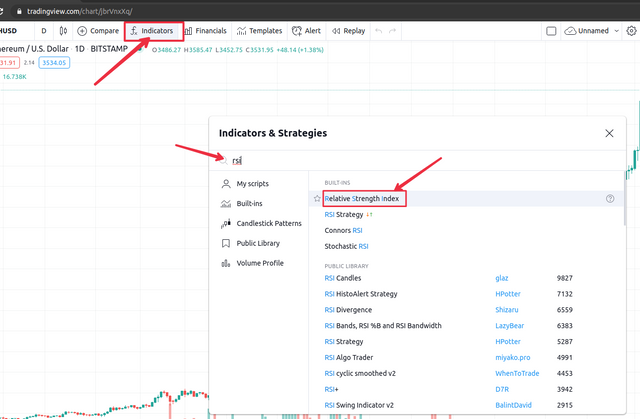
- Click on the fx indicators.
- Enter "rsi" in the search and select Relative Strength index.
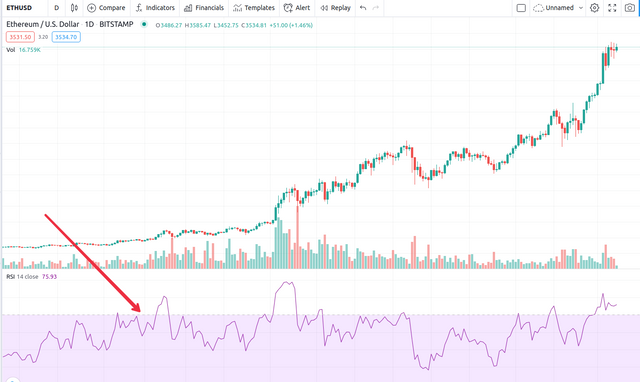
- The RSI indicator would be added to your chart.
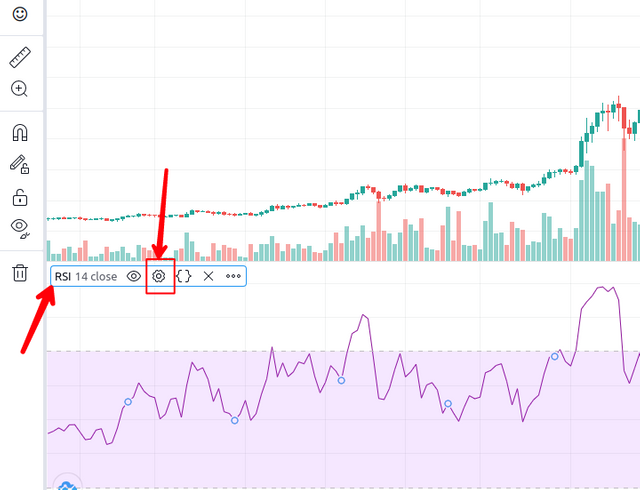
- Move your pointer to the RSI on the top left of the RSI indicator. A tab would extend.
- Select the settings icon on the extended tab.
You can configure RSI based on the inputs and the style.
Inputs
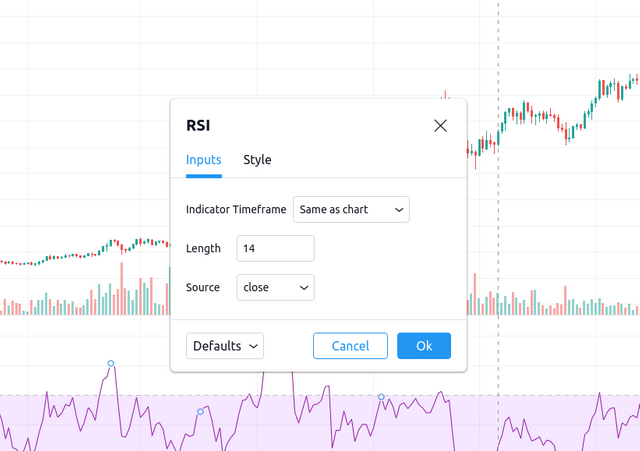
With the inputs you can make edits to the indicator timeframe, length and source.
- The indicator timeframe by default is the same as the chart. You can change it to minute(s), hour(s), day(s) and a month. click on the box to view the options available
- The length refers to the time period used for the RSI calculation. From the formula the length refers to the "n-time". The length can be changed. Click on the arrow up and down to increase or decrease the length or click the box to edit the value.
It has a default value of 14. This is because within a 14 length period it is assumed we can get a stable value of RS for the calculation of the RSI. The length parameter is very important, this is because it is required to give an accurate RSI. - The source is the price quality that is used in the equation. It is close by default. Click on the box to view the options available and select what you prefer.
You can restore the input settings to default by clicking defaults below the dialog box and selecting reset to default. You can also save the new inputs as defaults by selecting save as default after clicking defaults.
Style
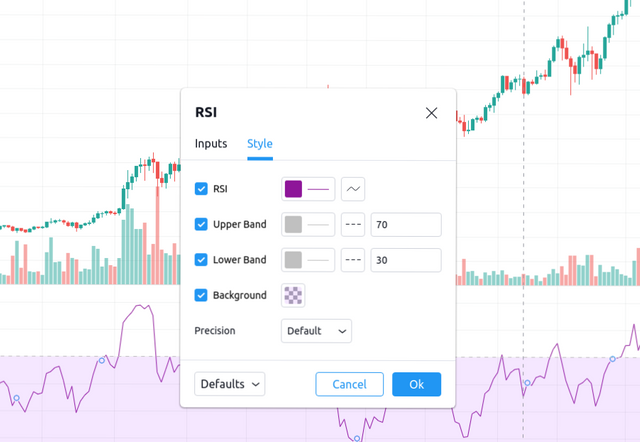
The style deals with the mainly with the appearance of the RSI indicator. You can change the colour of the RSI and the appearance. You can change the upper band and lower band values and colour. You can also change the background appearance and the precision. When you're done with your changes you can save as default or restore to default by clicking defaults.
Interpreting Overbought and Oversold Signals
The function of RSI is to give signals of overbought or oversold conditions.
- Overbought Signals
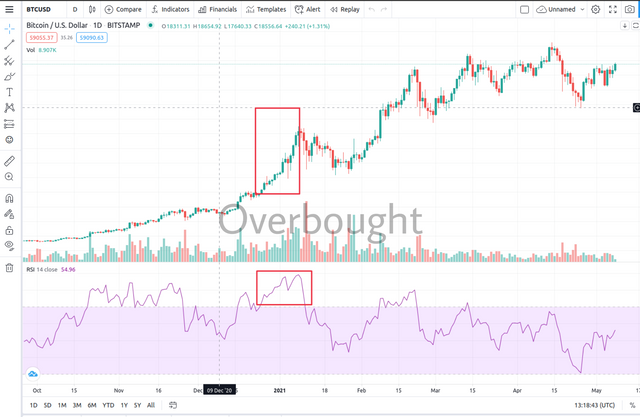
When the RSI reaches 70 and above it suggests overbought conditions. Between 70 to 100 there is a likelihood of a market reversal. This is because at that point most traders would like to sell and this would in turn bring about a fall in prices. Noticing this with RSI you can make good decisions that would make you profit a lot.
- Oversold Signals
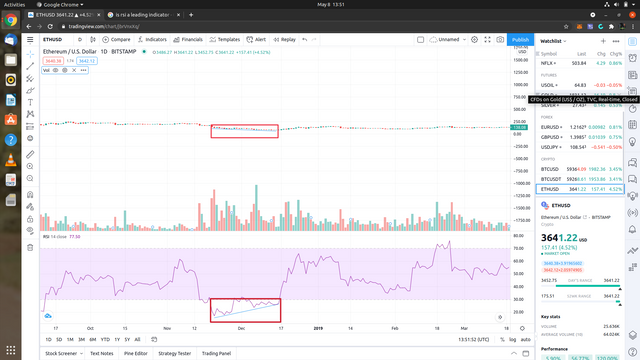
When the RSI is between 0 and 30 it suggests oversold signals. At this point you should know there is a likelihood of a reversal. A good trader would buy at this point because selling price is low and hold till price increases and gets an overbought signal to sell at a higher price to make a lot of profit.
How to distinguish between True and False RSI Signals
Like I said earlier RSI can be false at times but that doesn't mean it isn't true at times. You can identify the false signals using the divergence of the RSI. The divergence shows how untrue the RSI corresponds with the actual market price.
There are two types of RSI divergence namely bullish and bearish divergence.
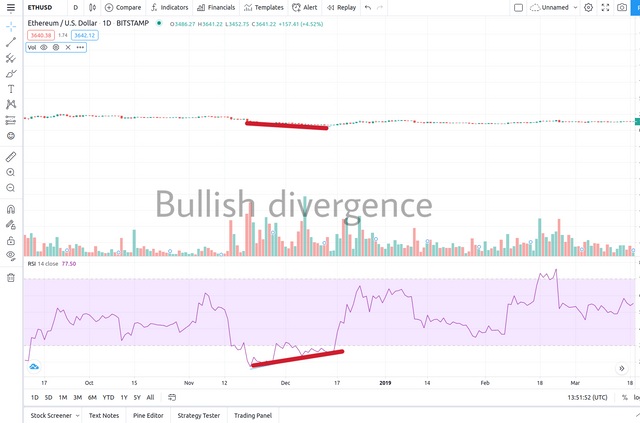
- Bullish divergence
Bullish divergence occurs when market price is low but the RSI shows a higher low. A bullish divergence can be seen in the chart below.
- Bearish divergence
This occurs when price is high but RSI makes a lower high. An example can be seen on the chart below.
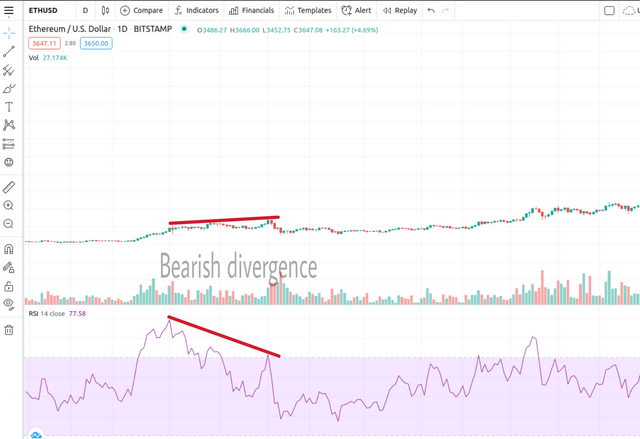
Chart Review
Like I said earlier, we wouldn't need RSI if it didn't give signals or hints to what is going to happen next so that traders could make decisions as to buying, holding or selling. I'm going to review two charts to show the buying and selling signals.
- Buy signals
The chart below is an Ethereum/USD chart. It shows an oversold condition. When the market dips, it is the right time to buy. At that point the price is cheaper and then there is a likelihood of a reversal which would lead to an increase in price.

- Sell signals
The chart below is a BTC/USD chart showing an overbought condition. When there's such a condition the price of the asset is very high and the likelihood of everyone selling to cause a dip is very high. At that point you should sell as soon as possible to make profit from the dip otherwise you'd either have to wait for the next oversold signal to sell or sell at a low price which you could run at a loss.

Hi @danielo109
Thanks for your participation in the Steemit Crypto Academy
Feedback
This is Good content. Well done with your research study on the RSI trading indicator.
Homework task
7
Thank you very much Sir @yohan2on