Crypto Academy / Season 3 / Week 7 - Homework Post for [@yousafharoonkhan]: Steemit Crypto Academy | Season 3: Week 7 || How to create an account on TradingView, how to use indicators,tools, features of tradingview


1.Defining the TradingView site and how to register an account in tradingview? what are the different registration plan? (screenshot necessary)
TradingView

TradingView is a network of traders and investors worldwide that provide reliable charts and analysis tools for trading and spotting opportunities in the market. It's very good and trusted not only in the crypto space but also in forex and all stock markets. It aims to study and predict market trends with the help of their analysis tools and certain features they provide. It is used by the majority of traders and investors worldwide to view and predict the prices of assets before making decisions or trading.
Registering on TradingView
Once you visit the site, tradingview.com you'll see this page

To begin the registration process on TradingView, click the person symbol at the top-right corner of the page
.png)
Then click Sign in to proceed.

This will bring you to the sign-in page where you'll be required to select an email account. If your email provider is not listed you can select Email to move to the next page.

Over here, you fill in the required details and tick the agreements. You then move on to do the captcha and click Create account

An email will be sent to the email address provided for verification. Once you're done verifying, you'll be taken to a page to select the kind of registration plan you'd want to have. I chose the Free Basic plan which can be found below the page

Right after you'd be presented with a page to complete your account creation.

Once you're through with the filling, hit Continue to finish the process.
The Various Registration Plans

TradingView offers 4 registration plans and they are as follows:
Free Basic Plan
The free basic plan was the one that was demonstrated above. It's free in the sense that you do not purchase a subscription. It offers benefits and enough access that enables new users to have an idea of the platform and what it has to offer. It's suitable for newbies.Pro Plan
This is a paid plan that has a monthly fee of $14.95 and an annual fee of $155. The benefits it has includes being ad-free, has 5 indicators per chart, 2 charts in one window, 20 server-side alerts and more as seen above.Pro +
The Pro + as you can guess is paid and has a monthly fee of $29.95 and an annual fee of $155. It has all that the Pro has and also includes 10 indicators per chart, 4 charts in one layout, 100 server-side alerts that can support 2 devices at a time and more as seen above.Premium
This is paid and goes for $59.95 per month and 599 per year. It is the complete package with 25 indicators per chart, 8 charts in one layout, 400 server-side alerts that can support 5 devices at a time and more as seen above.
2.Explain the different features of tradingView and what is your favourite feature and why? (screenshot necessary)
The Different Features of TradingView

Over here, we can see the various features TradingView supports and these are:
- Chart
This is one of the most used features in TradingView. The chart shows the market trend of every asset and cryptocurrency pair available on the site and it provides trading tools and various indicators that we can use to analyze, study and predict the direction of the market. We can make changes in the appearance of the chart as well to suit our liking.
- Trade

Trade has Top Brokers and Brokers Awards
Top brokers connects traders to brokers that are affiliated with TradingView and Broker Awards displays Brokers who have won in competitions hosted by TradingView.

- Markets

Markets give live updates and views of indices, futures, currencies, bonds, stocks and cryptocurrencies and related information regarding them like the price of a stock or exchange sites a cryptocurrency is listed on.

- Screeners

There are 3 screener options on TradingView, there's the stock screener, the forex screener and the crypto screener. Traders use these to obtain the best results in a short time through the indicators of our choice.
- Community

The community area connects us to other traders and brokers worldwide through streams and ideas and articles on stocks, currencies, indices, futures, bonds and cryptocurrencies. This is communicated through professional news and accompanied by financial data.
Favourite Feature
The chart is currently my favourite feature. With it, I can analyze charts and get to predict the market trend using the various tools available to perform technical analysis. There are lots of tools like trend lines and indicators to help traders and investors make decisions.
3.How to set up a chart in TradingView and use two tools to edit it. (screenshot necessary)
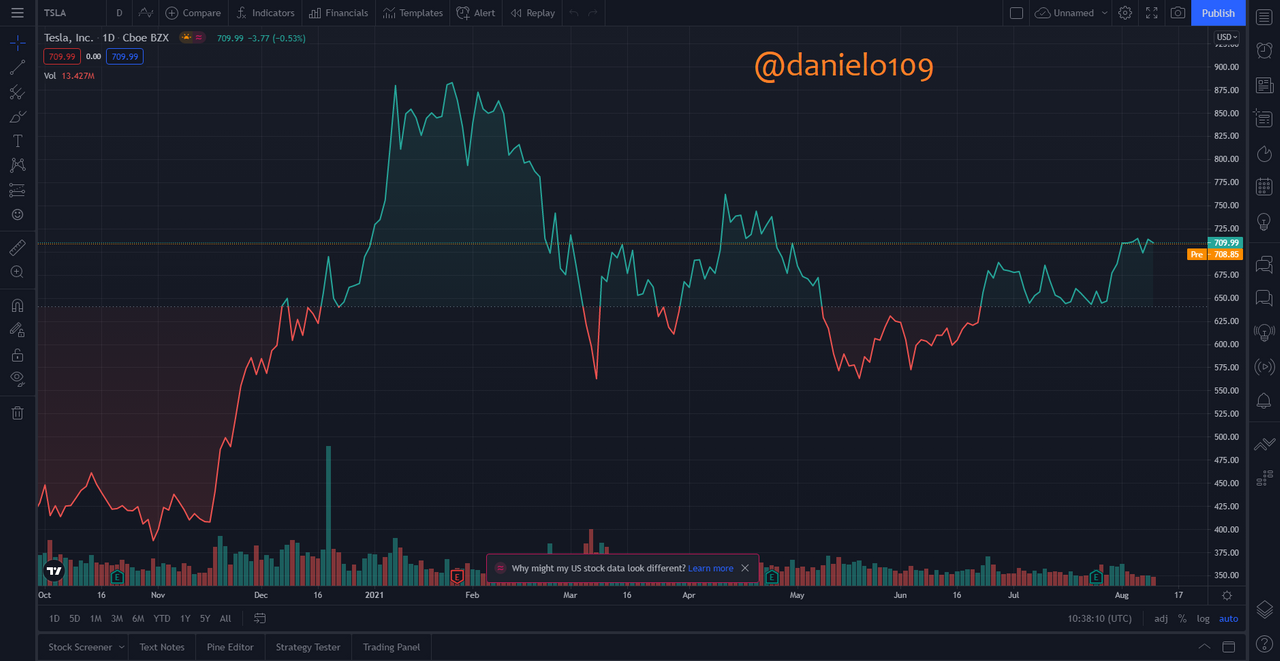
Setting Up a Chart in TradingView
To set up a chart in TradingView, you'd have to click the gear symbol to view the options available at the top right corner. With this, we can make certain modifications to suit our liking.

In the setting, locate the Symbol tab and once there you can toggle the body, wick and other things on or off. The body is the inner part of the volume bars and we can turn it on or off or even add the wick(the line that extends from the volume bars) or take it off. We can also change the colour of their colour to whichever one we want.
The Appearance tab enables us to add colour to the background or toggling the Session breaks, Watermark among others. It's common practice to change the background to a colour that's less hurtful to the eyes so instead of white I opted for grey.


Tools in the Chart
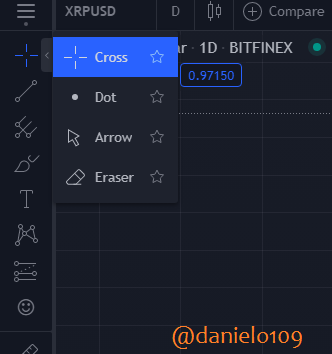
There are many helpful tools on the TradingView chart. These are the cross, pitchfork, measure and brush tools amongst others.
The cross-tool is a cursor and is used to scroll along a graph against time from left to right or vice versa. It simple and nor exactly grand but it very useful. When I was still very new to TradingView I found it difficult navigating because I hadn't discovered this tool. It is represented by a cursor, cross, dot and arrow and an eraser.
Trend lines can be used to identify and confirm trends. It connects at least 2 price points in a chart and is usually extended to identify the sloped areas of support and resistance. Positive-sloped lines show support price action and indicate an increase in net-demand. So long as the price action stays above it we have an uptrend or bullish trend. On the other hand, negative-sloped lines act as resistance to the price action and implies that there's an increase in net-supply and so long as the price action stays below this line, there would be a bearish trend.


There are several lines that can be used too. This includes the Arrow, Ray, Cross line and lots.

4.Explain how to add indicator in chart, what is your favourite indicator and why? (screenshot necessary)
Adding an Indicator to Charts on TradingView
Adding indicators on charts is important to be able to predict the price of an asset or currency and thus lots of indicators are provided by the platform to help with that.
To add an indicator in a chart you first click on the indicators & strategies button, fx shown below to view all the indicators and strategies.

Now with the various options;
- My scripts enable us to create our own custom studies or strategies and indicators
- Built-ins refer to in-built strategies and indicators by Trading View
- Candlestick Patterns has indicators that can be used to predict the future price movement based on the current chart trend
- Public Library contains the custom indicators and strategies others have developed besides the ones provided by TradingView.
- Volume Profile contains indicators for displaying trading activity over a certain period of time.

The easiest way to go about finding an indicator or strategy is to use the search bar above. So you enter the indicator's name and it will appear so long as you didn't make a mistake and then you click it.

Over here the indicator I used was the RSI indicator.
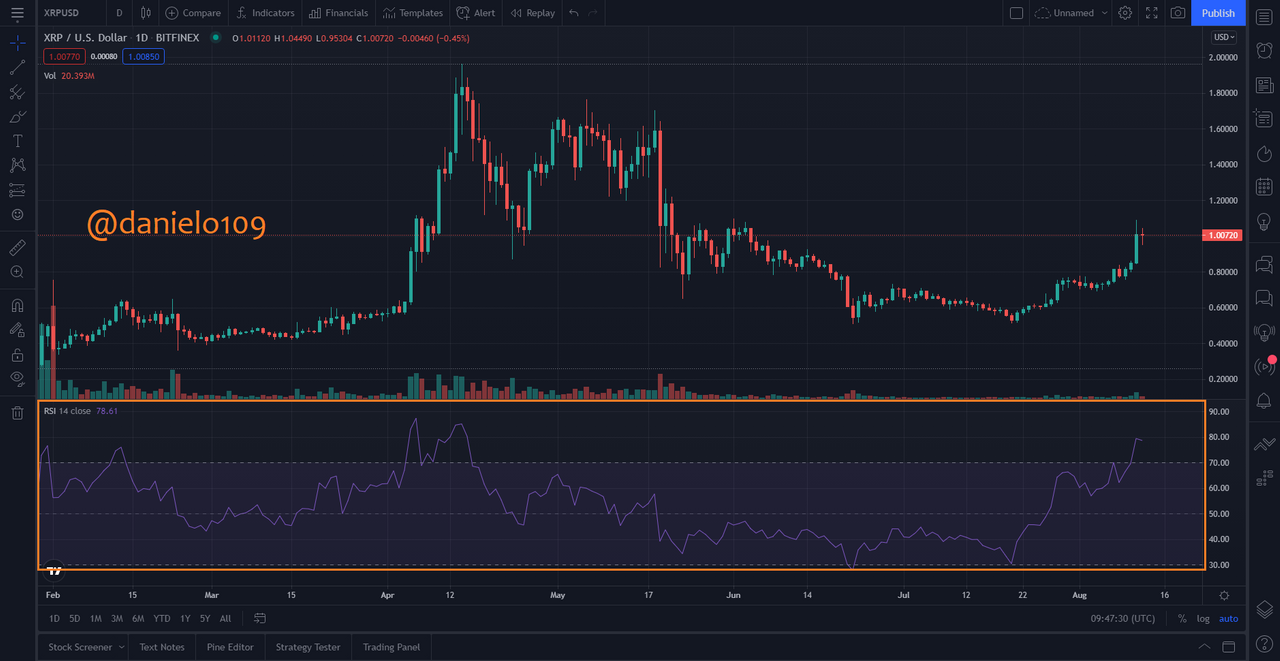
Favourite Indicator
Currently, my favourite indicator is the Relative Strength Index(RSI). It's an indicator in technical analysis that measures the magnitude of price changes to determine whether an asset or currency has been oversold or overbought in the market. The RSI gives signals regarding bearish and bullish price momentum and is usually plotted beneath the graph of an asset's price. An asset is said to be overbought when the RSI is above 70% and oversold when below 30%.
5.Do you think TradingView is useful in predicting the market for cryptocurrency (trend/price)?
Is TradingView useful?
TradingView is is more than useful in predicting the cryptocurrency market. It has the needed tools and indicators to perform technical analysis.
Technical analysis is a method that observes the trend and historical data in share prices and historical price charts of an asset to predict future trends or the direction of the market.
With the unpredictable movement of the crypto market, the indicators like RSI and moving averages as well as analytical tools available are more than enough to signal us on the coming trends as well as the price of a crypto asset whether long term or short term. With access to the community as well, newbies can read the articles and join streams to be informed on how the market trend is likely to go and as such know how to respond to those trends.
TradingView is simple and intuitive and it's easy to use and it's great in predicting market prices and trends.
Conclusion
TradingView is a great platform that seeks to assist traders and investors to help them observe and predict the market trend regarding various assets and currencies. The platform also welcomes newbies with its simplified interface and Help info. I recommend that every trader and investor learn to use TradingView with its vast information and tools to help them make informed decisions.
All screenshots were taken from tradingview.com
Hi
Thanks for participating in the Steemit Crypto Academy
Feedback
This is good content. Well done with your research study on Tradingview.