Steemit Crypto Academy | S3-Week Homework Post for @asaj | Crypto Asset and the Random Index
Question 1
In your own words define the random index and explain how it is calculatedThe Random Index is a prominent technical indicator used in analyzing and predicting change in crypto trends and price pattern. The Random Index is also called the KDJ indicator, owing to the K, D and J lines present in the indicator. It is an improvement on the already existing stochastic oscillator indicator, which is a momentum indicator introduced in the 1950's by George Lane. The stochastic Oscillator indicator has two lines- the K and D lines. The crossing of the K and D lines indicates a right time for monetary operations of either buying or selling. The K and D lines oscillate between the range of 0 and 100.
The Random Index is an improvement on the Stochastic Oscillator with the addition of the J line. The J line measures and represents the divergence of the D line from K. The crossing of the K, D and J lines signals a moment for buying or selling. One special attribute of the J line is that it is not bounded between the 0 and 100 scale, hence it does shows exact predictions void of false readings resulting from sticking to a fixed range.
The Random Index is mostly used for a short-term market trend analysis of crypto assets.
How is the Random Index calculated?
The steps involved in calculating the Random Index can be summarized in three simplified steps:
- Calculation of the RSV value for a specified period of time- this can be for a specific number of hours, days, weeks, months or years (i.e n days, n weeks etc).
- Using the RSV value, the value of K and D will be calculated.
- Finally, using the K and D value, the value of J is calculated
The value for calculating RSV is:
Where
- CN : Closing Price of a particular day or nth day
- LN : Lowest Price of crypto asset in n days
- HN : Highest Price of crypto asset in n days
After the RSV is calculated, the K and D value are calculated using the below formulas:
Current Value of D = (2/3 x D value of previous day) / (1/3 x K value of the day)
Note: In a situation where there is no value for D or K of the previous day, the value of 50 should be used to replace.
To calculate the value of J, the formula below is used:
Question 2
Is the random index reliable? ExplainA number of technical indicators exist today all trying to improve on the short-coming of the other. This proves that all previously existing (and future indicators to be introduced) are not completely accurate. They are susceptible to giving false, wrong and misleading signals, and the KDJ indicator is not an exception. It definitely is an improvement on the stochastic oscillator but it should not be totally relied on.
Experienced trader have learnt to use more than one indicator at a time to analyze crypto price charts. Common indicators that can be combined with the KDJ indicator in analysis include the MA (Moving Average), MACD (Moving Average Convergence Divergence), ADX (Average Directional Movement Index) or ATR (Average True Range) indicators.
Also, it should be noted that using to many indicators can negatively affect a trader. He won't be able to make swift and accurate decision especially when his four to ten indicators are producing conflicting signals.
Question 3
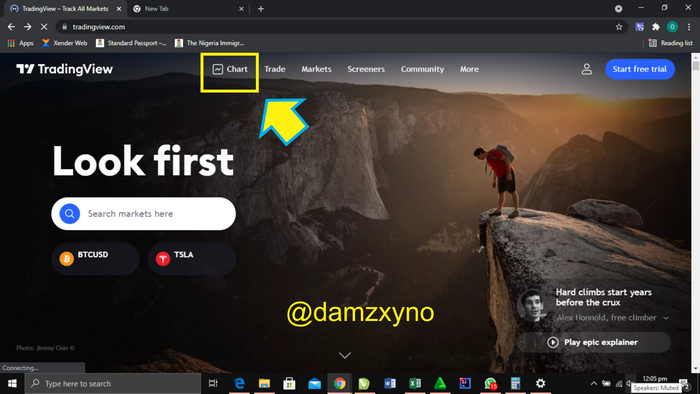
How is the random index added to a chart and what are the recommended parameters? (Screenshot required)For this task, I used TradingView.com. I opened the website and on the top menus, I located the Chart button. And this directed me to the price chat page.
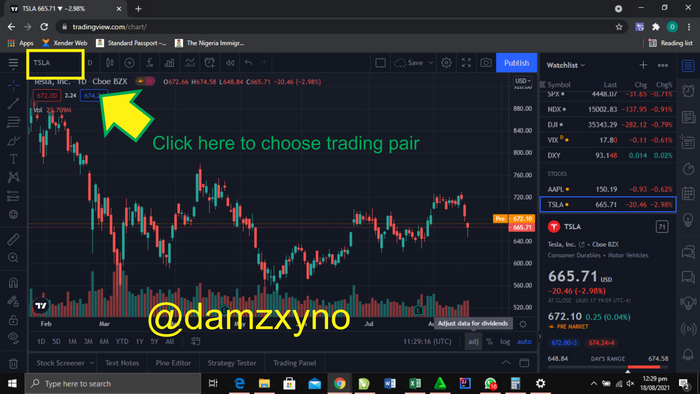
I clicked on button at the top left hand corner to choose a desired pair. On clicking it, an interface appeared.
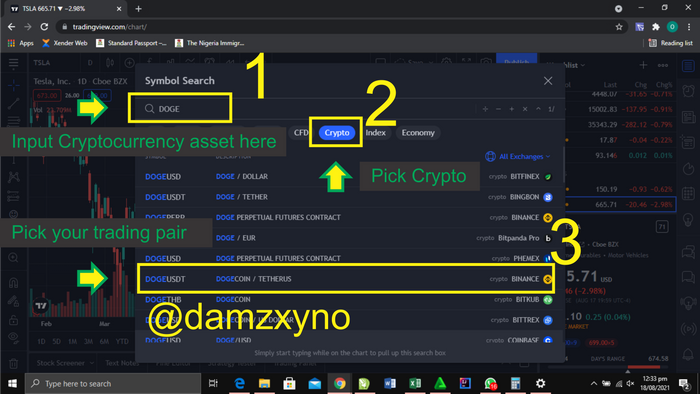
A new interface labelled symbol search opened. I typed Doge in its search box, after which I selected the crypto button because Doge is a crypto currency. I picked the DOGEUSDT (Binanace) pair.
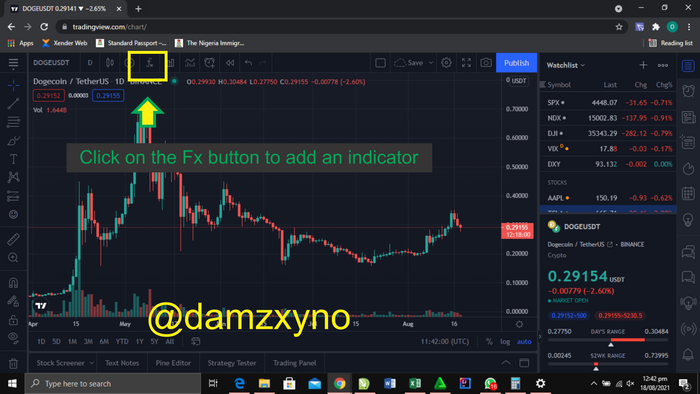
To add the KDJ indicator, I started by locating the button with the Fx symbol on it at the top part of the site. I clicked it and an interface opened.
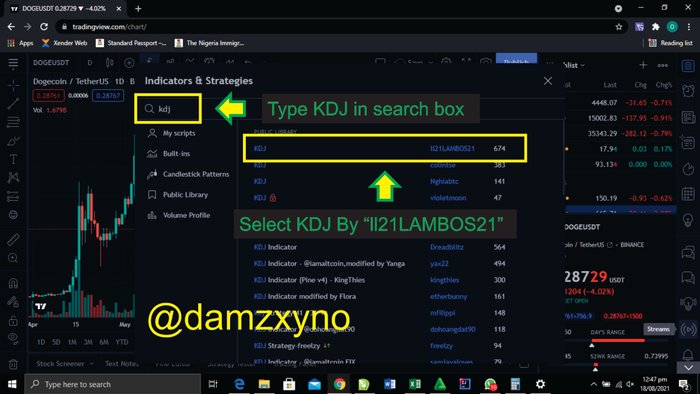
In this new interface called Indicators & Strategies, I inputted KDJ in the search box and a list of indicators appeared. I picked the KDJ indicator by ll21LAMBOS21; this indicator lies at the top of the chart.
Now the KDI indicator has been added to my chart.
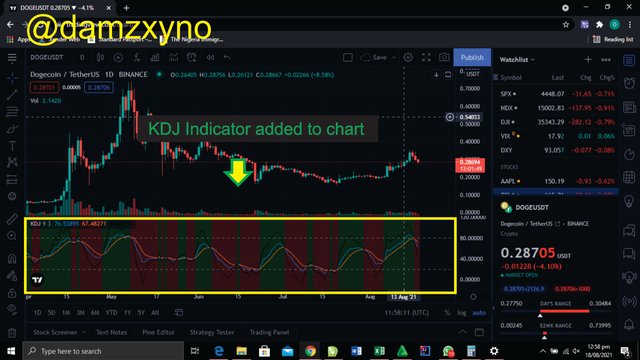
Key:
- The Line is the K Line
- The Orange Line is the D Line
- The Black Line is the J Line
Question 4
Differences between KDJ, ADX, and ATRADX Indicator: The full form of the abbreviated ADX indicator is Average directional Index. As its name implies, it displays the average of expanding price range values. The indicator plots the uptrend trend of a crypto asset using a single line (unlike ADX which uses three different lines). The single line of the ADX indicator ranges between 0 and 100 helping traders determine the strongest price trends to trade (i,e buy or sell).
ATR Indicator: The full form of the abbreviated ATR indicator is Average True range. The function of the ATR indicator is to determine and display the volatility of a crypto asset over a certain period of time. Like the ATX indicator, the ATR indicator is also represented on the chart by a single line, however, it doesn't lie within a specific range. The ATR indicator is useful as it helps traders to determine where to place a stop loss order in a trade.
Comparison
- Number of Chart Lines: The KDJ indicator has 3 lines it its indicator while the ADX and ATR both have a single line.
- Range: In the KDJ indicator, only the K and D line ranges between 0 and 100, the J line has no range. For the ADX indicator, It ranges between 0 and 100. While the ATR indicator is not bounded by a specific range
- Information Displayed: The KDJ indicator displays when an asset is overbought, oversold as well as when to take monetary actions (through convergence of the three lines). The ADX indicator displays the strength of an Asset trend. While the ATR indicator displays the volatility of the market
- Market Direction The KDJ and ATR display the direction of a crypto currency asset price while the ATR does not display its price direction.
Question 4
Use the signals of the random index to buy and sell any two cryptocurrencies. (Screenshot required)I used the TradingView platform demo account to perform this task.
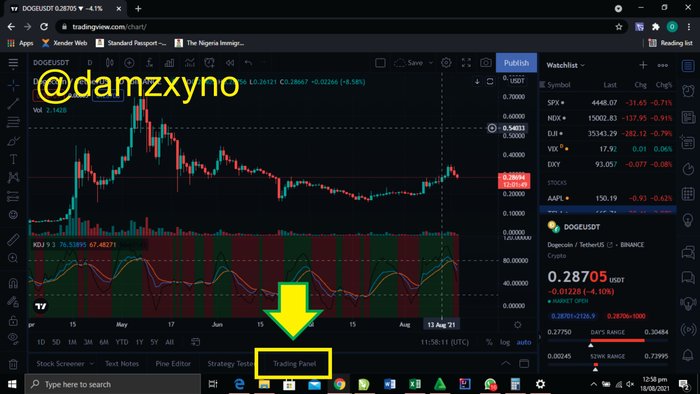
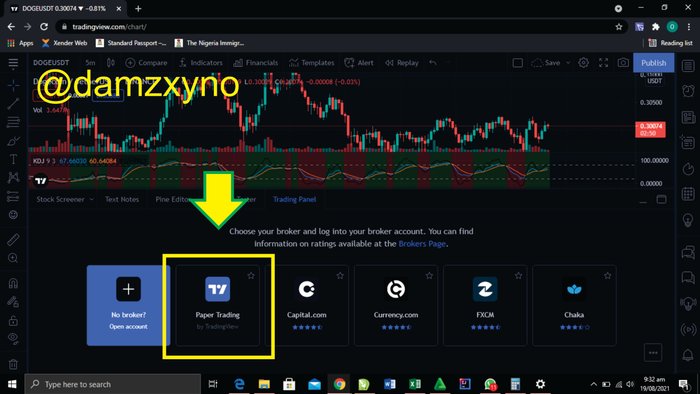
- On the TradingView platform, I clicked on trading panel button as shown in the screenshot below.
- On clicking the trading panel button, I was giving different option through which I can connect my broker account. To use a demo account, I clicked on the Paper Account as shown in the screenshot below.
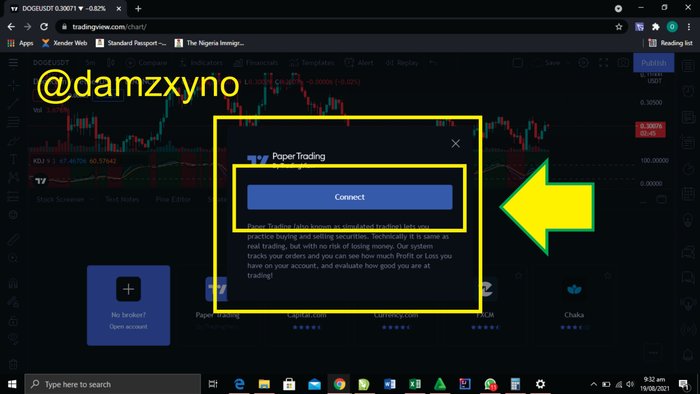
- An interface popped up and I clicked on the connect button.
I performed this task using the DOGEUSDT and ADAUSD pair on the 1 minute time frame.
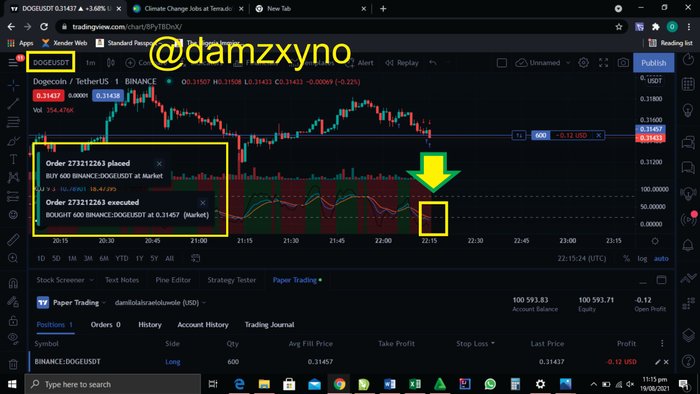
The DOGEUSDT Pair
- The K (blue color), D (Orange color) and J (Black color) lines of my KDJ indicator crossed indicating a good time to sell. I bought 600 DOGE at the rate of 0.3146 USDT. The order was placed.
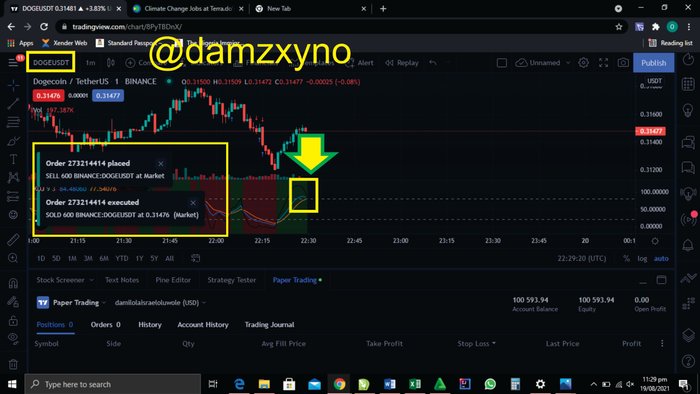
- After a while, as the K (Blue color) Line crosses to the overbought region, I sold the 600 Doge at the rate of 0.3147. I made a net profit of 0.06 USDT.
ADAUSD Pair
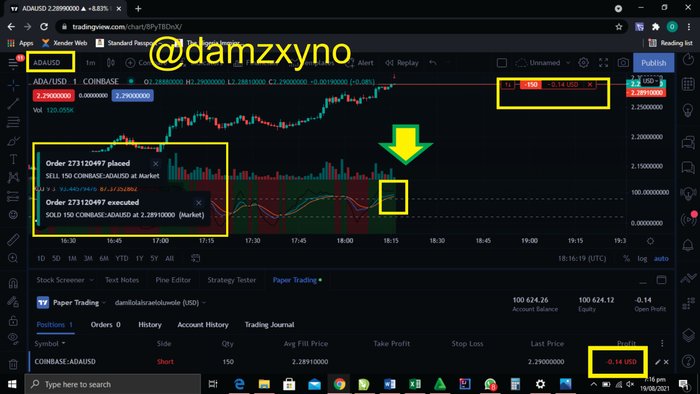
- The K (blue color), D (Orange color) and J (Black color) lines crossed to the oversold region. So I bought line of my KDJ indicator was in the oversold region so I bought 150 ADA at the rate of 2.2891 USD (Market price). The order was placed.
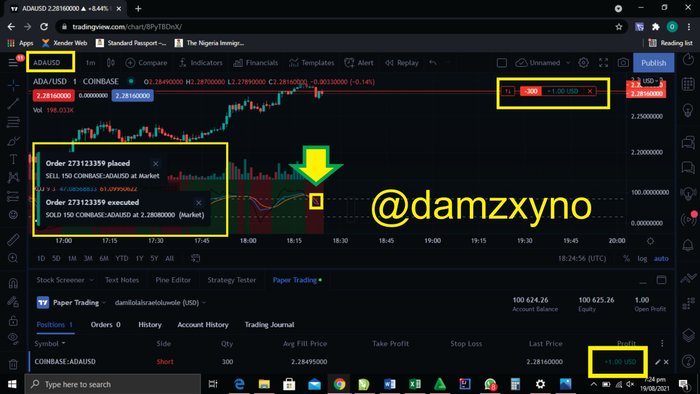
- After a while, the K (blue color), D (Orange color) and J (Black color) lines crossed signaling a good time to sell. I sold the 150 ADA at the rate of 2.2808 USD. I made a net profit of 1.2 USD.
Conclusion
Different technical indicators exist today with the intention of aiding traders make good trading decisions. One of such technical indicators is the KDJ indicator, otherwise known as the random index. The indicator shows the signals of when is the best time to buy and sell with the convergence of its three lines. Like every other indicator, it should not be completely relied on to make trading decisions as it is also prone to sending false signals. It is a good idea to combine it with other indicators such as the ADX, ATR, MA and MACD indicators.
Thank you!!
Superb performance @damzxyno!
Thanks for performing the above task in the eighth week of Steemit Crypto Academy Season 3. The time and effort put into this work is appreciated. Hence, you have scored 8 out of 10. Here are the details:
Remarks
Overall, you have displayed a good understanding of the topic. You have performed the assigned task excellently. However, you did not provide new information to this course, as most of the information you provided have already been mentioned by other participants. We were looking forward to see a more unique content.
That said, this is good work. Thanks again for your contributing your time and effort to the academy.