Crypto Academy / Temporada 3 / Semana 1 - Publicación de tareas para [@kouba01] Trading Crypto With Ichimoku-kinko-hyo Indicator - Part 1
I found this class very interesting since I did not know this type of indicator, and by doing my homework I was able to learn a lot about it.
1- What is the Ichimoku Kinko Hyo indicator? What are the different lines that compose it? (screenshots required)
Ichimoku-kinko-hyo is a great technical indicator, which was developed before the Second World War and released in the years 1968, by the Japanese journalist "Goichi Hosoda", which tried to explain at that time that "Everything is a equilibrium "and expressed it perfectly through this indicator, which created it to analyze future trends in a market and be able to predict prices to act at the right and precise moment.
This indicator was hidden for a while due to its language, however, over the years it was translated and spread throughout many countries, and since then millions of users and traders decide to use it to get the best out of each one. of its graphs, to be able to predict the future of a price.
How it is based on the theory of "equilibrium", its translated name means "The balance chart from one look", that is why one of the points that he wanted to explain through his indicator is human behavior, since the He noted that human beings sometimes act out of the ordinary, however, they always return to a state of balance and normality, he wanted to express the same through this indicator.
Hosoda, developed this indicator on the working days that were in Japan at that time, therefore, they used it at that time to analyze graphs in those days, since in the others, the time periods were very short and it did not work the same, also based on the Japanese market at that time, because we know that right now the market is very volatile.
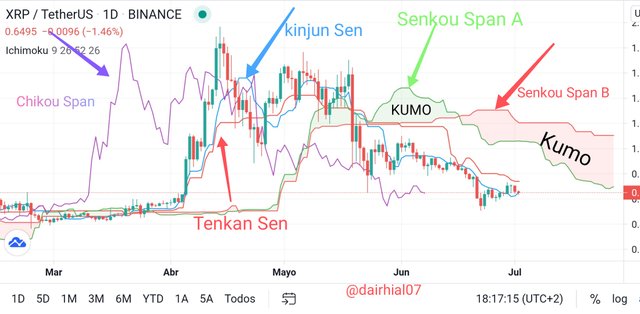
This indicator is composed of 5 lines that are an essential part to analyze prices, or predict a future movement, that is why I will explain each of them here:
• Tenkan Sen: This line is considered the fastest, since it only has 9 time periods, and it is used to calculate the volatility towards where the price is going.
We can calculate it as the longest maximum, and the shortest minimum, in this way we can determine this type of line in a graph.
Its formula is: (Highest maximum + lowest low) / 2
• Kijun Sen: This line is considered the slowest, compared to the previous one, since it consists of 26 periods of time, and with it we can calculate the volatility of a price, but in a longer time distant, long term.
It is also calculated as the highest maximum and the lowest minimum.
Both have the same formula, but work in different periods of time:
(Highest high + lowest low) / 2
• Senkou span A (SSA): Also called a smoke cloud, it is considered a line that predicts the price towards the future, it can be calculated as the average value of the two previous lines, and it consists of period time of 26.
His formula is: (Tenkan sen + Kijun sen) / 2
• Senkou span B (SSB): Here we can calculate the highest maximum, and the lowest minimum, and it consists of 52 time periods, and with 26 periods into the future.
Its formula is :: (Higher + Lower) / 2.
These two lines work together, that is, both towards the future, but with different methods and periods of time.
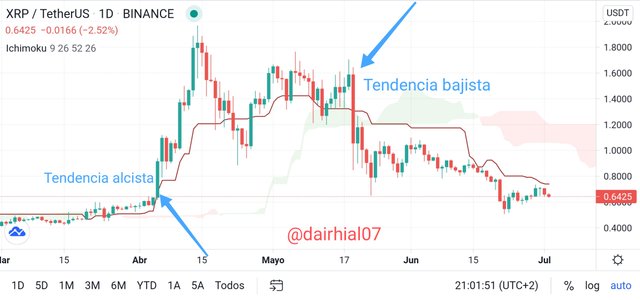
Thanks to them we can predict or calculate in which trend a certain asset will go, either bearish or bullish. They are characterized by being clouds that are colored with different colors to identify them:
Green: Bullish
Red: Bearish.
• Chikou span: This line indicates the closing of the asset on the chart, with 26 periods of time in advance, and is presented backwards.
How we can see this indicator is very useful to predict and calculate the price of an asset, if we analyze each of the 5 lines that compose it very well, I am sure we understand it and we can put this indicator into practice in the graph that we want to analyze .
Thanks to Hosoda, we can know and calculate which are the support and resistance areas, which will tell us when we should operate. We all know that we are currently in a very volatile market, therefore, this indicator makes it easier for us to analyze certain behaviors that the market has, to anticipate previous operations.
2- How to add the Ichimoku indicator to the chart? What are your default settings? And should it be changed or not? (Screenshots required)
Although for sure it seems difficult to understand this indicator, we will think that adding it to our graph is even more difficult, and that we will have to do thousands of formulas, however, it is the opposite, since it is very easy and simple to do, in my case I used the platform "Tradingview" for the realization of this.
Here I share the link:
• I entered the main page of Tradingview
• I looked for the asset and the parity I wanted.
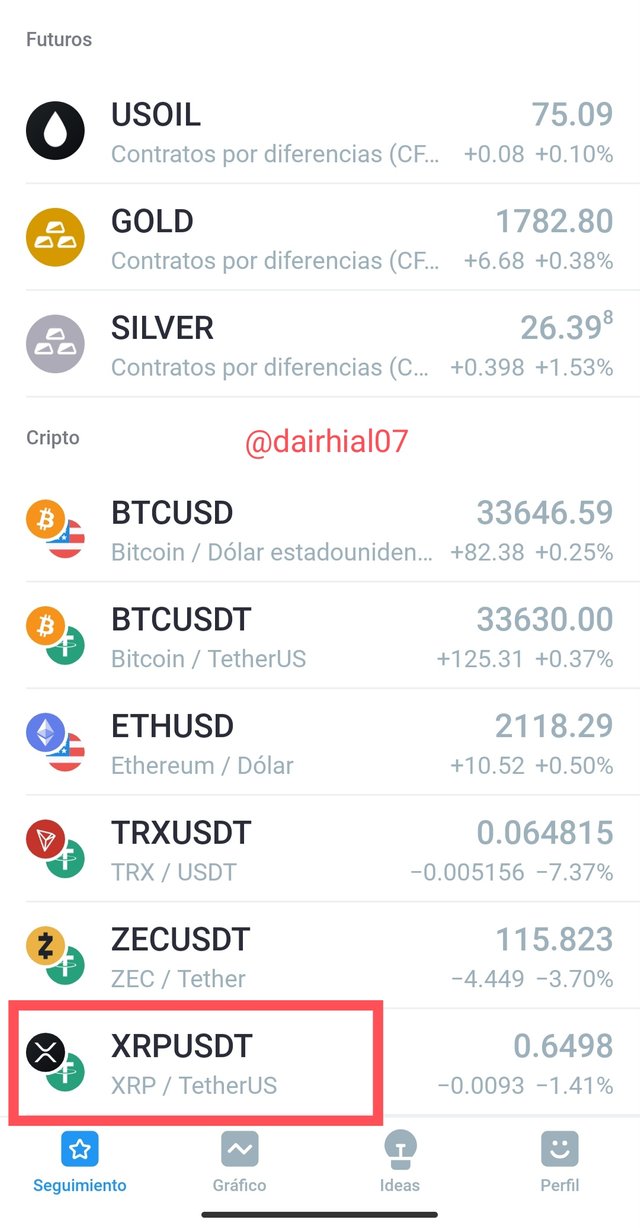
• Once I selected it, its graphic appeared automatically.
• To configure it with the indicator "Ichimoku-Kinko-hyo" I just clicked where it says "Fx indicators"
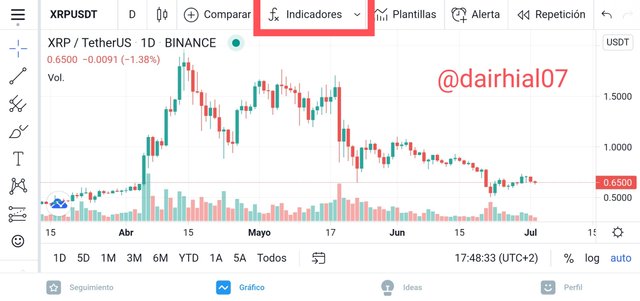
• And we will get a search engine to place the name of the indicator that we want to place on our chart.
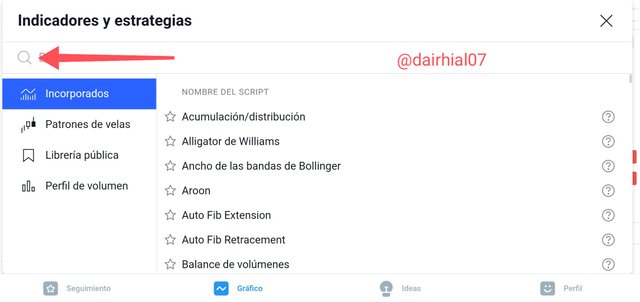
• I wrote the name ichimoku, and I got the following:
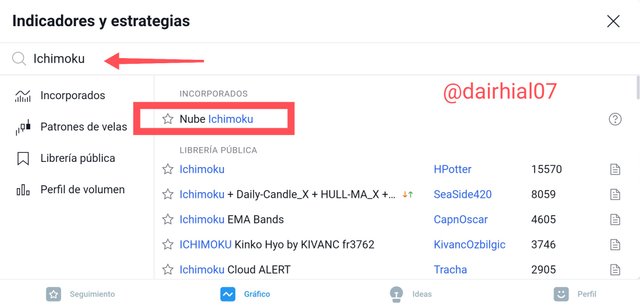
• I selected where it says "ichimoku smoke cloud" and it will automatically be added to the graph:
What are your default settings?
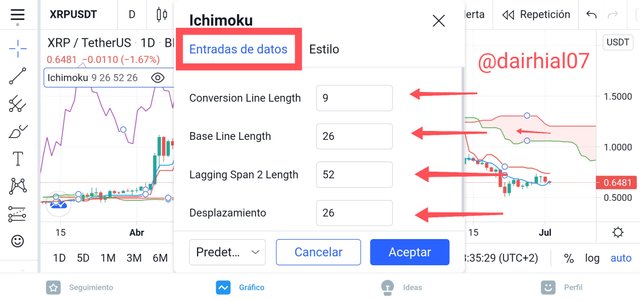
Of course, this indicator has its default settings, and it is very easy to look at it, we just have to click where it says settings and two tools will appear, such as:
• Data entry: Here we can see each of the time periods that each of the lines has, and their displacement.
As I said before, Husoda based the time periods of his indicator on the working days of Japan at that time, adding an extra day, which would be 6 days, since Saturday was worked in that country.
So each of them represents the following:
✓ Tenkan sen: 9 (Period of a week and a half) Working days.
✓ Kijun sen: 26 (Period of one month) Working days.
Senkou span A: 26
✓ Senkou span B: 52 (Two-month period) Working days.
✓ Chikou Span: 26
• Styles: In this tool we can see and change the colors of each of the lines of the Ichimoku-Kinko-hyo indicator.
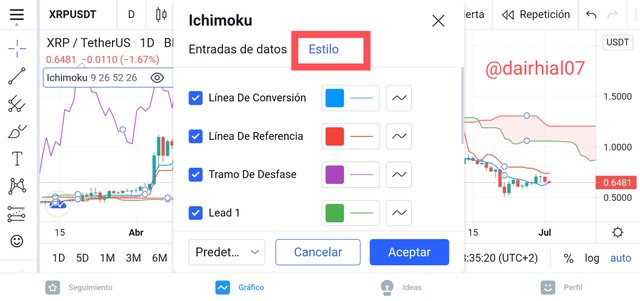
Should they be changed?
As we have already seen, they can be changed, however this is at the discretion of each of the users who are handling this, we must also take into account that we must know how to handle each of the stipulated lines very well, since if we want to change the original time periods, we must learn to handle them very well before changing them, however it can be done.
The styles of the colors of each of the lines can also be changed, but we must take into account not to get confused if we change it, that is why we also have to learn each of the lines so as not to get confused with the change of colors.
All this we can change as long as we have knowledge of it so as not to get confused.
3- How to use the Tenkan Sen line? How to use the Kijun Sen line? And how to use them simultaneously? (Screenshots required)
The Tenkan sen line is the fastest of all, thanks to it we can calculate in which direction the price of an asset will go in a short time, since it only has 9 time periods and works with the highest maximum and lowest minimum .
Thanks to this line we can determine if the trend of an asset will go upward or downward, but we can only see this in a short way, since this line is fast, which will help us decide if we should go for that asset or not.
Let us consider this as the first equilibrium point of our graph, in order to make a decision we must analyze the Tekan Sen and Kijun Sen lines very well, however, the first one will begin to guide us in which direction the price of an asset can go. , representing a support and resistance on the chart in whatever direction it is going to go
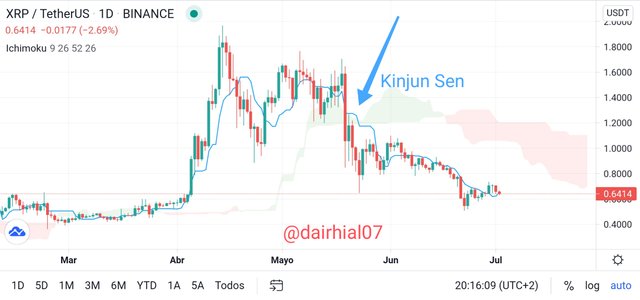
How do we know the Kijun Sen line is very long, since it consists of 26 time periods, so here we can calculate the trend of an asset but in a longer time, it works with the same formula as the previous one, which is the maximum highest and lowest minimum.
With this line we can analyze the looming trend with a little more time, since as we know, it consists of 26, that is why we can also see the support and resistance levels that it may have on the chart. It is a very strong line that will help us determine what action we should take with respect to the price of an asset but in a longer period of time, which will give us more security when making a decision
How to use them simultaneously?
As I said before, both lines work together perfectly, and thanks to both we can determine the value of a certain asset, since both work simultaneously well, for example.
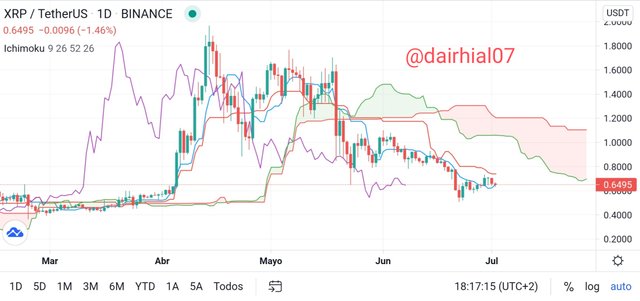
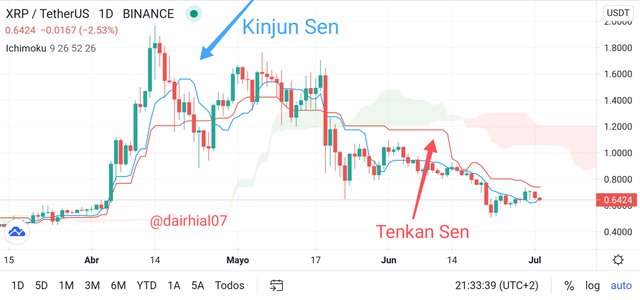
When we have the Tenkan Sen line heading up above the Kinjun Sen line, it means that an uptrend is coming. And when we have the Kinjun Sen line above the Tenkan Sen line it means an upcoming downtrend.
And this is how both lines are used simultaneously, which makes it possible to analyze in a more secure and reliable way, the direction of an asset.
As we can see from my chart, the Kinjun Sen line is above my Tenkan Sen line, which means a downtrend is approaching.
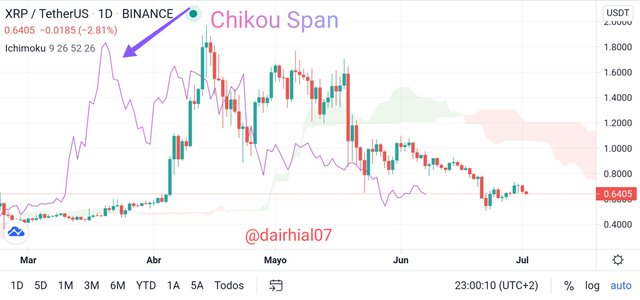
4- What is the chikou span line? And how to use it? And why is it so often neglected? (screenshots required)
The Chikou Span line is the line that determines the closing of the candle on the chart, with 26 periods before the current one, and thanks to it the closing of the asset can be determined on our chart. Often this line can be considered as the laggard, however, this is not the case, as it is also a fundamental part of the Ichimoku-Kinko-hyo indicator.
Thanks to this line we can determine the closing of an asset, and know when the operation is finished, to start another one again.
How to use it?
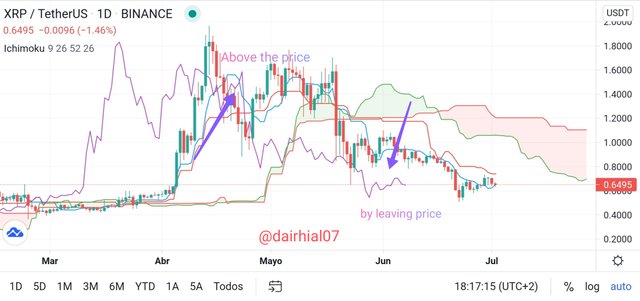
We use the Chikou Span line to determine where we are on the chart, whether to start trading elsewhere or to exit the market, it forms a fundamental part of the indicator although many people do not believe it, since thanks to this line we can predict the closing behavior of the market chart at that moment.
Recall that this line is positioned far away from the other price lines, however, if the Chikou Span line crosses above these price lines, we can consider an uptrend, and we can consider a good time to buy. And on the contrary, if this line goes below the price line, it is prone to a downtrend, so it is the ideal time to sell.
Why is it often neglected?
This line is often neglected because there are many people who underestimate it and think that it does not have much importance in the indicator, however it is not true, since as I explained previously it has a lot of relevance, since thanks to it it will help us determine the closing. of the asset on the graph.
By not determining the calculation of an asset in a short or long-term period of time, it also makes many users or investors neglect it and do not decide to analyze it, since it works in 26 periods before the closing of the graph that we are analyzing.
Many users may not understand it and do not have a clear tendency of what the line expresses, and they decide not to pay attention to it and to be neglected.
5- What is the best period of time to use Ichimoku? And what is the best indicator to use with it? (screenshots required)
For sure there is no period of time to use this indicator, nowadays it can be used when the investor feels fit and able to start working with it, since as we know each person is different and will prefer to use the period of time with which you feel most comfortable and capable.
One of the great advantages of using this indicator is that it can be traded in a short or long-term period of time, which is advantageous since the investor or the user can choose what type of losses to operate, (short or long).
However, in my personal opinion I would work in various periods of time to adapt and be able to predict which one is the most feasible for me, and then start operating in the time that I consider necessary and that gives me the trend that I am looking for.
What is the best indicator to use with it
As we have already seen throughout the entire task, the Ichimoku-Kinko-hyo indicator is very complete and does not need to be completed with another indicator to obtain excellent results, since it has everything in one, since it is very independent and we can achieve great results with it if we understand it perfectly.
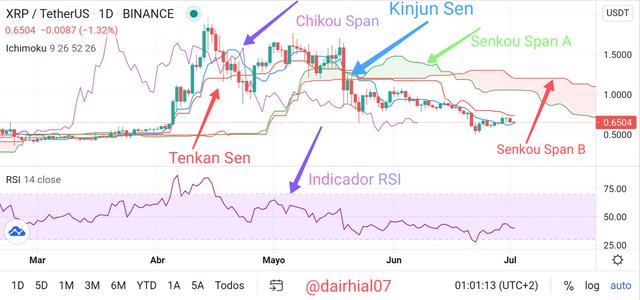
However, I consider that the best indicator to complement it would be the (RSI), since with the implementation of this indicator, for those who still do not clearly understand the Ichimoku-Kinko-hyo signals, with the help of the RSI , we will be able to see and understand the trends of an asset in a clearer way.
Each indicator that exists provides an excellent use for users who decide to use it, that is why the combination of both seems very satisfactory and beneficial to me, and if we know how to take advantage of them well, we can obtain incredible results.
6. Conclusion:
The Ichimoku-Kinko-hyo indicator is a great technique for predicting and calculating prices of an asset, we have been able to see each of the functions that it presents to us, it serves us in our future investments if we know how to apply it in the correct way, but to This, we must know it, study it, and inform ourselves very well about the subject, since as we know, for sure it looks a bit complex and difficult to understand.
However, after analyzing it very well, we can apply it as a great strategy in our investments, and see great benefits through it. Despite being a long-standing indicator, it still lasts over time, and we have been able to see how it has expanded around the world, and how millions of investors and users apply it in millions of investment strategies such as Trading .
Each of the lines that make up this indicator are an essential and fundamental part to achieve the task that Goichi Hosoda wanted to expose, that is why through his indicator based on "balance" he was able to transmit and express, that Even though things get murky, everything returns to normal in a moment (This applies in the case of market trends).
I thank teacher @kouba01 for the excellent class he gave us this week on this technical indicator, I really learned a lot and I appreciate the great effort he made to present this class, in which I put great effort and dedication.
Hello @dairhial07,
Thank you for participating in the 1st Week Crypto Course in its third season and for your efforts to complete the suggested tasks, you deserve a 5/10 rating, according to the following scale:
My review :
Medium content article where your answers missed a lot of focus, so I present to you a set of notes:
Your explanation of the reasons for changing the default settings of the indicator was not accurate, as you relied only on what was said without writing down your personal experience.
To use the two lines Tenkan Sen and Kijun Sen together, you can rely on their intersection to extract buy and sell signals.
There is a difference between time frame and period, you can view charts for different time frames like 1 minute or 5 minutes and for hours or days to highlight changes.
You did not give a clear explanation of the importance of integrating the indicator with the relative strength, as well as the chart does not contain any mixed signals.
Thanks again for your effort, and we look forward to reading your next work.
Sincerely,@kouba01