Crypto Academy / Season 3 / Week 7 - Homework Post for [yousafharoonkhan] How to create an account on TradingView, how to use indicators,tools, features of tradingview
Every trader has ever operated through it, however, in this task we will talk in detail about its different uses, as well as its most essential characteristics and the different ways of working with TradingView.
I hope he likes it, and we will all learn together !!!

1) What is TradingView?
The world of finance continues to evolve more and more, and that is why with the passage of time and with the arrival of technology there are many tools and platforms at our disposal so that we can operate with our assets easily and simply, such as This is the case of the incredible platform "TradingView" that offers us thousands of settings and options so that we can carry out operations in order to obtain good results in our finances.
TradingView is an incredible platform recognized worldwide, where the best traders, investors or even new users can perform analysis on their charts with the currencies they want, and best of all, it includes the best trading pairs for that we can operate easily and simply.
This wonderful platform has the best tools and settings so that we can predict the different trends that exist in the market, whether it is an upward or downward trend. And how is this possible? Well, simply through the implementation of the different types of technical indicators that have existed over time, as well as another series of adjustments that will help us better analyze our currency chart.
The arrival of TradingView to the financial market of crypto assets, brought many advantages and benefits, since thanks to it we can do a more detailed monitoring of our favorite assets, since it shows us their graph and price in real time, and where we can also add another series of tools and adjustments to detect any future trend in the market.
One of the greatest characteristics of this site is the union with other platforms that work with stock exchanges in the market, such as recognized exchanges such as Binance and others. Hence, this makes users or investors feel completely safe wanting to work through it.
And what is the best of all? That with TradingView you do not need to be a great expert to start operating through it, since its system and development is created so that we can adapt to the different modalities that the page offers us to operate, it does not matter that we are novices or very advanced in the market, this platform is widely trained for all types of investors.
• How to register an account in TradingView?
We must know that the creation of an account in TradingView can be done in two ways, it can be paid or free for a certain period of time, that is why here I will show you the step by step of how to create an account totally free.
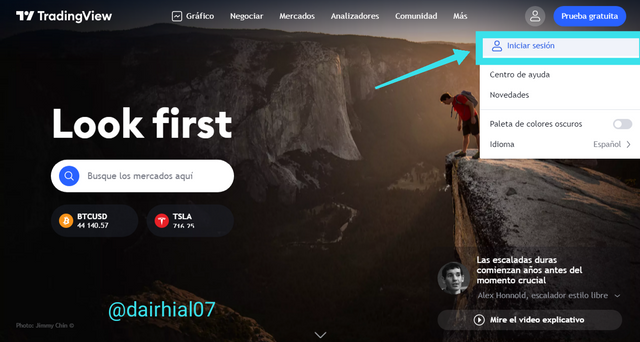
• The first thing we have to do is go to its main page, which is the following:
• As we can see, the entire main screen appears with some tools, however, as we want to create an account, we will click on the item that is in the upper right corner.
• Then several options will appear, however we will click on "Start session":
• An interface will appear where we are told if we want to log in or create an account, of course we will click on the second option:
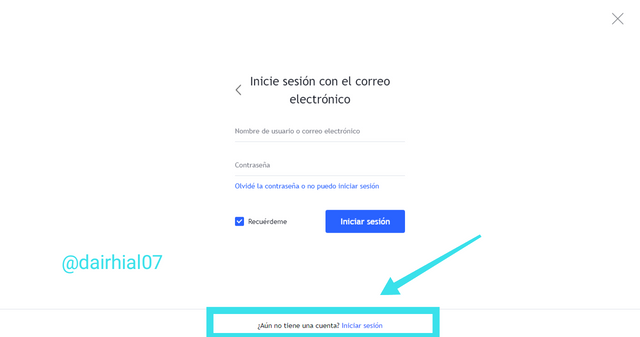
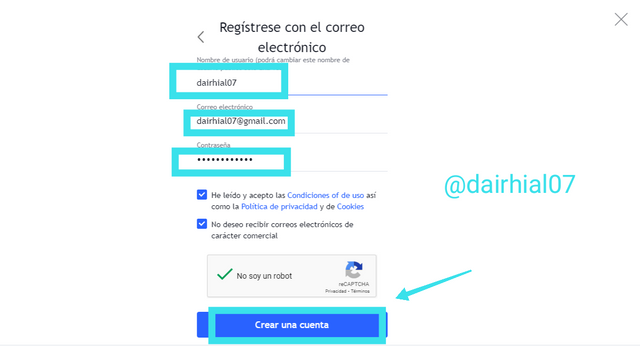
• Then we will see a form that we must fill out with some information such as username, email and a secure and reliable password.
• We will accept the terms and conditions of the platform, and finally we will verify the CAPTCHA.
• Click on "Create an account"
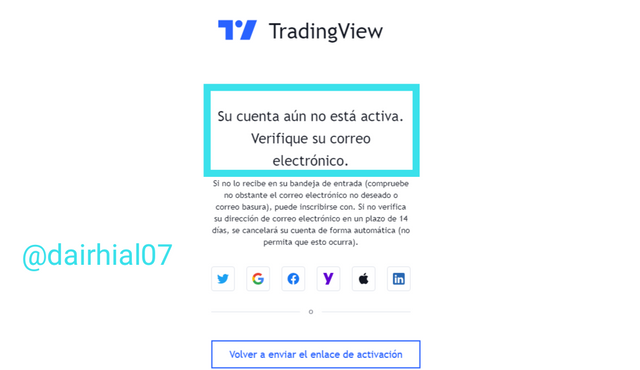
• However, this is not all, since a message will appear indicating that in order to activate our account we must confirm it with a message that reaches us at the email address that we have provided.
• We will return to our email and confirm the message that TradingView has sent us.
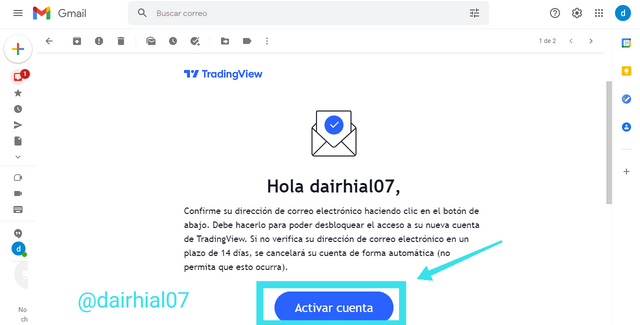
• We will click on "Activate account" and it will take us directly to the TradingView platform, where it will tell us to place a profile photo, as well as our name and surname.
• When we have finished completing everything, we will click on "Continue".
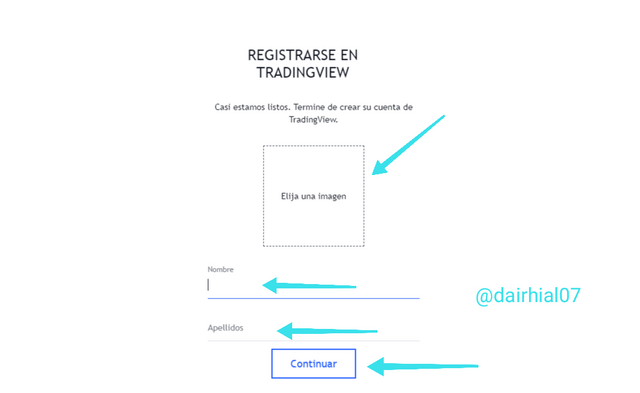
• Then we are ready to trade successfully and totally free on TradingView!
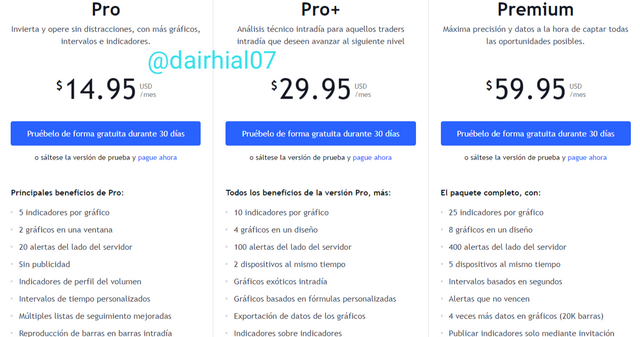
• The available plans provided by the platform will appear:
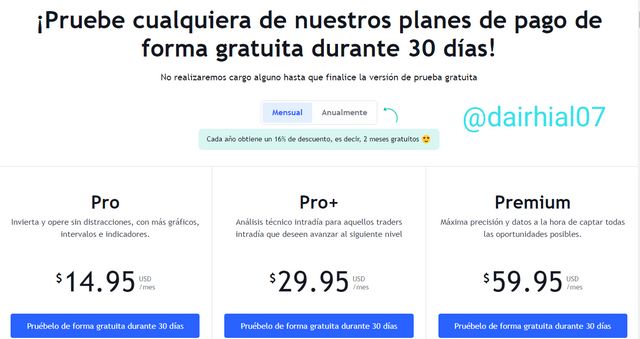
• What are the different registration plans?
As I mentioned earlier, TradingView offers us several types of plans so that we can get more adjustments when trading through it, the ones that are available are:
• Basic or free plan: This plan is the one that is accessible to all users, mostly for those of us who are starting in this world, therefore, it is completely ideal since it offers us the basic settings and tools that a beginner may need.
It provides us with the best indicators and the best tools to operate successfully, in this case I use this plan and it is excellent.
• PRO Plan: The PRO plan offers us other types of tools that the basic plan does not have, such as:
✓ We can operate without distracting ads or advertisements
✓ It offers us more technical indicators
✓ We can implement more than 3 indicators to the chart
✓ We can obtain two graphs at the same time.
The PRO plan offers us other types of advantages and benefits, therefore, if we want to obtain these services and others, we must pay $ 14.94 per month.
• PRO + Plan: This plan is a little more advanced since it offers us more complete and dynamic tools to operate, such as:
✓ We can implement custom formulas to our taste and work style.
✓ It allows us to enter more than 6 indicators on our chart.
✓ More than 50 alerts at our disposal.
✓ More advanced and specialized designs in graphics.
Many tools and others like those mentioned above can be implemented in our charts through the PRO + plan, and it is available starting at $ 29.95 per month.
• Premium Plan: And last but not least, we have the PREMIUM plan which is the most advanced of all, therefore there are more modern and advanced tools and settings at our disposal, some of them are:
✓ We have the possibility of implementing a capacity of 8 graphics in a single design.
✓ We can add more than 15 indicators at the same time in our graphs.
✓ We have the advantage that 5 devices use these services at the same time.
✓ And one of the greatest advantages is the possibility of setting an alarm that does not expire.
As we can see, the premium plan is the best of all, since it offers us many more tools and more advanced and suitable settings so that we can operate successfully through Trading View, at only a price of $ 59.95 per month.
TradingView always seeks to adapt to the level of knowledge that different users or investors around the world may have, that is why it presents us with these suitable plans so that we can implement the one we want in order to obtain excellent results.
The good news is that we can run a free trial for each of the plans mentioned above for a period of 30 days, isn't that great? That is why TradingView is a very complete platform capable of providing us with the best tools to operate in the market.
2) TradingView Features
Now that we know a little about the platform, we are going to explore little by little its most functional and important characteristics that it has in its system. If we look at its main page we can see that it has six main characters, where each one has secondary characters, then we are going to explore some of them:
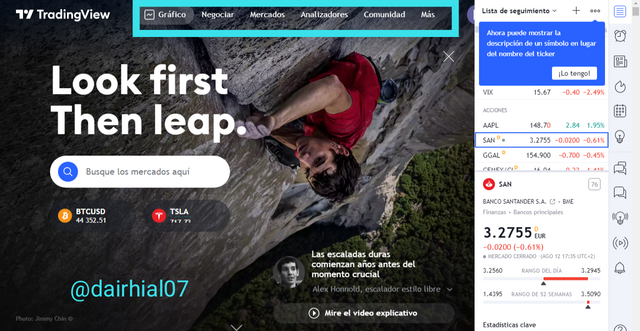
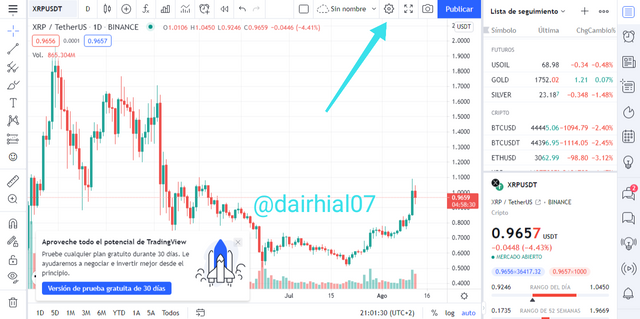
• Chart: This is our first feature, and as its name says, in this section we can trade through charts, of course with the currency we want along with its established trading pair. For this example I decided to use the XRP currency together with its USTD trading pair, that is XRP / USTD:
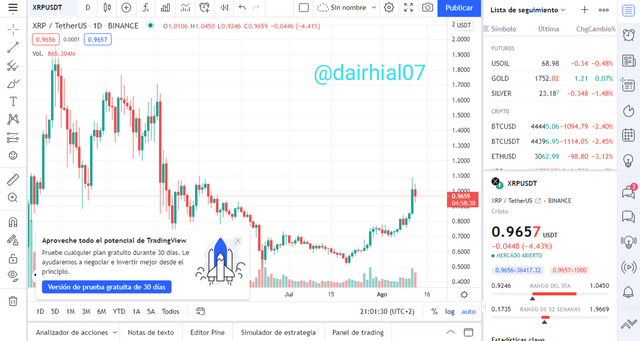
Once we have selected our currency along with its trading pair, our graph will automatically appear on the screen, and as we can see we have many tools and settings to start trading, such as:
• We have at our disposal the implementation of all types of candles available, such as hollow ones, lines, bars, etc.
• We have the option of adding any of the technical indicators that are available.
• We can obtain very detailed financial information such as total income, balance, statistics, costs, etc.
• We have the option of sneaking our alarm, or our price alert to the chart.
• We can add thousands of adjustments to edit our graphics, such as changing the color of the lines, adding text, changing the color of the candles, and changing or adding any adjustment that we consider necessary.
• We can also see the news of other investors or users, as well as an interest list, a calendar, and even chat for private or public benefits.
• And of course we also have the option of adapting our graph according to the time and day we want.
• Negotiate: In our second main characteristic we can find that of negotiate, where we can see how the best brokers that the platform has appears in the form of a ranking, and where we can see the reviews that each one has within the system, as well as their reputation and ratings.
Thanks to this feature we can see the content that these great brokers make within their account, in order to inspire us and develop ourselves more and more.
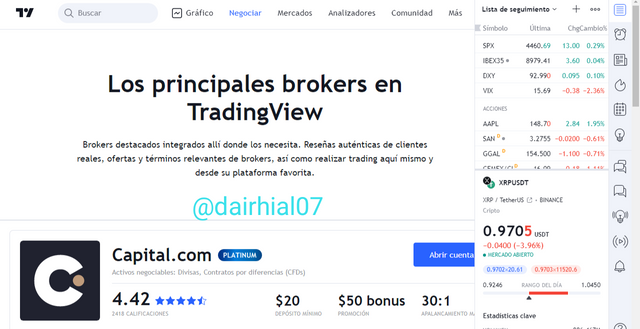
This tool has other secondary characteristics, which is:
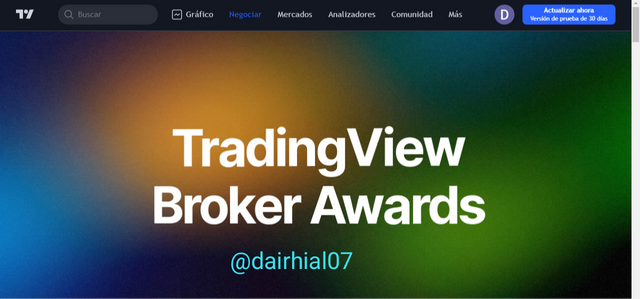
• Broker Awards: In this section we can see very detailed information about the awards of each of these brokers, as well as the level of capacity they have with this platform and how much they can help us.
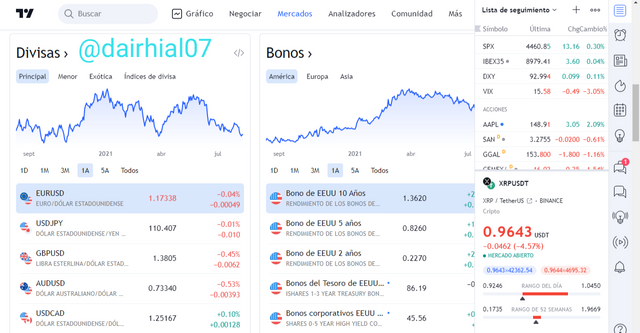
• Markets: In our third main feature we can obtain very detailed and concise information about the market, since as we know TradingView not only works with cryptocurrencies, but also with fiat money such as gold, gas, oil ,etc.
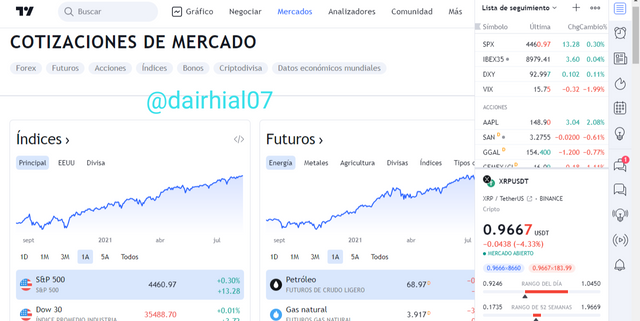
We also have several secondary characteristics that this tool offers us, which are:
• Cryptocurrencies: We can check their prices, their charts, their capitalizations, etc.
• Currencies: We will get information on all types of currencies, from all countries and from all continents.
• Shares: In this secondary tool we will obtain relevant data on the assets plus the volatile ones, those with the most capitalization, those that have lost and gained the most, as well as the maximum and minimum of their price.
• Futures: Here we can detail information about the future of very important elements such as metal, energy, agriculture, etc.
• Bonds: And as its name indicates, we can look at information about the bonds offered to us in each of the world's continents, such as Asia, Africa, Europe, etc.
• Analyzers: In our fourth main characteristic we can note that we have an analyzer for each currency, or matter that we will be looking for, it can be a cryptocurrency, a bank, an action, etc. Therefore, here we can see in detail relevant information about what we are looking for, for example:
• The status of the market
• The volume
• Capitalization
• Your performance
• The earnings
• Its performance in a stipulated period of time, etc.
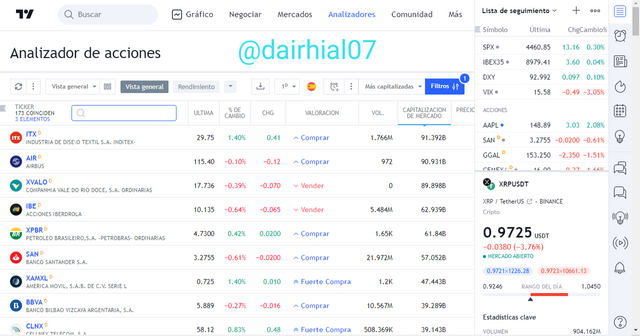
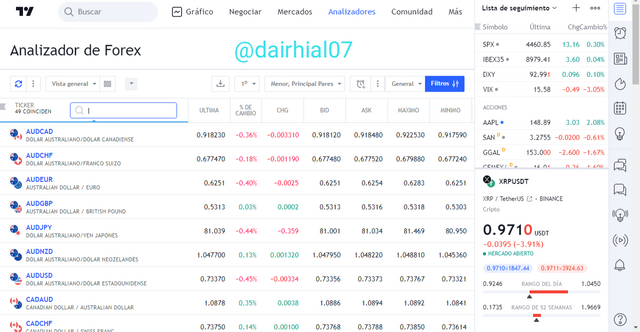
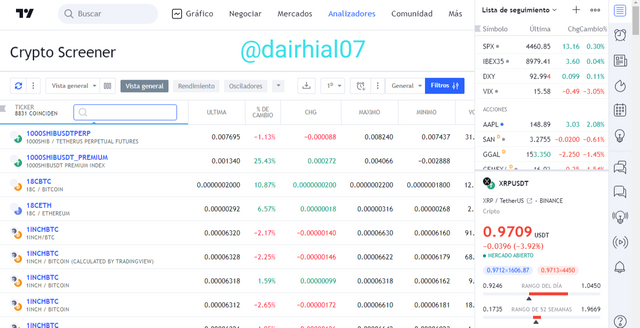
However, in this tool it also has other secondary characteristics which are
• Forex Analyzer
• Ctypto Screener
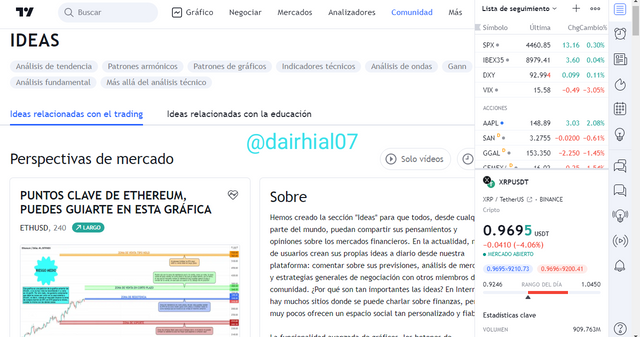
• Community: In our fifth main feature we find a kind of blog, where users, investors, and traders from around the world can give us their opinion and ideas on any aspect of the financial market.
This feature seems very interesting to me since thanks to it we can find out all the opinions and messages that TradingView users write, on any specific topic in the market. We could see it as a kind of web newscast, and the best of all is that everyone can contribute a comment or an idea about something in particular.
• More: And last but not least, we have our sixth main character, where we can seek help on any topic, as well as information on companies, currencies, their prices, etc.
Let's see this feature as an additional plus of what TradingView can offer us, since we were able to notice all the functionalities that this system offers us for our use and development. It is not normal that it is so recognized worldwide, since it is a very complete and developed platform to build finances, whether centralized or decentralized.
• Favorite Feature:
TradingView is a very complete platform where we can find thousands of features and settings for our use and benefit, the time that I have been using it has made me want to work with it more and more, since there are so many tools with which we can work that it simply is very difficult to choose one.
However, my most favorite feature is Chart and Community, since I consider that in the charts section we can operate very effectively through any currency chart we choose. Each of the options we have to adjust our chart to our preference, makes TradingView become a highly trained platform for all types of investors, since in it we can predict prices, breakouts and among other market trends, of course with the help of many indicators and tools that help us in this process.
Now in the community section is another of my favorite features since here each user or investor can express themselves and say what they think about the financial market, therefore, we can follow up on the most outstanding news that is they speak here, as well as contribute ideas on any particular topic.
That is why each of the features and tools that TradingView has makes the user feel comfortable and very comfortable working with it, since its system adapts to the needs of the investor.
3) How to set up a chart in TradingView? and use two tools to edit it.
To configure a chart through TradingView is really simple, we just have to enter its main page, and in the "Charts" section, select the currency we are looking for along with its trading pair.
• In this case I chose XRP / USTD.
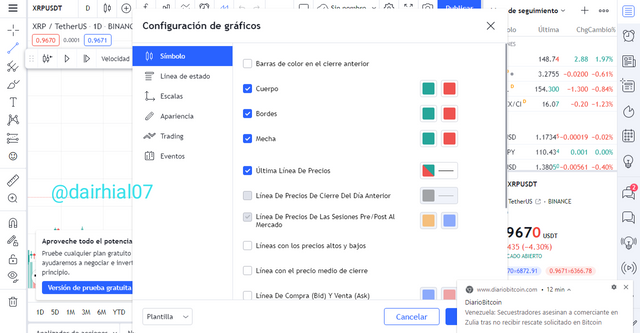
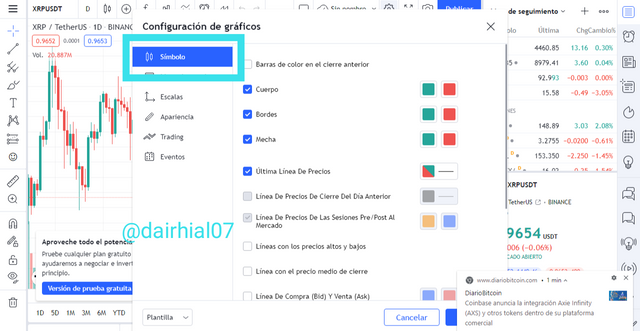
• As we can see, in the upper right corner we find several items, however to configure our graph we are going to click on the "gear" button that appears there.
• Several options will automatically appear, however, we are going to explore some:
• Symbol: In our first tool called symbol, we have several options to configure our graph, one of them is to be able to change the color of our candles, the candle wicks, the edges, we can also configure the color of our preference for all price lines.
For this we have a wide range of palettes of all colors to choose the one that we like best.
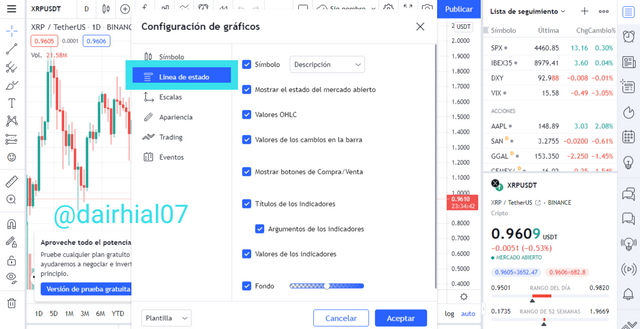
• Status line: Here we can change the values of our charts, as well as the indicators and everything that has to do with tools and settings, for example:
✓ We can decide if we want the indicator values to appear.
✓ OHLC values
✓ We can choose to remove or leave the buy and sell buttons.
We can change all these and more settings in this tool, we just have to remove the check ✓ that each setting has and that's it.
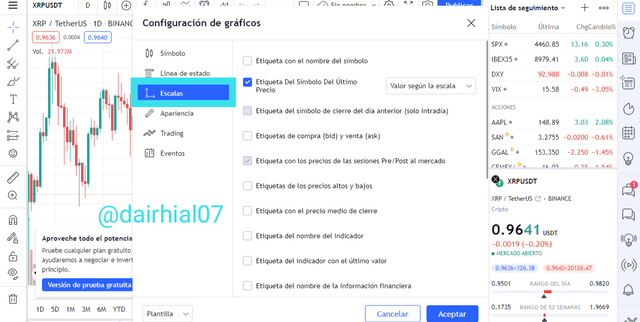
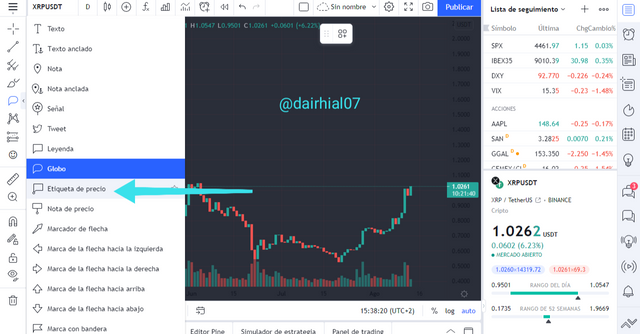
• Scales: In this tool we can change all the value labels that our graph has, such as:
✓ The purchase and sale labels
✓ The closing tags
✓ Indicator labels
✓ The labels of bullish or bearish tendencies, etc.
All these labels and many more can be configured in this tool.
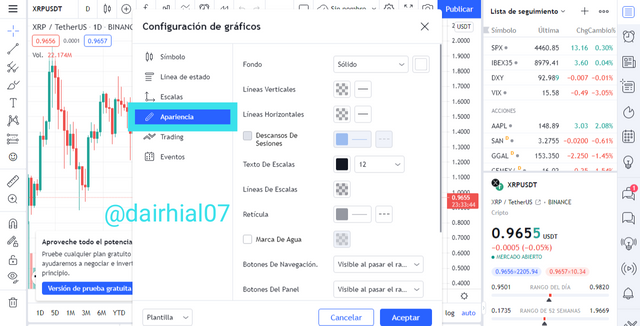
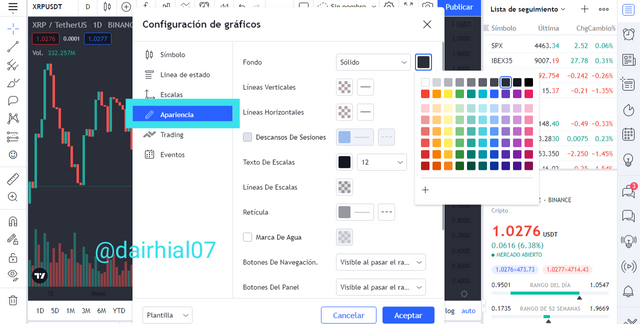
• Appearance: This is perhaps one of the most used tools to edit a graphic, since here we have several options at our disposal, such as;
✓ We can change the color of our background of our graphic.
✓ We can also change the color of the vertical and horizontal lines that the background graphic has.
✓ We can edit the watermark of the graphic
✓ We can choose to make the panel and navigation buttons visible, everything will depend on our tastes.
Here we can recreate our graph with the tools we want.
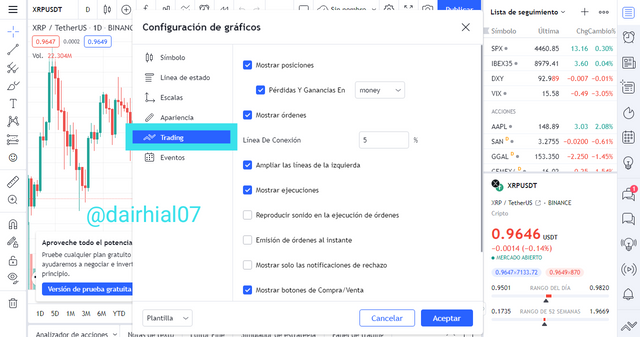
• Trading: In this option we can change all the settings related to Trading, such as:
✓ We can choose or not to show the orders on our chart.
✓ As well as the losses and gains that we are having.
✓ In the same way we can also choose
show the buy and sell buttons as well as any execution within the chart.
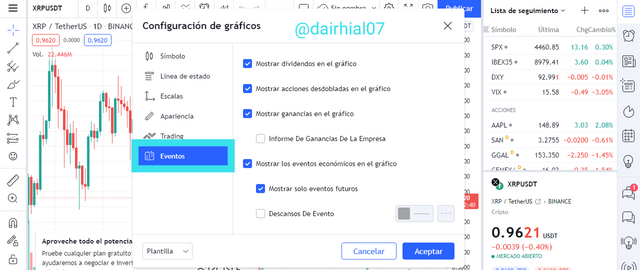
• Events: And finally we have our events tool, where we can adjust or modify certain elements of our graph, such as:
✓ We can allow or not, to show us in our graph the economic events of the same.
✓ We can also choose to show us future events
✓ As well as profits and dividends.
We also have other settings that I think are very useful for our graph, some of them are:
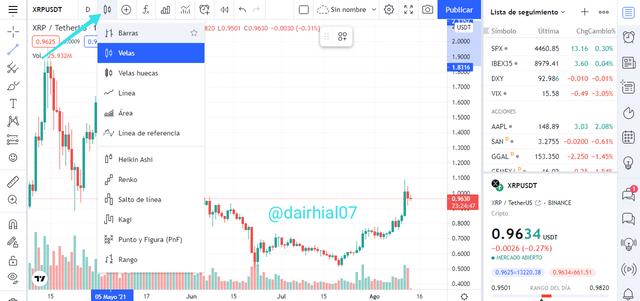
• Candles: Here we can find all the types of candles that we can add to our chart, the most popular are:
✓ Hollow candles
✓ Bars
✓ Lines
✓ Heikin ashi, etc
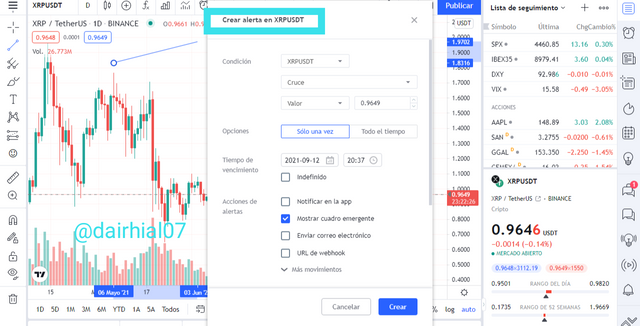
• Price alerts: As its name implies, here we can set a price alarm for our currency, and we can adjust certain tools for it, such as:
✓ Set the alarm for an indefinite time or for a specific period.
✓ We can set the date and time we want
✓ We can also establish other alert actions such as showing notifications, receiving an email, etc.
On the left side of our graph we can find a row with another series of settings and tools to edit our graph, I am going to name the ones I use the most and the most important:
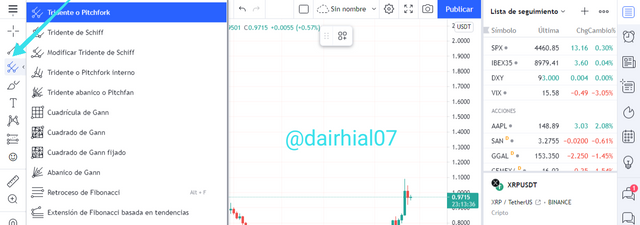
• Pitchfork pitchfork: Here we can include in our graph some settings such as some pitchforks, the most popular are:
✓ Trident Schiff
✓ Internal pitchfork or pitchfork
✓ Fibonacci retracement
✓ Trend-based Fibonacci extension
✓ Gann square, etc
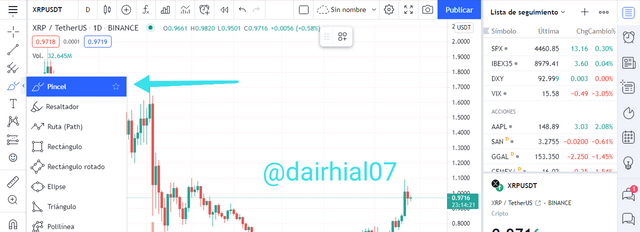
• Brush: In the brush area we are going to edit our graphic with the settings that it offers us, which are:
✓ Brush
✓ Highlighter
✓ Rectangle
✓ Triangle, etc.
All these adjustments can be applied to our graph to recreate a configuration in our own way.
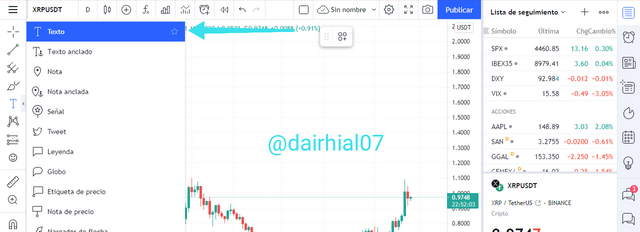
• Text: This is one of my favorite tools within the graph settings, since here I can add text to my graph to determine certain data.
Best of all, we can choose the signature that we like best to add text or information to our graphic.
Now to fulfill the part that the task indicates, we are going to proceed to add two configurations to our graph:
• In this case I am going to go to the settings adjustment, and in the appearance section I am going to change the background of my graph.
• As we can see, we get a wide range of colors to choose from, in this case I decided to choose a dark tone:
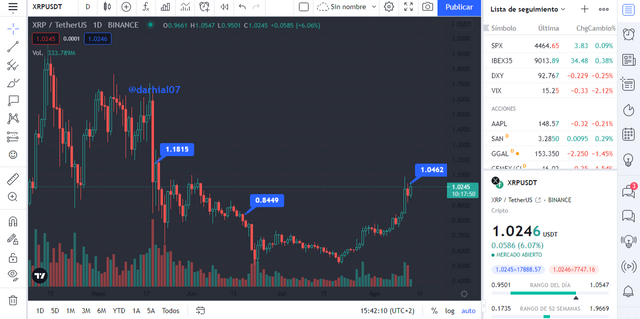
• Now I will go to the text tool where I am going to place certain price labels on my chart to determine the different prices that the coin has had.
Also take advantage of placing my username or my watermark on the graphic, through the text tool
• Now configure my chart to change its candles, therefore I will go to the candles section and choose the one I prefer, in this case I chose the hollow candles.
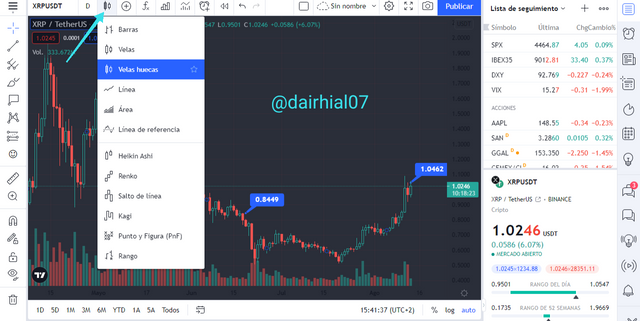
This is how my graph was after having edited and configured it, we can see how it changed noticeably to the normal graph that I presented previously:
4) How do you add an indicator to the chart?
We all know that technical indicators help all investors or users around the world to be able to predict or calculate future trends that the market of a certain currency may have, therefore, it is important that we know how to configure our indicator in order to operate. successfully.
To add a technical indicator to our chart is really simple, we just have to follow the following steps:
• At the top of our graph we will find a series of tools at our disposal.
• We are going to click on an item that is "Fx"
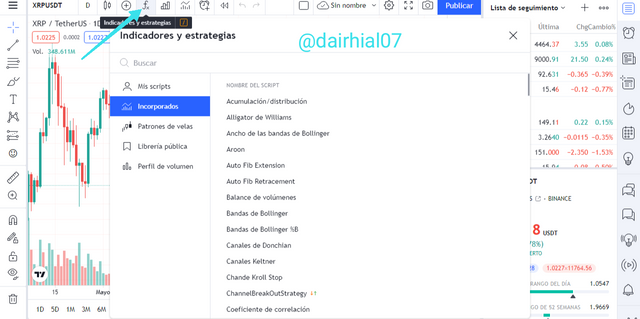
• As we can see, we will get an interface with the indicators and strategies that we can apply to our chart.
• A small search engine will appear, where we are going to place the name of the indicator that we want to add.
• In this case I will look for the "ichimoku-kinko-hyo" indicator, but it is available as "ichimoku cloud"
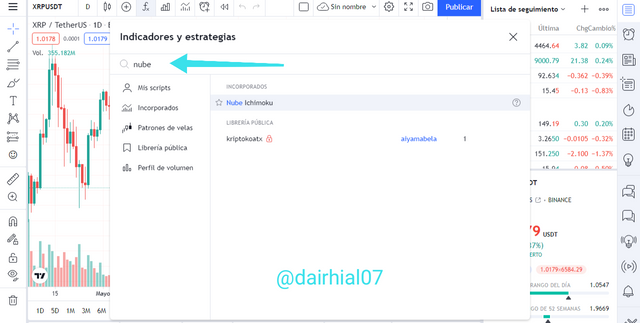
• I click on the indicator, and it will automatically appear on our chart.
• However, it is important to clarify that we can configure our indicator according to our techniques, for example:
We have three tools to configure it, which are:
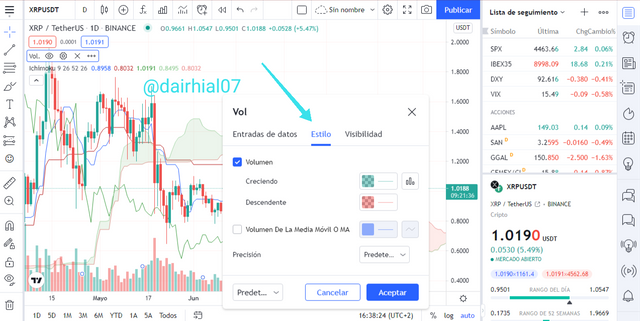
• Data inputs: Here we can configure the length of our indicator, in addition to changing it with the number or length we want.
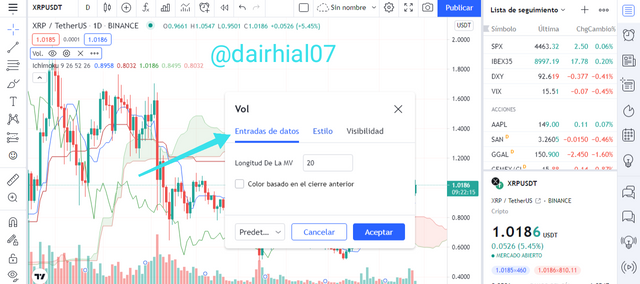
• Style: In this tool we can change the color of our lines, as well as indicate if we want our graph to have volume lines.
We can also add the moving average line or MA, everything will be our way of working.
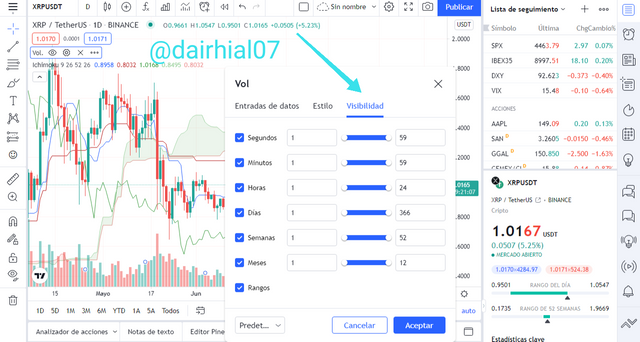
• Visibility: And finally we have the visibility tool, where we can indicate the hours, seconds, minutes, or even months of the visibility we want of our indicator on our graph.
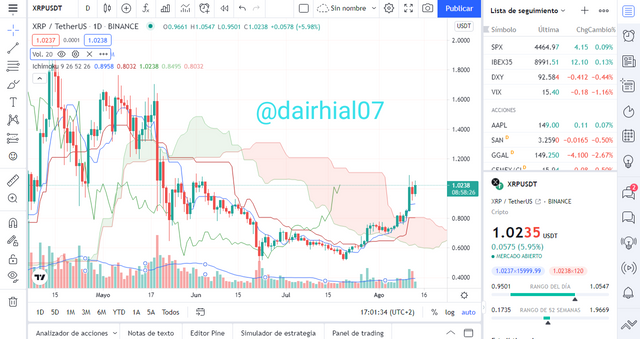
After configuring all the settings we want from our chart, we can start trading successfully. This is what my chart with the "Ichimoku-Kinko-hyo" indicator looks like:
• What is your favorite indicator and why?
My favorite indicator is the "ichimoku-kinko-hyo" which I had the opportunity to learn in an incredible class, since this indicator tells us about balance, and from there it is based on explaining that Every trend, no matter how regular it may be, returns to equilibrium.
The ichimoku-kinko-hyo helps us predict or calculate future trends in order to operate at the right and precise time, this indicator has 5 lines that are the main data that will help us predict said holding, which are:
• Tenkan Sen
• Kijum Sen
• Senkou Span A
• Senkou Span B
• Chikou Span
Each of these lines has a different meaning, which will help us determine this trend in the market. This indicator is characterized to operate in a long or short period of time, depending on how the user works.
It is one of my favorite indicators because it is very complete and apt to predict future trends in the market, thanks to its smoke clouds called "Senkou Span A" and "Senkou Span B" we can calculate in what direction the market trend will go. This indicator is very old and very little recognized, and perhaps it can be difficult to understand, however, once we understand each of the lines that will help us predict trends, I am sure that we will see successful results.
This indicator can also be combined with other technical indicators, an example of this is the indicator (RSI), however, everything will be at the discretion of the user or the investor, since we can also obtain excellent results through it alone.
5) Do you think TradingView is useful for predicting the cryptocurrency market (trend / price)?
TradingView is an incredibly good platform that offers us tons of tools and settings so that we can trade easily but completely efficiently. I had already been working with it for some time but perhaps I had not explored so thoroughly each of the features that we can use, and I can only say that YES, that TradingView is very useful for us users to predict the different trends that a market may have.
Thanks to the implementation of technical indicators and thousands of adjustments through our chart, we can predict or calculate future trends that are approaching, so that we can know when we should trade. We must thoroughly explore each of the tools that this platform offers us, since I am sure that we will get the most out of it.
We all know that the cryptocurrency market is very volatile and difficult to predict, however we can have at our disposal several techniques that help us with this type of activity, and that is why TradingView provides us with all the necessary tools so that we can carry out carry out our operations.
This platform adapts to the level of knowledge that the user may have, therefore, we can see all the options that they offer us so that we can operate through it in a very satisfactory way, as well as the different payment plans that we have to our disposition with much more advanced and developed tools, that is, we can choose the one that best suits our development.
So to conclude with this question I want to say that TradingView is highly trained so that millions of users around the world can perform operations on our finances, in order to obtain gratifying results.
Conclution
To keep track of our finances we must look for the best platforms to achieve a balanced development, and that is why TradingView is part of that group of platforms that help us obtain excellent results in our finances, therefore, it is a platform that It is highly trained so that we can obtain a pleasant experience through it, and at the same time helping the financial ecosystem to develop more and more.
TradingView works with both financial worlds, such as centralized and decentralized, since it offers us to operate with both parties, therefore, it is an open page and fully capable of offering us the best of both worlds, with the implementation of thousands of tools. and settings for our setup.
In the class of the teacher @yousafharoonkhan we were able to see all the benefits that this platform offers us, that is why in my homework this week I was able to explore more in depth about all its uses, and I learned a lot about each of the tools that it offers us at our disposal. That is why I thank the teacher for such an incredible assignment given this week, where we were able to explore this platform further.
It was an honor to participate and have attended, until next time.
Twitter: https://twitter.com/DairhiS/status/1426251027557322761?s=19
Respected first thank you very much for taking interest in SteemitCryptoAcademy
Season 3 | intermediate course class week 7
these line will be helpful for new user to use , your favourite indicator in technical observation at the time of trade
• Tenkan Sen
• Kijum Sen
• Senkou Span A
• Senkou Span B
• Chikou Span
Each of these lines has a different meaning, which will help us determine this trend in the market. This indicator is characterized to operate in a long or short period of time, depending on how the user works.
thank you very much for taking interest in this class ,
Thank you very much teacher, it was an honor to participate!!