[Repost] -- Trading Using Wedge Pattern - Crypto Academy / S5W5 - Homework Post for @sachin08

In this post, I will publish the homework from professor @sachin08 that I have completed.

1. Explain Wedge Pattern in your own word.
Wedge is a price pattern characterized by the tendency of trend lines on the price chart to converge. Two trend lines will be drawn at an angle to connect the highs and lows of the previous period. These lines indicate that the high and low are rising or falling, and at different speeds. As these lines approach convergence, they take the form of a wedge. The wedge shaped trend line is considered a useful indicator for technical analysts with the potential to reverse price action.
The wedge pattern can indicate a bullish or bearish price reversal. In both cases, this pattern has three common features, firstly, convergent trend lines. Second, the pattern in which the volume of transactions decreases with the price trend. Third, a break of one of the trend lines. The two forms of a wedge pattern are an rising wedge and falling wedge.
For example, ETH/USDT has been on a downward trend over the past year. However, over the past month, it has been trading in an uptrend, forming an uptrend which could indicate future bearish price action. You can enter a limit order when the price drops below a downtrend line or a support trendline, and a stop order when ETH/USDT rises above a resistance trendline.
On the other hand, let's say BTC/USDT has been on a downward trend for the past two months. This pattern is usually an indication of future bullish price action. You can enter a limit order to buy when the price rises above the resistance line and stop orders when the price drops below the trend support line.
2. Explain both types of Wedges and How to identify them in detail. (Screenshots required).
- Rising Wedge
Most people think of the rising wedge pattern as a reversal pattern from an uptrend to a downtrend. This happens with the price range narrowing, the price is between the two lines that meet when the pattern appears. Such a process indicates a decrease in momentum and usually prices that are in an Uptrend will experience a decline first.
The rising wedge pattern can be seen when the price consolidates in the area determined by the upward sloping support and resistance lines. Higher lows form faster than higher highs and make the support line steeper than the resistance line. In this way, the candle will form a pattern that looks like a wedge.
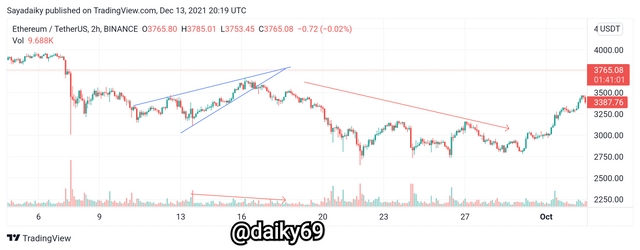
In the chart above we can see that the price of ETH is in an Uptrend, but there has been a sharp decline in the last few days. The price then went back up by creating a new high and a new low, the candle then tapered which was bounded by two upward sloping trend lines. There are three points on the upper trend line touched by the candle and two points on the lower trend line. Then the trading volume seems to have decreased which indicates that this is the finishing of the rising wedge pattern.
Rising Wedge Features:
In general, the direction of the wedge adjustment as a relay pattern is opposite to the long-term price trend, that is, the rising wedge appears in an uptrend that seems to be starting to decline.
In the process of consolidation in the form of a rising wedge, the high and low points of the price move up alternately, and the upper and lower sides of the wedge form upwards.
The top and bottom edges of the rising wedge must be significantly joined. If the shape is too loose, the shape is less likely to form and can develop into other finishing patterns.
As with other consolidation patterns, prior to the formation of the rising wedge, the price had been experiencing a sizeable decline for a period of time.
The time for the rising wedge is generally more than 20 trading days, and during the formation process, the trading volume gradually decreases.
In the form of the rising wedge, one wave of the consolidation wedge is higher than the other, and it looks like the price is going to break upwards. And at the end of the wedge, the price suddenly drops with volume.
- Falling Wedge
This is the opposite of the rising wedge, the falling wedge mainly occurs in a downtrend. The local maximum of the downtrend (lower high) forms bearish resistance and the local minimum of the downtrend (lower low) forms bearish support. The slopes of support and resistance must differ significantly from zero.
Similar to an upward wedge, and we are advised that price should test support and resistance five times, although there are other theories that say it doesn't have to be 5 times. In the process of forming the pattern, the trading volume tends to decrease.
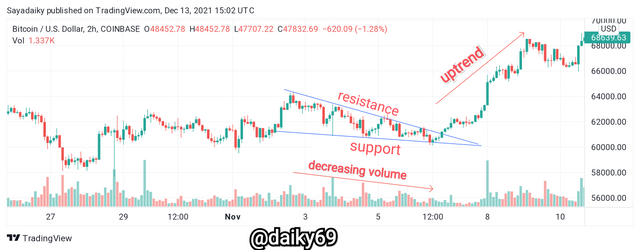
In this image we can see that a falling wedge pattern formed, a reversal then occurred. The candle looks tapered downwards as if the market will be more bearish and will not get out of the downtrend yet. The price tested resistance and support several times in a tilted state, until it finally broke through the resistance level.
Falling Wedge Features:
The falling wedge reversal pattern should be preceded by a strong bearish trend, which will form a final low. The reliability of this pattern is directly proportional to the period of time during which the trend exists. That is, a figure that has been preceded by a marked bearish trend for at least a month is significant for technical analysis.
The figure must form at least two, and preferably three, corrective highs, on which the upper resistance line will be built. In addition, each subsequent maximum must be lower than the previous one.
Also, the figure should form two lows through which the lower support line will be drawn. In this case, the second minimum must be lower than the first.
The upper resistance line and the lower support line should meet and form a cone as the pattern develops. Although the new lows will be lower than the previous ones, the downward movement will fade, indicating a decrease in the bearish pressure in the market. Thus, the slope of the lower support line will be smaller than the upper resistance line.
The falling wedge received final confirmation on breaking the upper resistance line, which should be accompanied by a significant increase in trading volume. Since it was broken, the upper resistance line has turned into a support line for the next possible correction on the bullish trend.
3. Do the breakout of these Wedge Patterns produce False Signals sometimes? If yes, then Explain how to filter out these False signals.
Actually, almost no analytical tool provides 100% accurate signals, this we have almost always mentioned in previous posts. The same is true for the wedge pattern, so we should use other indicators to confirm the signal given by the wedge breakout.
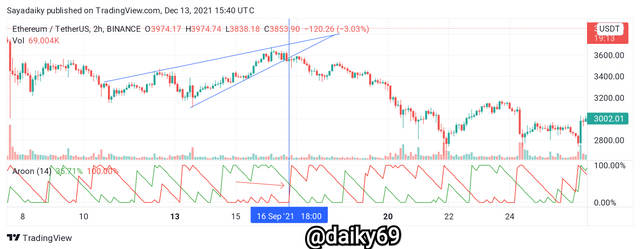
In the chart above we can see that the breakout signal of the rising wedge is well confirmed by the Aroon indicator. Thus we can be sure that the signal from the rising wedge is an accurate signal. If indeed we are still in doubt, it is okay to use several indicators at once in order to get more perfect and accurate results.
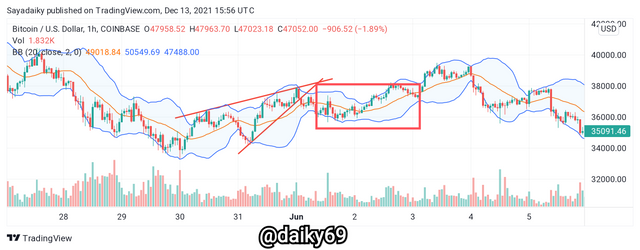
In the example above we can see that the rising wedge gave a false breakout signal, the price which should have fallen sharply after breaking the support level did not act like that. What happened was that the market continued to consolidate, this was confirmed by the Bollinger bands indicator with a narrowing of the upper and lower bands indicating a decrease in volume, then the candle also broke through the middle line again.
This is proof that the breakout signal from the rising wedge is not always true, and other indicators can be used as a reference to filter out these false signals. I proved it with the BB indicator which is able to filter out these false signals.
4. Show full trade setup using this pattern for both types of Wedges.(Entry Point, Take Profit, Stop Loss, Breakout)
Trading using the wedge pattern is the same as trading with other patterns or signals from other indicators. The first thing we should pay attention to is the point where the breakout occurs, after which we must immediately enter the market. For more details, look at the image below.
- Rising Wedge
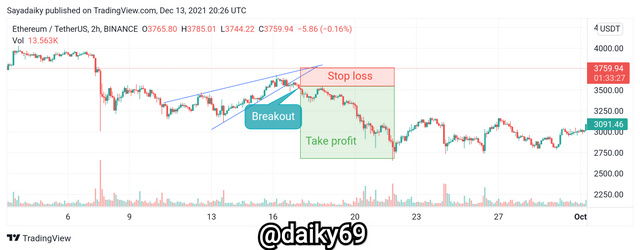
This pattern is formed in a market that is in an uptrend then slightly decreases, the price will then consolidate and try to go back up. If we are dealing with a rising wedge signal, then after the breakout we can place our take profit below the support level and stop loss right at the resistance line or slightly below it. By looking at the graph above, I think you will understand it easily.
- Falling wedge
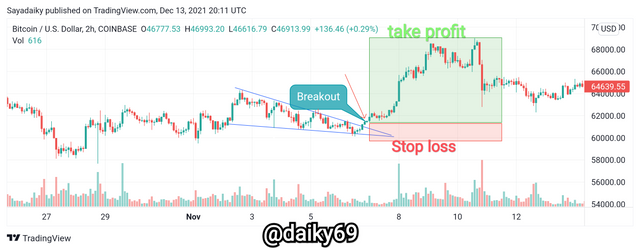
A falling wedge that forms after a downtrend, it is a trend completion figure, because it indicates an attempt by the price to move down, due to increased buyer activity at a certain price level. It turns out that previously the volume of sellers pushed the price down relatively freely, now they are shifting it down by a very small amount.
If the price breaks the resistance line of the Falling Wedge, it is recommended to buy on the next retest with the price border of the pattern being broken, meaning that after the breakout occurs we can place a buy order with take profit set above it. Stop loss should be placed at the support line of the falling wedge.
For example, look at the graph above. In the chart I have done a trading simulation that we have to do using the falling wedge pattern.
To find the risk-to-reward ratio for a trade, we need to determine the approximate profit-taking point.
Conclusion
The wedge pattern is not as popular as some other trend continuation patterns. But, in terms of reliability and stability, it is not inferior to other patterns. The more elements of technical analysis we have, the more trading opportunities open up before us. The trend after consolidation can continue or vice versa. Who knows, maybe the wedge pattern will give us this first signal.
I also want to thank professor @sachin08 who has raised this theme, to be honest this is a valuable lesson for me personally because it can add to my knowledge of technical analysis.