[ Advanced Technical Analysis Using Fractals ] - Steemit Crypto Academy | S5W8 | Homework Post for @reddileep

Hi guys!
This is the last week of season 5 of the crypto Academy, it's a shame that almost all cryptocurrency assets are experiencing a bearish trend. But we don't need to be sad because as we know that crypto prices always repeat themselves. That is why we can find Fractal patterns in financial assets, especially crypto.
This post I address to professor @reddileep, which is to complete the task he gave for this week.

1- Define Fractals in your own words.

The prices of cryptocurrencies or other financial markets are difficult to predict and random, but in reality they always create repeating patterns and trends. Of the many patterns that we can use to analyze trends, one of them is fractal patterns. Basically, fractals are broken down into larger trends into very simple and predictable reversal patterns. Fractals or repetitions that occur in crypto assets are actually not surprising, because in the real world there are also many Fractals that can occur.
For example, like the world of football, there are even some goals that look very similar to other goals, both in terms of the scoring process, timing, movement, style, etc. Almost 100% equal to goals scored by other people at different times. This is what is called Fractal, in cryptocurrency this also applies.
While this concept applies to markets, most traders take fractals more literally. That is, in the form of repeating patterns that can predict reversals between larger and more chaotic price movements. Simply put, it is to determine a reversal signal, a simple fractal pattern consisting of 5 candles. This is what underlies traders to analyze to determine the trend.
If we can understand the structure of the fractal, we will be able to know which wave to catch on which time axis, so it will be clear what to wait for and the accuracy of the entry will increase. It also makes it clear where to put the stop-loss line and where to take profit, reducing doubts about the trade
On candlestick charts, we can use bearish and bullish fractal patterns. However, we must admit that finding fractal patterns independently is very difficult, so we can use fractal indicators to find these patterns, there are many indicators that can be used, one of which is the Williams Fractal.
The default fractal is a five candle formation (more than 5 is fine, no less) we should wait for the fifth candle to close before making any trading decisions. This is due to the fact that the price may change during the formation of the fifth candlestick. If the price goes beyond the higher high, or falls below the lower low, the fractal indicator will disappear from the price chart. Therefore, we need to wait for the completion of the fractal formation.

2- Explain major rules for identifying fractals. (Screenshots required)

As I briefly mentioned above, a fractal pattern must consist of 5 candles or more, if it is less than 4 candles it will not be considered a fractal. Next, we can identify fractal patterns if the 5 candles follow the structure or meet the fractal requirements.
Bullish Fractal
A bullish Fractal pattern is formed when there are 5 or more candles with certain characteristics, the middle candle must close lower than the other two candles on its side. Or in other words, the middle candle must be the lowest low and the two candles on its side are the higher low. Look at the following illustration.
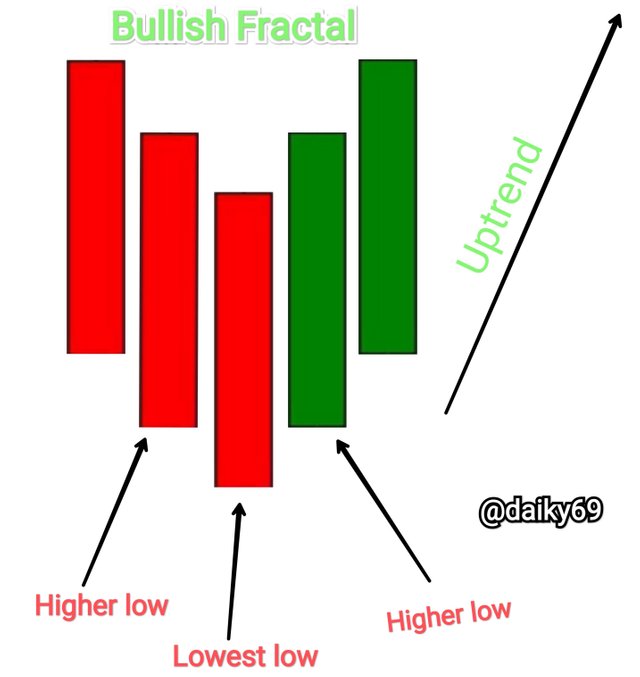
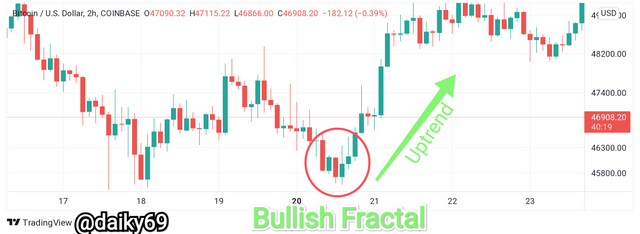
The real example in the chart below has identified a bullish Fractal pattern. The opening price of the middle candle is lower than the two candles on its side.
Bearish Fractal
The Bearish Fractal pattern will form in the market if there are 5 candles with several characteristics, the middle candle must close higher than the other two candles on its side. Or in other words, the middle candle must be a higher high while the two side candles must be a lower high. For more, see the illustration image that I have made below.
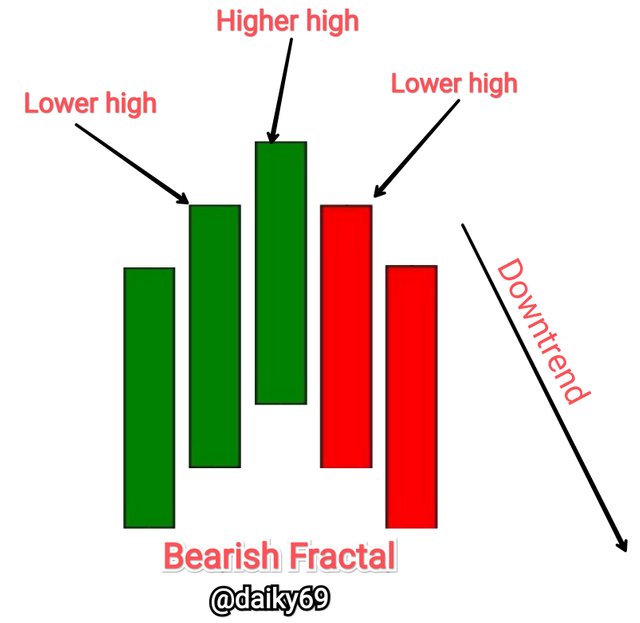
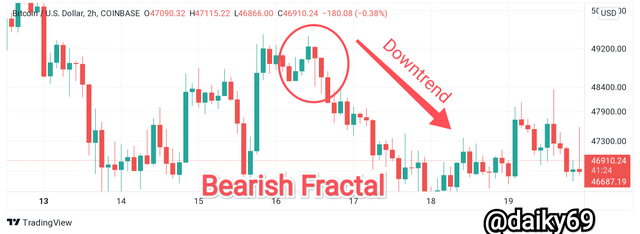
For a real example, take a look at the chart below which has indicated a Bearish Fractal pattern formed with more than 5 candles.

3- What are the different Indicators that we can use for identifying Fractals easily? (Screenshots required)

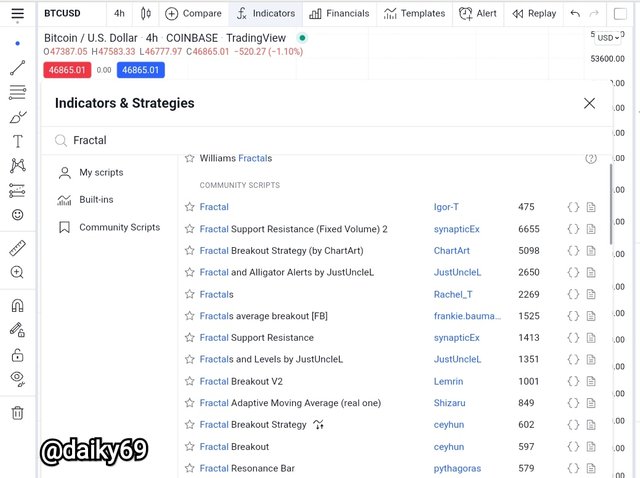
There are lots of fractal-based indicators that we can use, therefore I will choose some of the most widely used fractal indicators to explain in this post.
1. Williams Fractals
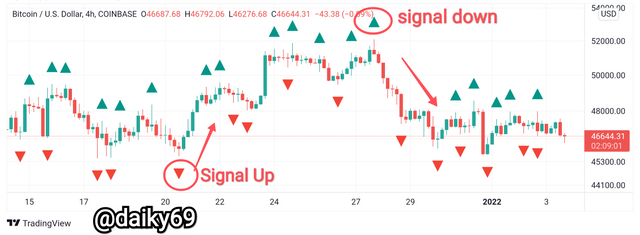
The display of the Williams Fractals indicator is quite simple, there are green and red arrows, the color is called Fractal Up and the red one is called Fractal Down. Each of these arrows represents a fractal. The indicator automatically draws fractals based on 5 candlesticks, so the frequency of fractals on the chart is very high. We can also adjust how many candles are contained in the fractal indicator.
This is not as easy as we imagine, because the use of this indicator must be coupled with other indicators to filter the signals generated so that we are not trapped by false signals generated by Williams Fractals.
2. Fractal Breakout by Ceyhun
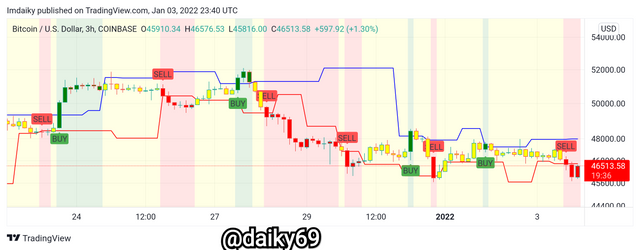
This version looks more attractive, but I don't think how good this indicator works in generating signals. The Fractal Breakout by Ceyhun indicator looks to have two lines above and below with red and blue colors (which we can change).
There are also buy and sell signals that we can see clearly on the indicator, so when the price breaks the upper line (blue) which serves as a resistance level, then this is a buying point, or a signal to enter the market immediately. And if the price drops below the red line which acts as a support level, then we are advised to sell it.
3. Fractal Support Resistance by SynapticEx
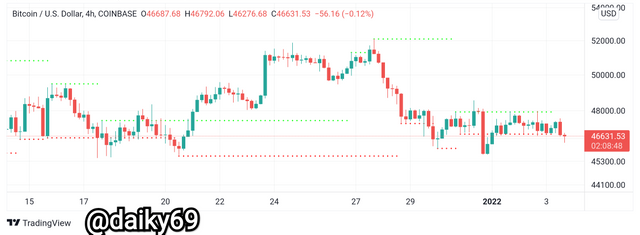
We will see the green and red dotted lines, these lines show the support and resistance levels of Fractal. When the price moves through these lines we must take immediate action. For example, when the price breaks the green line which functions as a resistance level, we must immediately place a buy order. And if the price breaks the red line which serves as a support level then we have to get out of the market immediately. Do not place an order if the price has not broken through these two lines, because at the completion of the next candle the price will go down or up.

4- Graphically explore Fractals through charts. (Screenshots required)

This time we will not use the help of indicators to find Fractal patterns on cryptocurrency charts, but we will look for them independently consisting of 5 candles. We have explained the characteristics of Fractals above, so now we will look for them in the graph based on the characteristics mentioned above.
Bullish Fractal
For a bullish Fractal, the middle candle must close with the lowest low price, while the other two candles flanking it on the left and right must be higher low. In addition, the fractal pattern must also consist of 5 candles or more, not less.
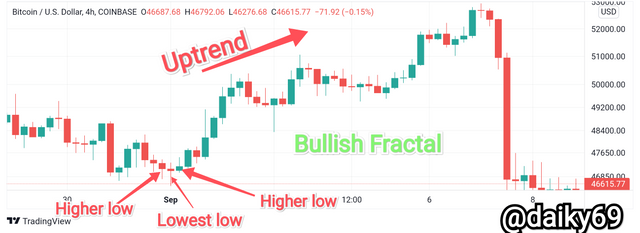
I've marked the Fractal pattern on the BTC chart with a time of 4H. After I looked carefully, the middle candle closed at the lowest low price, then the two candles on the left and right sides that flanked it closed at a higher low price. This is clearly a Fractal pattern, then the market broke and the asset immediately went into an uptrend.
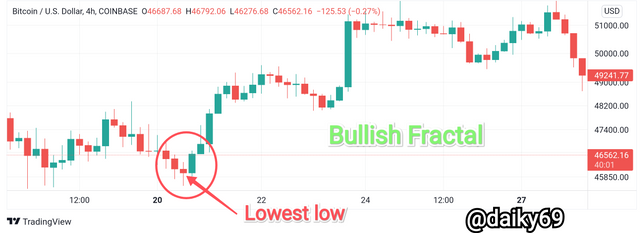
This is also a Fractal, it can be seen that the bullish Fractal immediately reacted properly, namely the price immediately experienced an uptrend after the Fractal pattern was formed perfectly.
To see the Fractal or similarity of past prices, we can use the Bar Pattern provided by the TradingView platform. Here I will immediately show the similarity of prices that occurred in the past with current prices after we detect a Fractal.
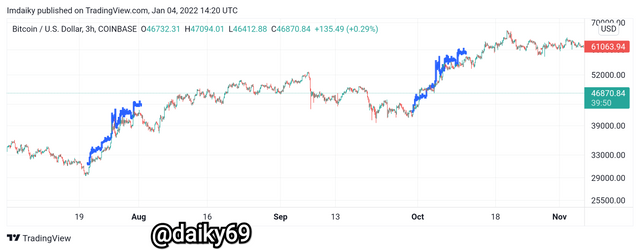
In the chart above we can see that the past chart/price almost 70% resembled the chart/price just after the Fractal occurred. This is the same chart described above, only I have to zoom out to see the history of past prices.
Bearish Fractal
The characteristic is that the middle candle closes at a higher high, while the two side candles close with a lower high. The pattern must consist of 5 candles or more, if this is less then it will not work as it should.
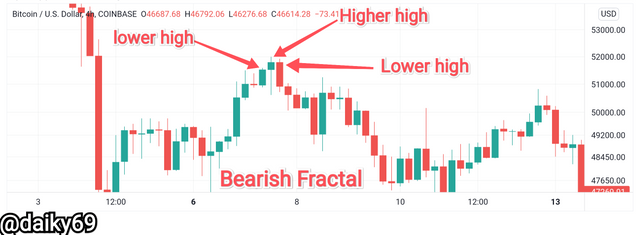
In the BTC chart above, we can see that the Fractal pattern is perfectly formed, the candle is more than 5 and the middle candle closes with a higher high, while the two candles flanking it on the left and right sides are closed at a lower high. Then after the Fractal bearish structure was formed perfectly, the price immediately experienced a downtrend.
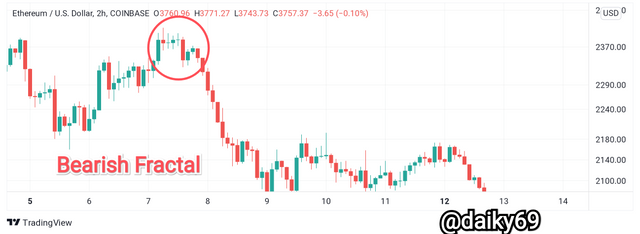
Here we can also find Fractal patterns, but we have to pay attention to them very carefully because the middle candle which should be a candle with a price that closed at a higher high even has a very small real body.
Now we will see where the similarity occurs, for that we will again use the Bart Pattern to detect the similarity of prices in the past with prices after the occurrence of the Fractal.
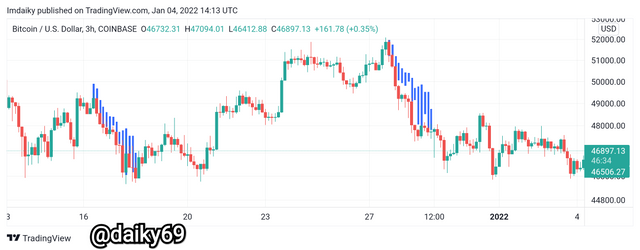
Although the similarity is not 100%, we can see that the Fractal pattern really works well on crypto charts. In the chart above, it is clear that there was a similarity in the past price with the price when the Fractal occurred.

5- Do a better Technical Analysis identifying Fractals and make a real purchase of a coin at a suitable entry point. Then sell that purchased coin before the next resistance line. Here you can use any other suitable indicator to find the correct entry point in addition to the fractal.
(Usually, You should demonstrate all the relevant details including entry point, exit point, resistance lines, support lines or any other trading pattern)

To make live trades, I will be using the Huobi platform. Here I will choose LUNA/USDT, because after analyzing the token I see that there is an appropriate entry point. For more details, I will show some graphs below.
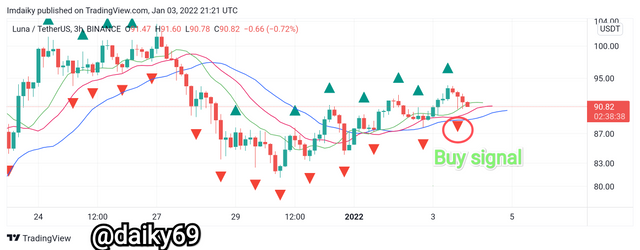
On merging the Williams Fractals with the Williams alligator, I get an entry point that can be used to place a buy order. The Fractal indicator marks it with a red arrow which is an uptrend signal, and the alligator also looks to be opening its mouth although it is not too wide but can be used as a signal to enter the market.
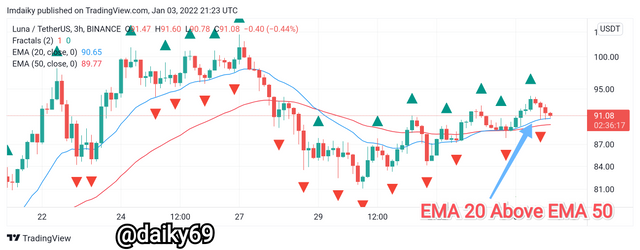
To be more convincing, I combined the Williams Fractals with the EMA of 20 and 50, here it is also seen that the EMA 20 is above the EMA 50 which indicates a bullish trend.
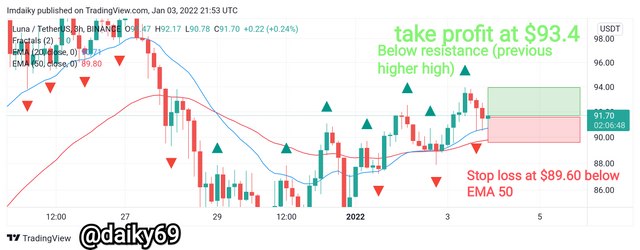
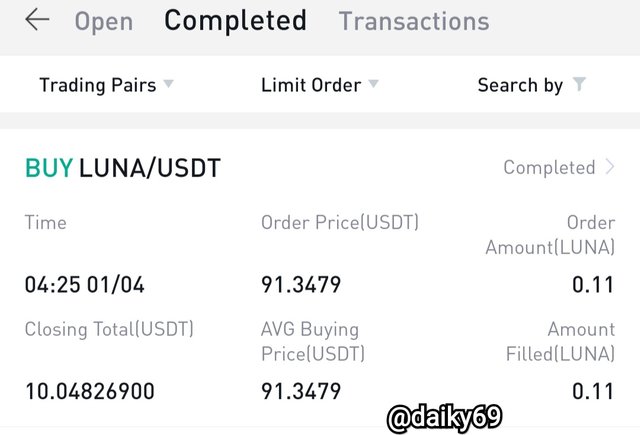
My entry was at $91.3479, after I managed to make a purchase, I immediately placed a sell order at $93.4, this is right below the resistance level (previous higher high). Then I place my stop loss at the level of $89.6, this is right below the dynamic support level provided by the 50 EMA.


Conclusion

We can rely on fractal patterns to see reversals, but they are not as easy as we think because these patterns sometimes don't work properly. Finding Fractal patterns independently on the chart is a bit difficult, that's why we can use some special Fractal indicators designed to find Fractals.
One of the most popular Fractal indicators, namely Williams Fractals. This indicator is widely used by traders because of its ease and accuracy in providing reversal signals, but the author of the indicator advises us to combine Williams Fractals with other indicators such as the alligator and other indicators to filter signals.