Crypto Academy Season 4 : Week 3 | Homework Post for professor @sapwood | On-chain Metrics (Part 2)
Yesterday I go through the lecture taught by our respected professor @sapwood which is all about On-chain matrices and here is my homework post in this regard, so let's begin with it without wasting much time;


Question no 1
What is the difference between Realized Cap & Market Cap, How do you calculate Realized Cap in UTXO accounting structures? Explain with examples?
Market Cap
Crypto market capitalization is a good way to figure out how much a cryptocurrency is worth. The total circulating quantity of a coin is multiplied by its price to determine its market cap. It may indicate if a cryptocurrency has opportunities for development as to whether it is worth investing in hazard, competitive landscape, and acceptance. The market cap, on the other hand, represents the overall worth of any commodity. As it is a representation for communications and information and a basic indication of several elements, market capitalization is highly essential.
Realized Cap
Every whenever an unexpended cryptocurrency gets exchanged, there is a change in realized cap. This realized cap seems to be the amount wherein the entire volume of moving coins is multiplied by the value at which it was last passed rather than the current market value of the coin, and the aggregate of most of the multiplications being regarded the realized cap. The Realized Cap is used to arrive at a somewhat accurate asset assessment. The worth for every UTXO just at moment which was last transferred is used to calculate the Realized Capital.
Difference between Market Cap & Realized Cap
| Realized Cap | Market Cap | Realize cap reflects the true worth of blockchain technology. | Market cap shows a real market value. |
|---|---|
| The value of every unspent transaction output at a moment which was last transferred is used to calculate the Realized Capital | Market capitalization is just the entire supply multiplied by the market valuation. |
| Realized cap can be computed on blockchain commodity with a unspent transaction output record. | Market cap may used to computed any commodity posted on the exchange. |
| The Realized cap is often used to estimate the asset's worth. The Realized capitalization technique determines value in a real manner.. | The term "market capital" is commonly used to describe how much a crypto commodity really worth. |
Calculation of Realized Cap in UTXO Accounting Structures
Consider if DOT has an aggregate of 37 UTXOs as well as a circulating supply of 37 DOT.
- Then if 5 DOT hasn't relocated since 2008 when these were processed and its valuation was 14$,
- 9 DOT hasn't relocated since 2014 when these were processed or acquired and the price of DOT was 36$,
- 10 DOT hasn't relocated since 2016 when these were exchanged and it's price was 184$,
- 13 DOT hasn't switched since 2020 when these were processed the price of DOT was 272$.
Next,
| Date/Year on which UTXO hasn't relocated. | Amount of UTXOs | On such date, price | UTXOs Amount * Price | 2008 | 5 | 14$ | 70 |
|---|---|---|---|
| 2014 | 9 | 36$ | 324 |
| 2016 | 10 | 184$ | 1840 |
| 2020 | 13 | 272$ | 3536 |
So,
Realized cap = (5 x 14) + (9 x 36) + (10 x 184) + (13x 272) = $5770.
Question no 2
Consider the on-chain metrics-- Realized Cap, Market Cap, MVRV Ratio, etc, from any reliable source(Santiment, Glassnode, etc), and create a fundamental analysis model for any UTXO based crypto, e.g. BTC, LTC [create a model for both short-term(up to 3 months) & long-term(more than a year) & compare] and determine the price trend/predict the market (or correlate the data with the price trend)w.r.t. the on-chain metrics? Examples/Analysis/Screenshot?
The Realized Capital
Short Term Chart (3 Months)
Screenshot captured from Santiment
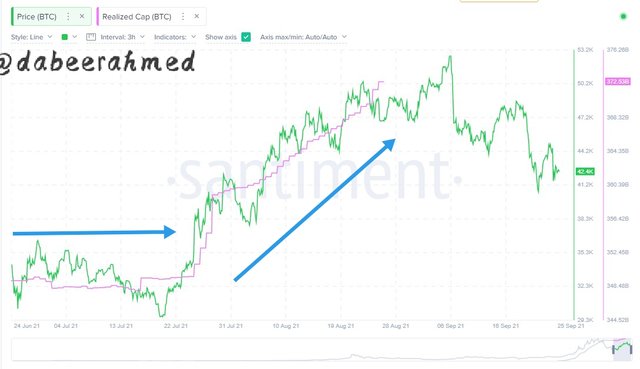
A realized capital is an on-chain metrices which determines the true value of a network by considering the actual price of unspent coin (UTXO) or we can also say that the whole value of assets that were last traded is known as realized capital. The link between the realized cap and price movement is also affected by market phase.
The purple line in the above screenshot depicts the realized cap, while the green line depicts the coin's price. In the upper left corner of the chart, there is a box that displays the price of the coin as well as the realized cap of that point. Moving the cursor to various places will display the current price and realized cap of that currency. If you look at the chart closely, you can see that the price of bitcoin varied between 41,331 and 38,015 from August 1 to August 3, indicating that the price was moving sideways. This demonstrates that while the price of bitcoin has dropped from 41k to 38k, the realized cap has remained stable, which is also a positive sign of a buying opportunity.
Long Term Chart(2 years)
Screenshot captured from Santiment
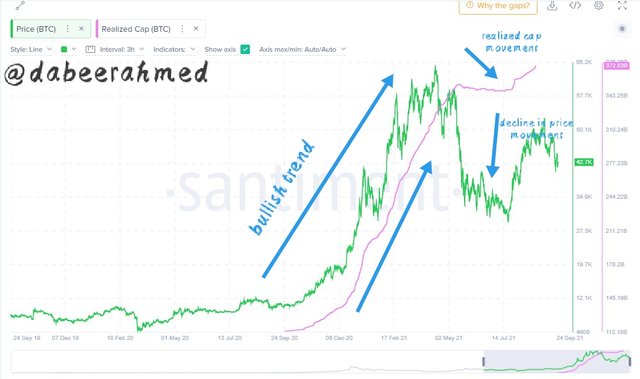
For a long-term analysis, I opened a chart from the previous two years, which reveals a consistent bullish trend from September 2019 to September 2021, as seen in the chart above. The chart's price movement is associated with the realized cap, which rises in lockstep with the price. If you look closely at the chart, you can see that the price of bitcoin is $12k on 4-October-2020, with a realized cap of $115.06 billion, but by 14-April-2021, the price is $64.4k, with a realized cap of $324.7k..
The most recent BTC decline was to $30.8k on July 20, 2021, while the realised cap remained at 349.5 billion. Bitcoin's current bullish upswing has sent it up to $50.4k, with a market capitalization of 369.5 billion dollars.
The Market Capitalization
As previously stated, market capitalization is an on-chain matrix that expresses the total available coin in the market at the current price and so represents the market value of the currency.. It also helps the trader wheather the coin is safe to invest or is just a scam. The link between the market capitalization and price movement is symmetric.
Short Term Chart (3 Months)
Screenshot captured from Santiment
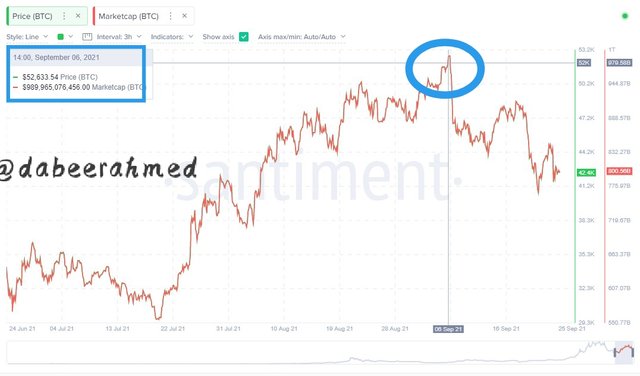
The market cap chart is simple to interpret because the price movement and the market cap are the same and has no difference. As you can see in the above screenshot, the market cap moves in lockstep with the price; as the market cap falls, the price falls with it, and when the price rises, the market cap rises with it.
If you look closely to the chart at 6-september-2021 the price of bitcoin is $52.6k and the market cap is $989 billion and if we look at 12-september-2021 the price of bitcoin dropped to $44k which also results in dropping of market cap which dropped to $844 billion.
Long Term Chart(2 years)
Screenshot captured from Santiment
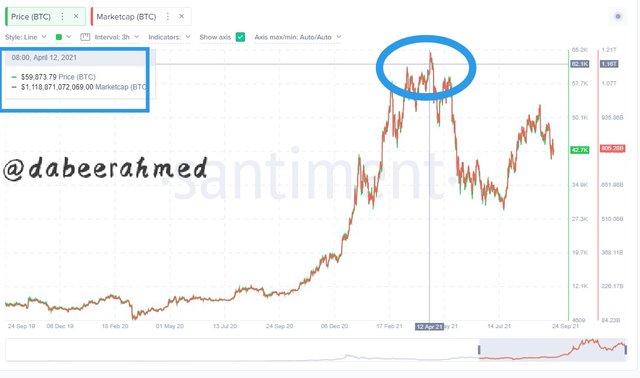
The long-term chart reveals the same association between price movement and market capitalization as the short-term chart. The price movement and market capitalization in the long term chart also reveal that they move in along each other.
If you look closely to the chart at 12-April-2021 the price of bitcoin is $59.8k and the market cap is $1.1 trillion and if we look at 19-july-2021 the price of bitcoin dropped to $29.7k which also results in dropping of market cap which dropped to $559 billion.
The MVRV Ratio
The MVRV ratio (Market Value Realized Value) is an on-chain matrices which is calculated by dividing market capitalization by realized capitalization. The average profit and loss ratio in the market is indicated by this indicator.
Short Term Chart (3 Months)
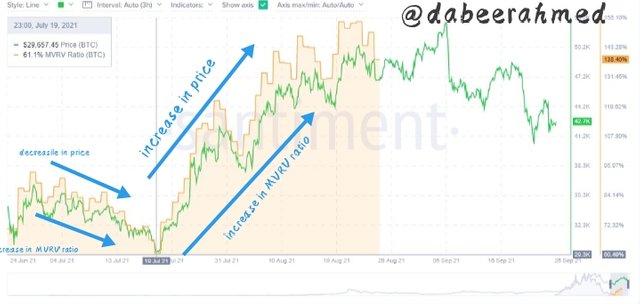
Screenshot captured from Santiment
The association between price movement and the MVRV ratio is readily visible in the chart above. If you look closely at the chart of 20-july-2021, you'll notice that the price of bitcoin decreased to $29.6k, resulting in a 61.1 percent decline in the MVRV Ratio, signalling a bullish move. And on August 23, 2021, the bitcoin price reaches $49.7k, with the MVRV ratio reaching 153.5 percent.
Long Term Chart(2 years)
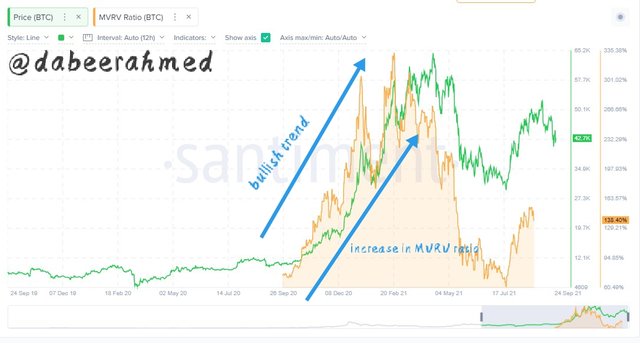
Screenshot captured from Santiment
As can be seen in the chart above, there has been a consistent bullish rise, which has historically increased the MVRV ratio. On February 20, 2021, the MVRV ratio reached 325%, while the bitcoin price was $52.9k. According to the preceding chart, the MVRV ratio's highs (peaks) are followed by a minor decrease in price movement, while the MVRV ratio's lows are followed by an increase in price movement.
Question no 3
Is MVRV ratio useful in predict a trend and take a position? How reliable are the upper threshold and lower threshold of the MVRV ratio and what does it signify? Under what condition the Realized cap will produce a steep downtrend? Explain with Examples/Screenshot?
MVRV Ratio and Price Trend
The market-to-real-value ratio is a measure for analyzing long-term cycles and determining how much profit the market is making in relation to the number of crypto assets transferred. The MVRV ratio is an on-chain indicator that has been used to predict market peaks and bottoms in the past. Simply said, MVRV is the ratio of market value to realized value. MVRV indicates if a commodity is overpriced or undervalued, and it may help you determine whether the market is nearing a top or bottom. The MVRV Ratio would be a more advanced form of NVT Ratio. That's the ratio of a network's market capitalization to its realized value. The term "realized value" refers to a market cap calculation in which tokens as well as rates are calculated through using actual price that commodity has just been exchanged just on network. The MVRV Ratio appears to be effective in identifying market conditions. Unless the MVRV Ratio rises above 100 percent, with higher lows and higher highs, it indicates a strong bullish trend. MVRV is an on-chain indicator that could be used to determine if a market is overpriced or underrated. If the MVRV Ratio falls below 100 percent and lower lows and higher highs occur, the market is strongly bearish.
Reliability of Upper Threshold of the MVRV Ratio
Once the market strategy gets rolling over its upper threshold, it means that it has broken the resistance level and then we will look for another to obtain the opportunity to sell. Even though market cap gets ahead decreasingly over realized cap over times, the upper threshold MVRV barrier may not be as dependable.
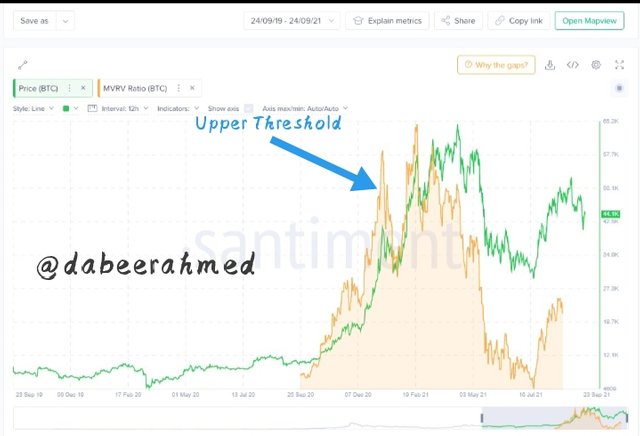
Screenshot captured from Santiment
The upper threshold of the MVRV ratio is not fully reliable, as shown in the above historic chart of bitcoin (from September 2019 to September 2021). This is because whenever the upper threshold occurs (as shown in the above image), it only comes before a slight decline in price movement, as the overall market is in a continuous bullish trend. This indicates that a upper threshold does not necessarily signify a prospective price reduction or a market selling opportunity. And clearly, now is not the time to enter in long. Rather than closing our open long positions, we should enable them to generate further profit.
Reliability of Lower Threshold of the MVRV Ratio
Once the market trend begins to move under the lower threshold, it really is identical to that when marketplace situation begins to go below the support level, that is when it violates the trend line or falls lateral below its lower threshold then we may enter a long position. We believe a lower threshold will continue to be effective in detecting assets devaluation throughout inter collecting periods.
.jpeg)
Screenshot captured from Santiment
The lower threshold of the MVRV ratio is reliable, as shown in the above historic chart of bitcoin (from September 2019 to September 2021). This is because whenever the lower threshold occurs (as shown in the above image), it only comes before an increase in price movement, as the overall market is in a continuous bullish trend. This suggests that the lower barrier denotes a probable price increase in both long term and short term, indicating a market purchasing opportunity.
Steep Downtrend of Realized Cap
.jpeg)
Screenshot captured from Santiment
When a crypto coin is bought at the lowest point in a downtrend market and sold at the highest point in an upswing market, the realized capitalization of the coin increases dramatically. Because whoever buys a coin at the lowest price in a downtrend market will almost certainly sell it when the price reaches its peak in an uptrend market to generate huge profits, causing a massive upward impact on realized capitalization.
Similarly, if a crypto coin is purchased at the peak of an uptrend market and sold at the lowest point of a downtrend market, the realized capitalization will experience a massive steep downtrend. Because anybody who buys a coin at the top of an uptrend market would panic sell it at the bottom of the downtrend market because they are frightened of losing all of their money, resulting in a massive sharp downward trend in realized capitalization.
Conclusion
On-chain matrices are a key instrument that traders use to analyze the market's position. On-chain metrices typically connect with price movement of the asset, according to demand and supply ideas. On-chain matrices have numerous advantages, including the ability to estimate the age of any crypto asset, as well as the ability to understand whether the market is bullish or bearish. The on-chain indicators of realized capitalization, market capitalization, and MVRV ratio (market value to realized value) are also main on-chain matrices used to determine the market and to to generate signals.
the market capitalization and the price movement move along each other while the MVRV ratio adds together a coin's average price over a period of time.'
That's all from my side and thanks for giving it a read.
Cc: @sapwood
Regards: @dabeerahmed
@sapwood please review my post