[Candlestick Patterns] - Steemit Crypto Academy Season 4 - Homework Post for Task 10
Thank you very much Prof. @reminescene01 for the lectures on the Japanese candlestick. It has really increased my understanding of trading using candlesticks.

Source


1a) Explain the Japanese candlesticks chart? (Original screenshot required)
b) In your own words, explain why the Japanese Candlestick chart is the most used in the financial market.
c) Describe a bullish and bearish candle. Also, explain its anatomy. (Original screenshot required)
1a.) Explain the Japanese candlesticks chart? (Original screenshot required)
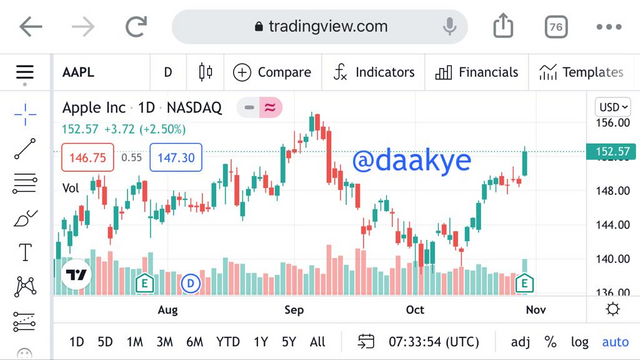
Source
The Japanese Candlestick chart was invented by one of the most successful traders in history named Munehisa Homma in the 1700s. He was also known as Sokyu Honma. The Japanese Candlestick Chart is the most widely used in the trading world.
Homma understood the basic demand and supply changes and also identified the fact that emotions played a key role in the setting of prices. So, he wanted to keep track of the emotions of the market players and this led to the establishment of the Japanese candlesticks.
The Japanese candlestick charts are used to determine the likely movement in prices based on previous patterns. Just as Homma predicted, trading is usually influenced by the trader’s emotions and the Japanese Candlestick chart is capable of showing these emotions.
The Candlestick chart collectively shows four (4) main price points within a chosen time frame. Namely; open price, close price, low price, and High price. These price points can be seen throughout the entire chart for the period that the trader has set.
The candlesticks are represented by different colors with each color having a unique meaning corresponding to a trader’s emotions. The Japanese Candlestick chart has a time frame that can always be altered by the trader to create a suitable platform for future predictions on prices.
One of the popular exchange wallets or platforms that you can mostly see the utilization of these Japanese Candlesticks include Binance and Houbi. Some web-based charts like trading view.com also make use of the Japanese Candlestick.
The common colors that trading view uses are green and red. Red is used whenever there is a fall in the chart whereas green is used whenever there is a rise in price relatively.
b.) In your own words, explain why the Japanese Candlestick chart is the most used in the financial market.
The Japanese Candlestick chart is an integral part of the technical analysis of trading in the financial market. The following are reasons why it is the most used in the financial market.
The Japanese candlestick chart gives a visual representation of whatever is going on in the financial market. When you look at the Japanese candlestick chart, you will get data as to whether prices are high or low and you will see useful information about the open and the close of prices which goes a long way to inform the trader of the price movement
The Japanese Candlesticks are used mostly by professional traders and very influential banks all over the world. The Japanese candlesticks make you see how these big traders do their trading and the profits they earn from it. By so doing, you will get to understand their trading methods and the chart will show you when to even enter or end a trade so as to profit.
The Japanese candlestick helps us understand human nature with respect to trading. Like I said earlier own, trading is mostly influenced by emotions. These emotions can be fear, anger, greed, or hope. The Japanese candlesticks help us understand these human behaviors by showing us a buyer and seller interactions.
One of the major reasons why the Japanese candlestick chart is mostly used in the financial market is because of its user-friendly nature. It gives a very clear pattern that can easily be understood by the trader or user.
The concept of reliability also contributes to the reason why the Japanese candlestick is mostly used in the financial market. The data and information obtained from the chart are very reliable. And it has proved useful to traders since time immemorial.
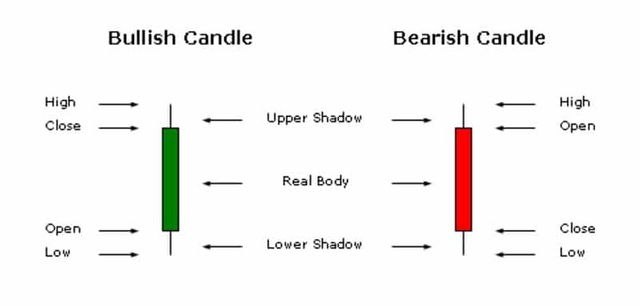
c) Describe a bullish and bearish candle. Also, explain its anatomy. (Original screenshot required)
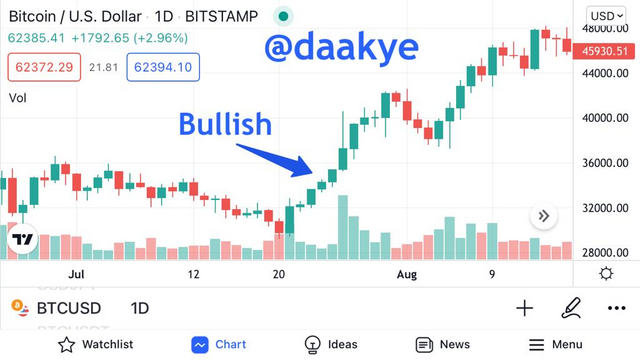
Source
BULLISH CANDLESTICK
Price movement can either increase or decrease on the market. It is the Bullish candlestick that indicates the nature of the rise of price movement within the financial market. The bullish candlestick informs us that the market is no longer under the control of sellers, and buyers will take control of the market. It predicts future increment of prices as well. It can be identified with so many different colors.
The ones that I am very much aware of are green and white. But the color doesn’t really matter. The most important thing is that you understand the chart when you see a bullish candlestick.
Source
The closing price for a bullish candlestick is always higher than its corresponding opening price for any given period of time. The Bullish shows both closing and high prices at the top of the candle and both openings and low prices are indicated at the bottom of the candle.
HIGH PRICE
Just as the name depicts; it shows the highest price throughout the Bullish price chart for any specific given period of time. It may sometimes be the same as the close price or higher than it.
LOW PRICE
It shows the lowest price throughout a bullish price chart for any given period of time. This can either be equal to the open price or lower than it. Both of them are located at the bottom of the candlestick.
CLOSE PRICE
For any specific given period of time, the close price is the end of that particular candle. It is the very last noted price of the candle. It is found at the top of a bullish candlestick and it's equal to or lower than the high price. For a bullish candle, the close price is higher than the open price for a given period of time.
OPEN PRICE
This is the starting price for the candlestick chart to begin its graphing for a stipulated time frame. For a bullish candle, it is always lower than the close price.
BEARISH CANDLESTICK
The bearish candlestick is one of the candlestick patterns which indicates the nature of the fall of price movement. It shows the decrease in price movement of assets within the financial market over a period of time.
For this candlestick pattern, unlike the bullish, the closing price is always lower than the opening price. With respect to its’ anatomy, the open and high prices are at the top of the candlestick and both the close and low prices are at the bottom of the candlestick.
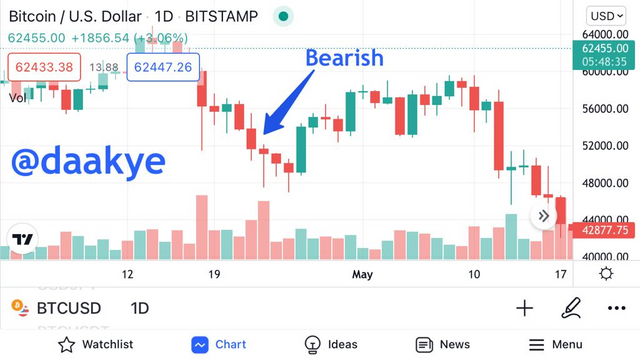
Source
CLOSE PRICE
It is found at the bottom of the bearish candlestick. It is the end price for any stipulated period of time. The close price is lower than the open price.
LOW PRICE
It is found below the candlestick together with the close price. It is the lowest price indicated on the bearish price chart for a given specific time frame. It can be equal to the close price or lower than it.
HIGH PRICE
It shows the highest price asset within the financial market for any given time frame. It is found on top of the bearish candlestick. This can be equal to the opening price or lower than it.
OPENING PRICE
This indicates the beginning of the price chart. Found at the top of candlestick together with the high price. It is always higher than the closing price. It can be used to determine the price movement in a bearish pattern.
In conclusion, I have come to really appreciate the essence of the Japanese candlestick in trading in the financial market. Knowledge of this will help you save a lot of money owing to the fact that you will know when to trade and when not to trade. I think this lecture will save a lot of low-income traders like myself.
Thank you very much Professor @reminescence01 for the lecture.
Ps; I took all my screenshots from the trading view app on my laptop.