Understanding Trends - Crypto Academy / S5W1- Homework Post for @reminiscence01


Hello everyone, I am privileged to take part in this first lecture in this new season. I am exited because I have learnt more things that will help me in my cryptocurrency investment.
This is my home work post.
QUESTION 1a
What do you understand by a Trending market?
A trending market refers to a market situation where the price of cryptocurrency moves either in an upward or downward direction. The price movement usually moves in a single and particular direction and not sideways.
In a trending market, there may be several price fluctuations and retracements but they will not be large enough to impact the direction of the trend. The price fluctuations and retracements can last for minutes or hours, or for a longer time like weeks or months, but it will not change the particular direction of the market trend.
This cryptocurrency market condition is a reflection of traders buying and selling activities. When there are more traders buying a particular crypto asset in the market more than those that sell, the price of that asset will start going upward and the market trend will be bullish. When there are more traders selling a particular crypto asset on the other hand, the price of that asset will start moving towards downward direction and the market trend will be bearish.
This will take us to the next question.
QUESTION 1b
What is a bullish and a bearish trend? (screenshot required)
Trending market can be divided into two: The upward market trend and the downward market trend. The upward market trend is known as "Bullish Trend" while the downward market trend is called "Bearish Trend"
Bullish Trend
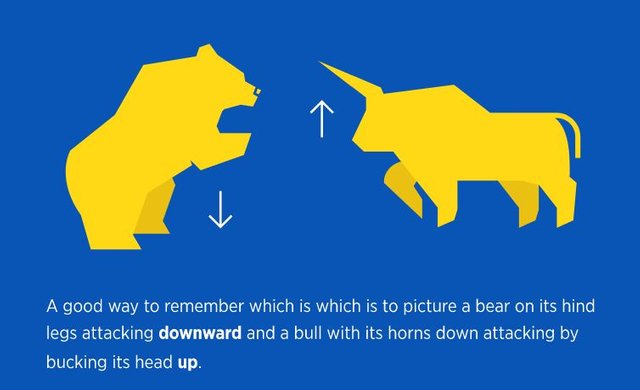
The idea of the term Bullish trend is gotten from the way bulls use their horns to lift their prey off the ground. This term is used in market trend because when the price of an assets rise as a result of more traders buying the assets, it is seen that the market forces are lifting and pushing the prices from a lower position to an upward direction. So, it is called Bullish Trend.
Bullish Trend is a market condition where the price of assets rise and keep pushing higher to an upward trend for a prolonged time because there are more buyers in the market than sellers and demand is huge.
It s important to note that prices have to be steadily pushing higher over time before they can truly represent a true bull market.
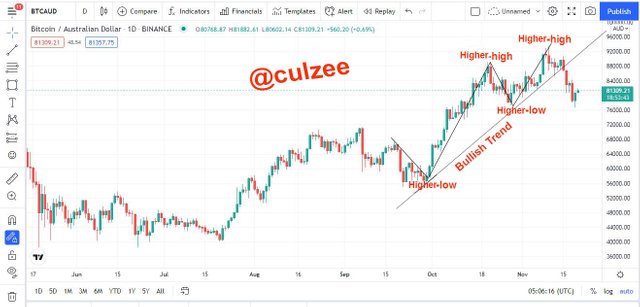
Below is an example of a bullish trend.
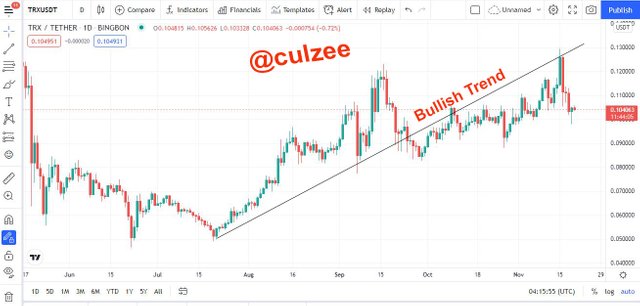
Source: Bullish Trend screen shot illustration from tradingview
Bearish Trend
Just like the bullish trend, the idea of the term "Bearish Trend" is gotten from how bears use their paws or hind legs to push their prey to the ground. This term is used in market trend because when the price of assets fall as a result of more traders selling their crypto assets, it is seen that the market forces are pushing the prices from a high position to a downward position. So, it is called Bearish Trend.
Bearish Trend is a market condition where prices are continually falling for a prolonged time because there are more sellers in the market than buyers. In bearish trending market the price movement is downward.
It is important to note that prices in a bearish market trend have to be steadily pushing downward over time before they can truly represent a true bearish market trend. A bearish markets can last for months or years, a few days of falling prices can not be a enough for a market to be called bearish.
Below is an example of a bearish trend.
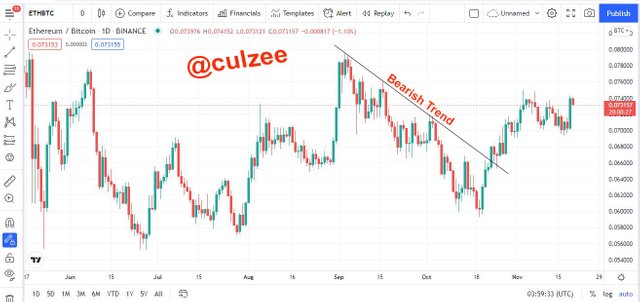
Source: Bearish Trend screen shot illustration from tradingview
QUESTION 2
Explain the following trend identification and give an example of each of them. (Original screenshot needed from your chart). Do this for a bullish and a bearish trend.
i) Market Structure.
ii) Trendlines
1) Market Structure
Market structure is a trend identification that has to do with the nature and degree of competition in the cryptocurrency market. It enables us know the current market condition. Market structure helps investors or traders to easily know when the market is bullish, bearish or ranging.
Let me explain each of them one after another with examples.
Bullish market structure:
This is one of the market structures that shows an upward market condition. In a bullish market structure we observe that the buyers are always in control of the market. The continuous buying of cryto assets leads to a steady price upward movement which generates a higher-high and higher-low formation. This indicates a gradual and continuous price increase.
Source: Screen shot illustration from tradingview
From the above chart, you will see that the price did not trade below the previous higher low point and it closed above the previous higher high point. This is a prove that traders are buying more and the price is continuously going uptrend.
This bullish upward formation offers a signal that can help traders to make good trading decision.
Bearish market structure:
The Bearish market structure is anther of the market structure that shows a downward market condition. In this market structure, traders who sell their crypto assets are always in control of the market. As more and more traders sell their cryto assets, there is a continuous downward price movement which generates a lower-high and lower-low formation. This indicates a gradual and continuous price fall in the market.
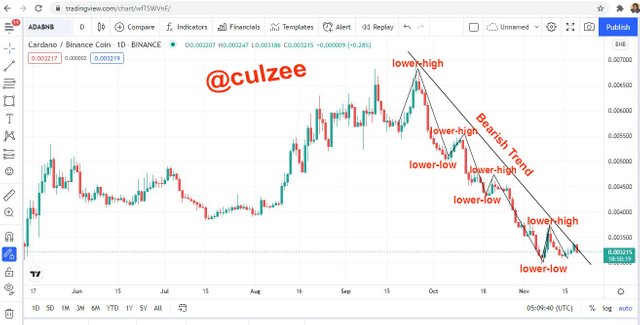
Source: Bearish market structure screen shot illustration from tradingview
From the above chart, you will see that the price did not close above the previous lower-high point and it trades below the previous lower-low point. This means that traders are selling more and the price is gradually going downtrend.
This gradual downward formation offers a signal that can help traders to make good trading decision.
Ranging Market Structure:
Sometimes we notice a market condition where there is no trend at all. In this type of market situation, you will neither see an upward trend nor downward trend. You will only observe that the price rises and falls at support and resistance points and there is no market trend. This is what we call Ranging Market, sideways or flat market.
A Ranging Market is the opposite of a trending market. It is a market condition where the price of crypto asset is moving back and forth between a higher price and a lower price.
In a ranging market structure, the higher prices form a resistance line that stops the price further uptrend movement, while the lower support line prevents further downward movement. Below screen shot will give you the clearer explanation.
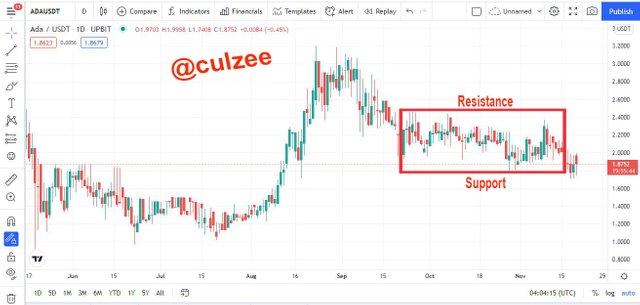
Source: Ranging trend screen shot illustration from tradingview
To take advantage of a ranging market, traders can sell their crypto at resistance point and buy at support level.
ii) Trendlines:
This is one of the common technical analysis tools that is used by traders to determine the direction of the market. It can be used in day trading, swing trading or position trading.
To draw a trend line for an uptrend ( Bullish movement), you can draw a straight line joining the 2 major swing low points. Here is an example.
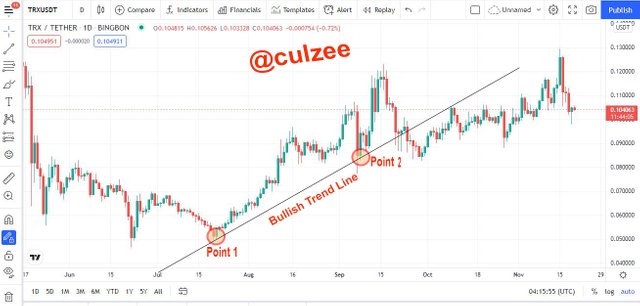
Source: Bullish trend line screen shot illustration from tradingview
Source: Bearish Trend line screen shot illustration from tradingview
From the above screenshot example, you can see that the price movement is trending above the trendline. You will also observe that when the price comes down it would hit the trendline and bounces back to continue with the uptrend. This shows that the bullish trend is valid. But any time the price movement violates this rule by breaking the trend line, the bullish trend will become invalid signifying a reversal from bullish to bearish trend.
Traders can take advantage of the upward trend to enter a buying position until the trend breaks the trendline.
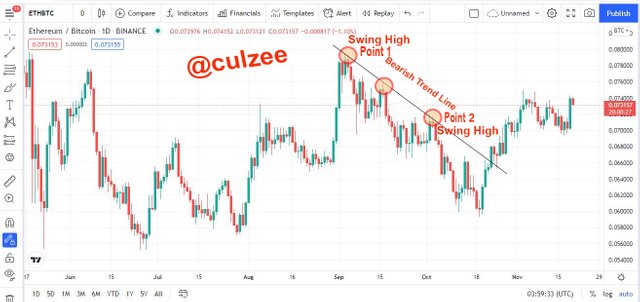
To draw a trend line for a downtrend ( Bearish movement), you can draw a straight line joining the 2 major swing high points. Here is an example.
Source: Bearish trend line screen shot illustration from tradingview
The above screenshot example shows that the price movement is trending below the trendline. You will also observe that when the price goes up and hits the trendline and it will bounce back to continue with the downtrend. This shows that the bearish trend is valid. Any time the price movement violates this rule by breaking the trend line, the bearish trend will become invalid signifying that is is a reversal from bearish trend to bullish trend.
Traders can as well take advantage of the bearish trend to enter a selling position until the trend breaks the trendline.
QUESTION 3
Explain trend continuation and how to spot them using market structure and trendlines. (Screenshot needed). Do this for both bullish and bearish trends.
Trend continuation is another kind of market condition where market trend does not take a straight line movement. In a trend continuation market situation, the price of crypto asset fluctuates and forms a sideways price movement on the chart and after a short time it will continue in it's original trend direction. This could be caused by traders who are taking their profits.
Bullish Trend Continuation
In bullish trend continuation, the price upward movement forms higher high and higher low points and after some time, the price retraces to continue in its original direction. Below screen shot is an example.
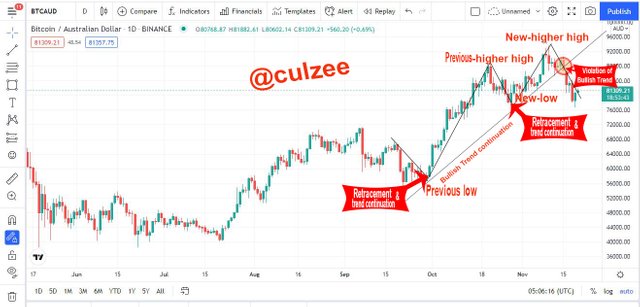
Source: Bullish Trend continuation screen shot illustration from tradingview
From the above screen shot, you will notice that the price is fluctuating (moving up and down) and creating something that looks like zig zag movement. For a trend to continue in the bullish trend, the new low point must be higher than the previous low and the new high point must be higher than the previous high.
You will also observe a violation of bullish trend rule. This is a signal of possible reversal from bullish to bearish trend.
Experienced traders can take advantage of this market condition, when some traders are selling their assets out of fear of bearish price reversal to buy crypto at a very cheap price before it bounces back to it's original bullish trend direction.
Bearish Trend Continuation
For a bearish trend continuation, the price downward movement forms lower high and lower low points and after some time, the price retraces to continue in its original direction. Below screen shot is an example.
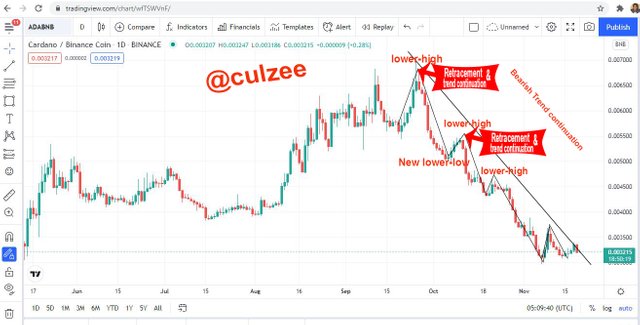
Source: Bearish Trend continuation screen shot illustration from tradingview
From the above screen shot, you will see that the price created lower high and lower low points. For the trend to continue in the bearish movement, the new low point must be below the previous low and the new high point must be below the previous high.
QUESTION 4
Pick up any crypto-asset chart and answer the following questions.
i) Is the market trending?
ii) What is the current market trend? (Use the chart to back up your answers).
i) Is the market trending?
I chose ADABNB crypto pair. At the end of September, the crypto asset bullish price hit a reversal point and entered a bearish trend movement.
Source: Screen shot illustration from tradingview
From below screen shot you can see that the price movement is in the downtrend which means that the market has been on a bearish trend since end of September till today.
ii) What is the current market trend? (Use the chart to back up your answers)
The current market trend of my chart is bearish. This is because the price movement of the market is in the downward direction, which means that traders who are selling their asset is in control of the market.
Source: Screen shot illustration from tradingview
CONCLUSION
The importance of understanding the concept of market trends in cryptocurrency trading can not be overemphasized. The reason is because, one is not expected to jump into cryptocurrency trading without first and foremost understanding how crypto asset price movement goes.
Cryptocurrency market is very volatile and we must ensure that we have very good knowledge of market trend before venturing into it to avoid huge loss and regret.
I am very happy to participate in this class. I have learnt a lot new things from the lecture. My special thanks to our lecturer, Prof. @reminiscence01. May the Almighty God bless you. Amen.