Trading Using Rectangle Pattern - Crypto Academy / S5W4 - Homework Post for @sachin08


Hello Steemians,
It's another opportunity to learn more cryptocurrency trading indicator. We really need it because we need to go far in our experience in the world of cryptocurrency.
Studying the lecture material has been very interesting and knowledge imparting. I have learn more new things and here is my home work post.

1. Explain Rectangle Pattern in your own word.
In cryptocurrency trading, there are a lot of technical indicators traders use to analyse and identify market trend.
Rectangle Pattern is one of those technical indicators used by cryptocurrency traders to identify market trend and then make trading decisions.
What is Rectangle Pattern?
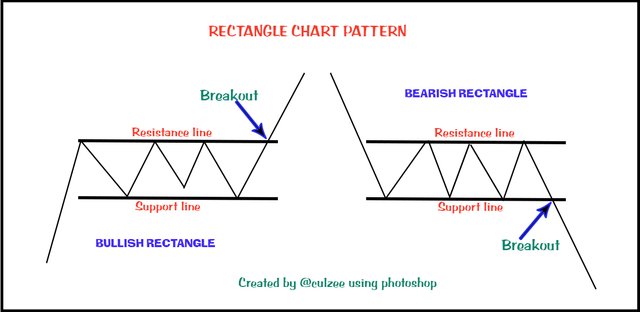
Rectangle Pattern is technical analysis pattern consisting of two parallel lines known as Top Resistance Trendline and Bottom Support Trendline.
The Rectangle Pattern is formed during a pause in the current trend when crypto asset's price movement is bounded by the Top Resistance Trendline and Bottom Support Trendline and the price is moving between the horizontal Resistance and support levels.
The pattern shows that there is an indecisive between buyers and sellers as the asset's price moves up and down between Resistance and support lines.
This indicates a market condition when buyers and sellers are dragging who will dominate the market but none of them was able to take over the market.
Eventually, one of them will overpower the other and there will be a breakout and price will trend in the direction of the breakout, upside or downside.
If the price trends in the upside direction, we have a bullish rectangle and when the price trends downside, we will have a bearish rectangle.
See below illustration I designed for more clarification.
2. How to identify Rectangles. Explain with Screenshots.
To find a rectangle on a chart is not really common. You would need to take some time to find it. But when you see a rectangle chart, it is not difficult to identify if you actually know how to identify them.
There are two major ways you can use to identify Rectangles on a chart. They are:
* Identifying the horizontal price movement:
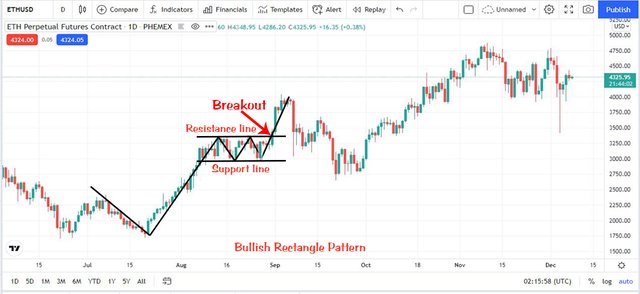
To identify rectangle on chart, the first thing is to look for a particular region on the chart where there is a horizontal price movement with at least two horizontal highs that will touch resistance line when it is drawn, and at least two horizontal lows that will touch the support line when drawn.
In a bullish trend, at least two horizontal higher highs will be touching resistance line, while at least two horizontal higher lows will be touching the support line.
Below screenshot chart shows an example.
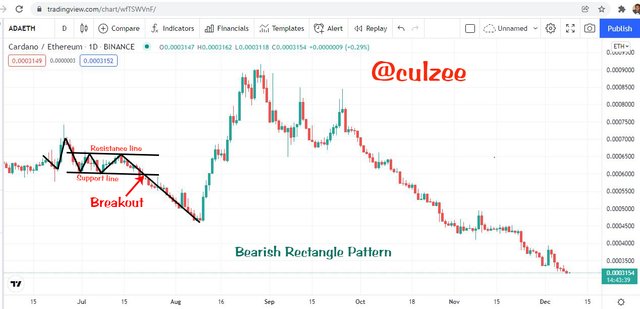
In bearish trend, at least two horizontal lower lows will be touching support line, while at least two horizontal lower highs will be touching the resistance line.
See screenshot example below.
However, for rectangle pattern to be valid, the above conditions must be fulfilled and the Price movement must bounce severally between resistance and the support trendline zone.
Then draw a straight line joining the two high points to form a resistance trendline and a straight line connecting the two low points to form a support trendline.
* Identifying the Price Action:
The next thing to do when trying to identify rectangle on chart is to check the price movement leading to the rectangle. That is to say, identify the rectangle tops and rectangle bottoms.
The price trend leading to the rectangle top should be uptrend. It must be moving towards the resistance line and should be falling to bounce on the support line to continue forming the horizontal higher highs and higher lows.
Below is a screenshot example.
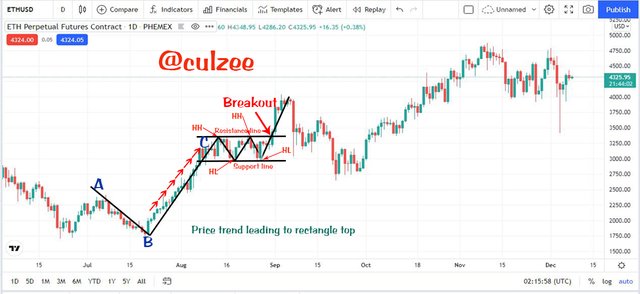
From the above screenshot, you will see how the price descended from point A and moves upward from point B to touch the resistance line at point C and then continued horizontal higher highs and higher lows.
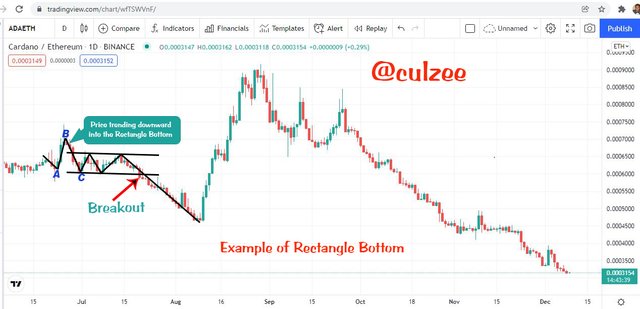
On the other hand, the price trend leading to the rectangle bottom trends downward. It must be moving down towards the support line and should then ascend to bounce on the resistance line to continue forming horizontal lower lows and lower highs.
Here is a screenshot example.
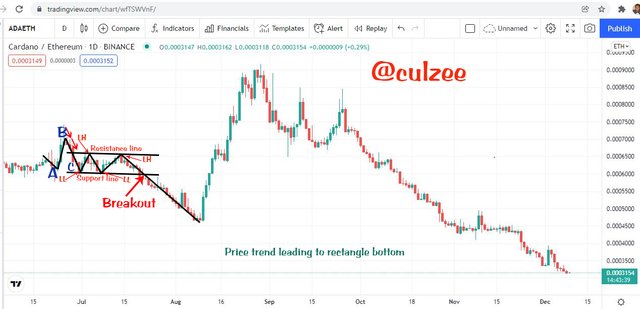
From the above screenshot, you will also see how the price ascended from point A to point B and then dropped into the rectangle to touch the support line at point C and then continued forming horizontal lower lows and lower highers.
3. Can we use indicators with this pattern to get accurate results? Explain with Screenshots.
Ideally, experienced cryptocurrency traders do not use only one technical indicator to make trading decisions. They use other indicator(s) to confirm signal before entering the market to either buy or sell.
We all know that indicators can not guarantee 100% accurate result but it can give us good and impressive signals that can lead to a very good and profitable trading decisions.
Therefore, we can use other indicators with rectangle pattern to get a very good and rewarding market signals.
Below is how other indicators can be used with rectangle pattern to get a very good and rewarding market signals.
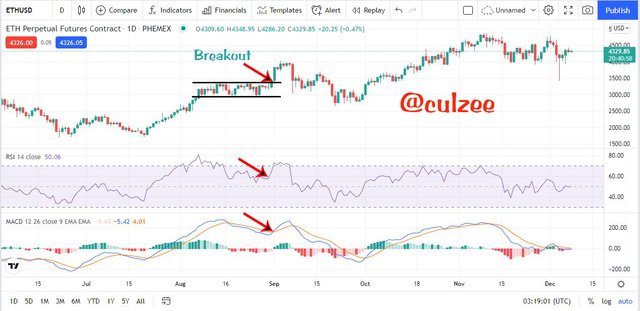
One of the leading indicators widely used by Technical analysts is the Relative Strength Index (RSI). This indicator can be used to spot a general market trend and it is a very good and useful tool that can be used to confirm signal from other indicator.
From the above screenshot, the rectangle pattern shows a bullish breakout which signals an uptrend in early September. For me to confirm the signal, I decided to use RSI and MACD indicators to double confirm the trend.
Observe that the RSI at the same point started rising above 60 which is a signal for bullish trend. This confirms rectangle pattern bullish breakout signal.
Now, when you look at the MACD indicator, you will notice that the blue band crosses the yellow band at the same point moving upward. This is a bullish trend signal which also confirms my rectangle pattern bullish breakout signal.
With this signal confirmation, traders can enter the market to buy.
4. Explain Rectangle Tops and Rectangle Bottoms in your own words with Screenshots of both patterns.
In rectangle technical indicator pattern, the price can move into the rectangle either from above or from below.
Rectangle Top:
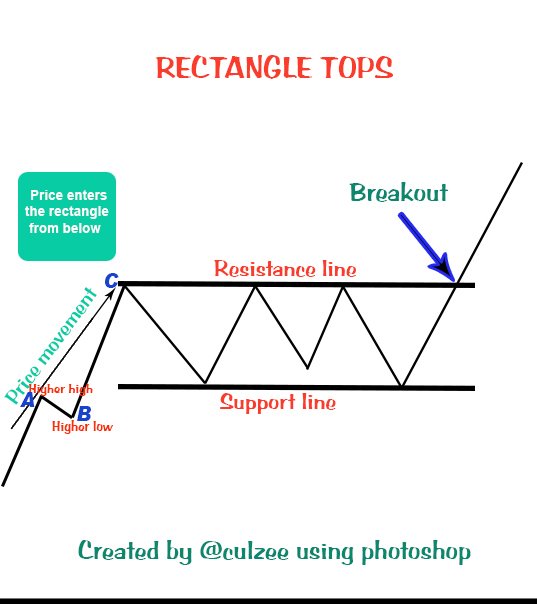
This is rectangle pattern where the price enters the rectangle from below. When the price enters from below, it rises to hit the resistance line and falls to bounce on the support line several times and then breakout to go uptrend.
To know if rectangle pattern is rectangle top, identify the price movement that leads to the beginning of the rectangle. The price movement tends to go up and then descends into the rectangle from below.
It rises to hit the resistance line and fall to bounce on the support line several times and then breaks out to go uptrend.
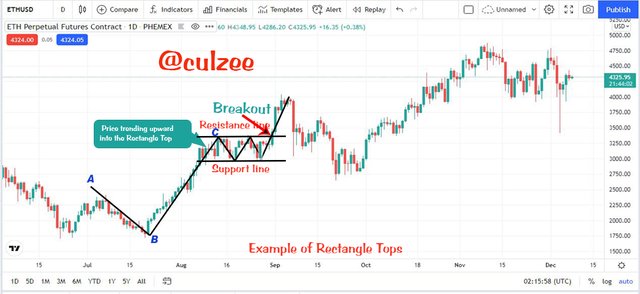
Below is a screenshot example.
Rectangle Bottoms:
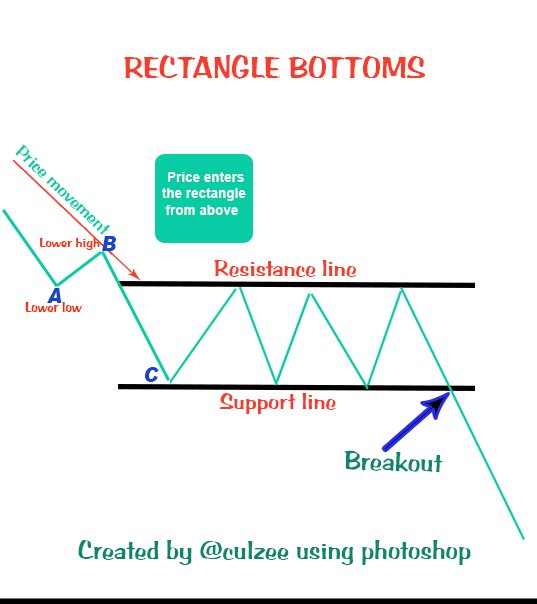
This is a direct opposite of the Rectangle Tops. They are rectangle patterns where the price enter the rectangle from above.
When the price enters from above, it would fall to hit the support line and rises to bounce on the resistance line several times and then breakout to go downtrend.
To know if rectangle pattern is rectangle top, identify the price movement that leads to the beginning of the rectangle. The price movement tends to go downward and then ascends into the rectangle from above.
It falls to hit the support line and rises to bounce on the resistance line several times and then breakout to go downtrend.
Below is a screenshot example.
5. Show full trade setup using this pattern for both trends. ( Entry Point, Take Profit, Stop Loss, Breakout)
Buy Trade Setup
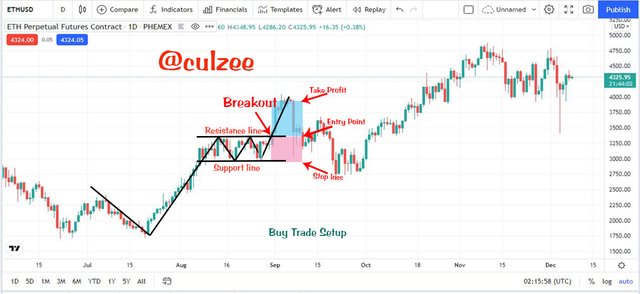
The above screenshot shows a bullish rectangle pattern. In the chart, you can see that the price enters the rectangle from below.
It ascended to hit the resistance line and fall to bounce on the support line touching each trendline two times, and then breaks the Resistance line to go uptrend.
When the breakout occurs, I entered a Buy Order and placed my Stop Loss a little below the support line and then set my Take Profit using 1:1 risk to reward ratio.
Sell Trade Setup
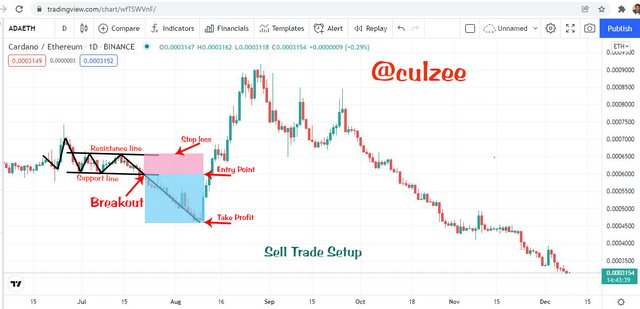
The above screenshot shows a bearish rectangle pattern. In the chart, you can see that the price enters the rectangle from above.
It descended to hit the support line and rises to bounce on the resistance line touching each trendline two times, and then breaks the support line to go downtrend.
When the breakout occurs, I entered a Sell Order and placed my Stop Loss a little above the resistance line and then set my Take Profit using 1:1 risk to reward ratio.
Conclusion
To Identify market trend and then make cryptocurrency trading decisions using Rectangle Pattern along side with other technical indicators can deliver high profit returns.
The challenge with this pattern is that, to find a rectangle on a chart is not really common. It can be frustrating and time consuming.
But we have to tolerate it because when we get it right, we will have a powerful forecasting tool that can deliver high profit returns.
I am happy to participate in this class. I have really learnt a lot.
A very big thank you to our lecturer, prof. @sachin08 for the wonderful lecture. Thank you so much.