Recognizing Simple Patterns in Trading - Crypto Academy / S5W2 - Homework Post for @sachin08


Hello everyone!
I am pleased to participate in this lecture by our new lecturer, Prof. @sachin08. It has been an interesting and a wonderful class.
I thoroughly studied the topic and carried out a lot of research before doing my home work. Now, I am done with the assignment, and here is my home work post.
1. What is your understanding about Triangles in Trading.

Triangles in cryptocurrency trading are technical analysis tools that are used by traders to predict crypto asset future price direction.
Triangles chart formations are made up of multiple candlesticks that are within two converging support and resistance trend-lines.
When the two converging support and resistance trend-lines are drawn, they form a triangle shape which indicate the continuation of the existing bullish or bearish market trend.
Below is an example of triangle chart patterns

From the image above, you can see that the triangle chart pattern is formed when two converging trend lines are drawn as price moves in a sideways direction.
You will observe that at the beginning when the formation started, the triangle was wide and as the market price continues to move in a sideways pattern, the range of trading narrows and forms a triangle shape.
Cryptocurrency traders use triangle chart patterns to look out for a subsequent breakout, which they use as a signal to enter a trade.
3 Types of Triangle Patterns
Triangle patterns have three main types which include: Ascending Triangle, Descending Triangle, and Symmetrical Triangle.
These triangle patterns help traders gain insight into the future price movement, whether the market will continue in the existing bullish or bearish market trend.
Let me explain the three Triangle Patterns one by one.
Ascending Triangle:
Ascending triangle also known as the bullish triangle is a type of triangle pattern that shows an upward rising trend-line that leads to a bullish breakout.
This bullish continuation pattern is characterized by an upper straight resistant line and a rising or ascending support trend-line that shows the upward direction of the market.
Ascending Triangle pattern indicates that buyers are taking over the market. This time around, the asset price continues to form higher lows and when it gets to the upper straight resistant line and crosses it, then we have a breakout.
At the breakout point, traders can place buying order.
See example below.

Descending Triangle
Descending triangle is a direct opposite of Ascending Triangle. It is a type of triangle pattern that shows a downward trend-line that leads to a bearish breakout.
This bearish continuation pattern is characterized by a bottom straight resistant line and a top trend-line that shows a bearish market trend.
This triangle pattern indicates that sellers are taking over the market. This time around, the asset price continues to form lower highers and when it gets to the bottom straight resistant line and crosses it, then we have a breakout.
At the breakout point, traders can place selling order. See example below.

Symmetrical Triangle
This is the type of triangle pattern where the market trend moves in a series of lower highs and higher lows to form a triangle.
It contains at least two higher lows, which is used to form a descending top resistance trend-line that goes in the downward direction and two lower highs, which is used to form an ascending bottom support trend-line that goes in the upwards direction.
When the descending top resistance trend-line and the ascending bottom support trend-line converge, it will form a symmetrical triangle shape.
In Symmetrical triangle, buyers and sellers are equal in terms of which people control the market. Both buyers and sellers are dragging and struggling to dominate the market.
There is a kind of battle between them and anyone of them that wins determines the market trend. If buyers win, the market will go uptrend (bullish) and if the sellers win, the market will go downtrend (bearish).
Symmetrical triangle chart formation is always neutral and can break in both directions. It does not form a clear market trend, rather it continues to squeeze and following the trend lines.
The chance of breakout in symmetrical triangle is equal for uptrend (bullish) and downtrend (bearish). Unlike as in the Ascending and Descending triangle. See example below.

2. Can we also use some Indicators along with Triangle Patterns? Explain with Screenshots.
The answer to the question is yes. The reason is because there is no technical indicator that can give you a 100% and accurate signal. Technical indicators can not be 100% reliable.
That is why cryptocurrency traders are always advised to use more than one technical indicator to confirm a signal before making trading decisions. This idea enables a trader to enter market with low level of risk.
Trading with caution is a very good habit of a good trader. Therefore, it is best practice to use Triangle Patterns alongside with some other indicators for a better trading decision.

As you can see in the above screen shot. I combined Triangle Pattern indicator with Moving Average Exponential and Relative Strength Index.
From the chart, you will see that the Moving Average Exponential is following the price action and moving uptrend. This confirms the Triangle Pattern where the price movement breaks the straight resistance line moving uptrend.
However, the Relative Strength Index which indicates that the price rises above 60 level and is now dropping to 60 also confirms that the market trend is bullish but has reached a point where the price will likely reverse.
If you careful observe the Triangle Pattern and the Moving Average Exponential, you will also notice the same thing.
With this signal, it is not a good time to enter market. Rather a time to observe the next price action.
3. Explain Flags in Trading in your own words and provide screenshots of both Bull Flag and Bear Flag.
Flags in Trading are technical indicators initiated by a strong price movement of asset that forms a triangle shape that look like a flag.
The flag pattern usually forms after a strong market trend move that can contain gaps where the flag represents a relatively short period of indecision.
Flag pattern is made up of, the previous trend line or flag pole, the resistance trend-line and the support line.
This pattern is used to indicate and to show trend continuation in a cryptocurrency market and can also be used as an entry pattern for the continuation of an established trend.
Flag in cryptocurrency trading occurs in two basic patterns:
- Bull Flag Pattern (bullish trend)
- Bear Flag Pattern (bearish trend)
* Bull Flag Pattern
This is a type of flag pattern that occurs when a strong bullish price movement breaks the resistance trend-line and continues moving upward.
Bull Flag Pattern indicates an uptrend, a market situation when the price of an asset is continuously moving in an upward direction.

From the above screen shot example, you will observe that there is price movement within a Flag pattern formed by the previous bullish trend-line or flag pole , the resistance trend-line and the support line.
You will notice that the price movement breaks the resistance trend-line and continues moving upward.
As the price break through the resistance line, we have a breakout. Traders can make a buying entry at this breakout point.
However, it is advisable to confirm the signal with one or two other indicators before entering the buying position.
* Bear Flag Pattern
This is a type of flag pattern that occurs when a strong bearish price movement breaks the support line and continues moving downward.
Bear Flag Pattern indicates a downtrend, a market situation where the price of an asset is continuously moving in a downward direction.

From the above screen shot example, you will observe that there is price movement within a Flag pattern formed by the flag pole , the resistance trend-line and the support line.
You will notice that the price movement breaks the support line and continues moving downward.
As the price break through the support line, we have a breakout. Traders can make a selling entry at the Bearish breakout point.
However, it is advisable to confirm the signal with one or two other indicators before entering the selling position.
4. Show a full trade setup using these Patterns on any Cryptocurrency chart. (Ascending Triangle, Symmetrical Triangle, Bear Flag)
Trade setups are very necessary in cryptocurrency trading. The reason is because they help traders to avoid unnecessary risk and to minimize loss.
Here are some charts of Trading Patterns setups.
Ascending Triangle:
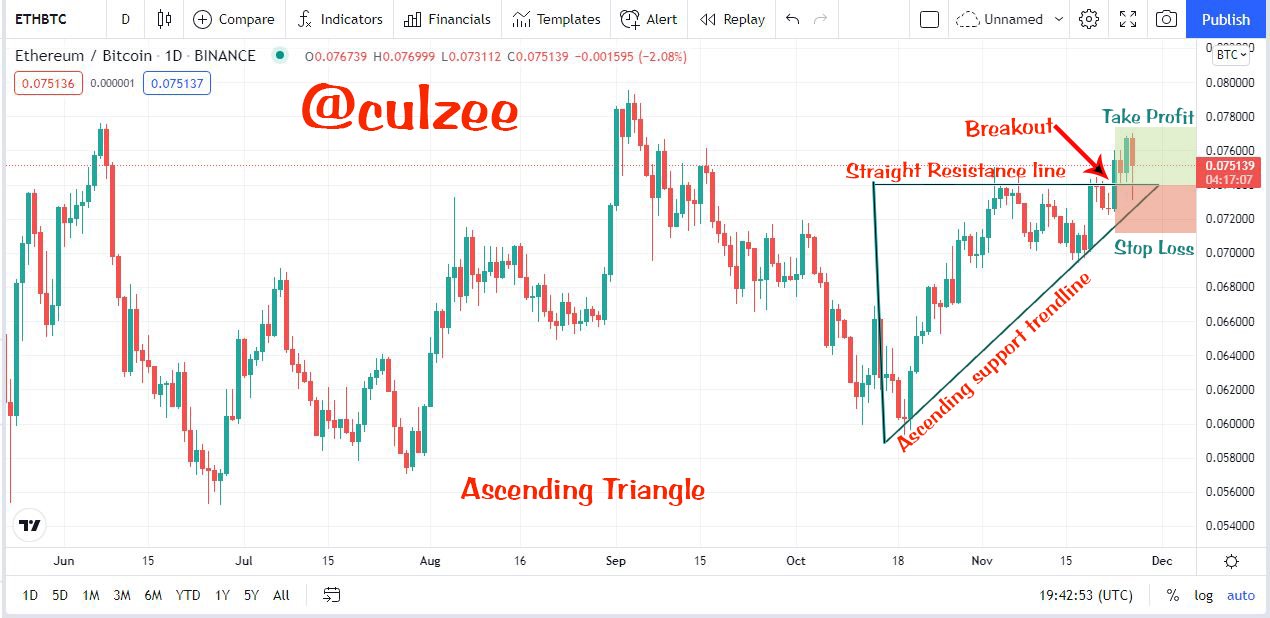
From the above screen shot, you can see that the price movement which has been hitting the resistance line hits it this time and breaks through the line towards upward direction.
Now, that point where price crosses the resistance line is called "the breakout". This is a buy order entry point. So I entered a buying position.
After that, I set my Take Profit level at the top and then marked my stop loss below the support level.
Symmetrical Triangle

From the above screen shot, you observe that the price movement would partially moves up and hits the resistance line and bounces back to hit the support line.
It continues until it finally hits the resistance line and breaks through the line towards the upward direction.
This shows that buyers have won the battle they had with the sellers and that they have taken over the market. In this case, we have a bullish trend.
Now, at the point of breakout, I entered a buying position. After that, I set my Take Profit level at the top and then marked my stop loss below the support level.
Bear Flag

From my screen shot, you will observe that there is price movement within a Flag pattern formed by the flag pole , the resistance trend-line and the support line.
You will also notice that the price movement breaks the support line and continues moving downward.
As the price break through the support line, we have a breakout. At this breakout point, I made a selling entry.
After that, I set my Take Profit at the top and then marked my stop loss below the support line.
Conclusion
Understanding of triangles technical indicators in cryptocurrency trading is not just important, it is something everyone of us needs to know how to use in our cryptocurrency investment.
Learning about the three Triangle patterns: Ascending Triangle, Descending Triangle, and Symmetrical Triangle as well as the Flag pattern is very interesting and helpful.
They are simple and easy to understand if you pay close attention. New traders will really appreciate these technical indicators if they understand them well.
However, when using anyone of them, it is advisable to confirm the signal you got with one or two other indicators before making trading decision.
Special thanks to our lecturer, Prof. @sachin08 for a wonderful class. Thank very much.