Leverage With Derivatives Trading Using 5 Min Chart -Steemit Crypto Academy | S6W1 | Homework Post for @reddileep

Hello Fellow Steemians,
I welcome everyone back to this life changing platform. The break has actually been a long one although it is for the good of all. I feel so excited for the new season and some of the new changes in the academy.
As the major focus is now on how to trade, I am optimistic that before the end of this season we shall all become professional and experienced traders.
This is my first home work in this season. The topic and the lecture presented by @reddileep is superb. I enjoyed it so much and here is my home work.

1- Explanation of Leverage Trading

Leverage in Cryptocurrency trading is one of the most powerful and lucrative way an investor or a trader can use to make larger profits in Crypto trading, when his trade is successful. But with a high-risk of losing his entire investment, when his trade is unsuccessful.
Leverage Trading is trading with funds borrowed from a broker or an exchange. It allows a trader access to borrow larger sums of capital from a broker to invest in cryptocurrency trading.
In Leverage trading, an investor is given an increased buying power by allowing him to deposit a small percentage of his order value and then open a larger trading position with more capital than the amount he has in his trading account.
In other words, Leverage trading allows investors to trade multiple times the amount of capital they have in their trading account. It gives traders access to use from 1 to 100 times or more the amount they needed to open a trade.
Leverage ratio is usually in 1:10, 1:20, 1:30 and above depending on the broker, asset type, and intended trade size of a trader's position.
For example, if I have $100 in my trading account and I want to trade using leverage ratio of 1:10, this means that I can deposit the $100 as my "initial margin" and will be allowed to place a trade order worth of $1,000 which is 10x the amount I have in my account.
This is not like normal crypto trading where if I want to place a trade order worth of $1,000 I will be required to deposit the complete $1,000. In leverage trading I will only be required to deposit only 10% of the amount.
Now, if my trade is successful I will make larger profits, but if the trade is unsuccessful I will run into a very big loss that can lead to my capital liquidation.
However, it is very important that traders should know and be conscious of the high risk involved in Leverage Trading so as to pay serious attention to risk management strategies.
2- Benefits of Leverage Trading?
In cryptocurrency, Leverage Trading is one of the most beneficial and lucrative way to make huge sum of money with a very high speed rate. This is because of the numerous advantages the system provides.
Below are some of the practical benefits of Leverage Trading:
* Access to larger sums of capital
Leverage Trading allows traders to borrow funds from an exchange or a broker to trade. This is a very good advantage compared to other Cryptocurrency Trading methods like Staking and Spot Trading where the investor is allowed to use only his own capital. Leverage Trading enables investors or traders to borrow larger sums of capital from an exchange or a broker to invest in cryptocurrency.
* Greater Profits
This is one of the major benefits of Leverage Trading. It helps traders to make larger profits when their trade is successful. The profit margin in Leverage Trading is in multiples. If a trader trades using leverage ratio of 1:10, his profit will be 10 times of what he would have made if he used only his own capital to trade as in a traditional cryptocurrency trading methods.
* Diversification
This is another advantage of leverage trading. Since a trader can borrow fund to trade, leverage trading enables traders to make the best use of their funds by investing in a range of different assets. For example, if I have $200 capital, I can split it into 3 or 4 and invest them in different assets, since I only need to commit a fraction of the value of the assets I will be using to trade. Instead of using the whole capital to trade one asset I will diversify.
* Low-Interest Rates
Another benefit of leverage trading is that it enables investors to borrow funds at very low-interest rates.
* Teaches discipline and risk management
Another important benefit of leverage trading is that it teaches traders how to be disciplined and also how to manage risk in volatile cryptocurrency market.
3- Disadvantages of Leverage Trading?
It is said that everything that has advantages also has some disadvantages, so it is with Leverage Trading. Leverage Trading is a double-edged sword, it can make or mar a trader.
In other to avoid the pitfalls of leverage trading, I think it is very important to point out some of them. Below are major disadvantages of leverage trading.
* Huge Losses
One of the major disadvantages of Leverage Trading is that it can lead a trader to great losses. When the market goes against a trader's prediction in leverage trading, his losses is always in multiples, many times over just like his profits when the market goes in his favour. This can be catastrophic for the trader's account. If for instance a trader is using leverage ratio of 1:10, his losses will be 10 times of what he would have lost if he used only his own capital to trade as in a traditional cryptocurrency trading methods like spot trading.
* Increased fees and charges
Another disadvantage of Leverage Trading is that exchanges and brokers who give leverages includes a lot of fees and charges which traders must pay, whether there is profit or loss. This can be so frustrating to a trader especially when he is trading at a loss.
* Risk of liquidation
Leveraged trading is a high-risky trading method that can lead a trader to losing his entire investment, when his trade is unsuccessful. This can result to a liquidation, especially when a trader do not have a enough funds to cover his losses.
* Not meant for newbie traders
Leveraged trading is only suitable for professional and experience traders who are good at technical analysis and risk management. It is not meant for newbie traders. It is purely meant for traders who are skilled at predicting market trend. Traders who are disciplined and can properly manage risk.
4- Basic Indicators that can be used for Leverage Trading
As we know that cryptocurrency market is very volatile and leverage trading is a high-risky trading system. For a trader to get involved in leverage trading he should be able know basic indicators that traders can use for Leverage Trading.
Some of the basic indicators that can be used for Leverage Trading include: Exponential moving average (EMA), Parabolic SAR, Supetrend, Relative Strength Index (RSI) and Moving average convergence divergence(MACD).
There are more others, these are just few of them. Below is a brief detail of three of them.
* Exponential moving average (EMA)
Exponential moving average (EMA) is a technical chart indicator that tracks the price of a crypto asset over period of time. It gives more weight to price of an asset in the most recent periods.
The “EMA” indicator was developed to correct the lagging weakness of the simple moving average SMA indicator by placing greater weight to price of an asset in the most current periods. The major purpose of this indicator is to make the changing price movement more clearer.
Cryptocurrency traders use EMA to identify the price behavour of an asset in the crypto market.
The EMA indicator uses “period” and “price” and it responds quickly to market changes. Because it responds so quickly to market changes, it can produce false signals. For this reason, EMA can give better result when used with another EMA especially when market trend is strong.
When the price of an asset is at the same level as the EMA, it gives a signal that there is no volatility in the market. If the price movement goes down below the EMA, it is a signal of a bearish trend. When the price rises above the EMA line, it signals a bullish trend, which is an opportunity to enter a buy position.
However, When price of an asset remains above the EMA, it signals of a bullish trend continuation. But if the price crosses the average, it is a sign of a trend reversal. Below is a screenshot example of Exponential moving average (EMA).
.JPG)
Screenshot from tradingview.com
Relative Strength Index (RSI)
This is one of the most widely used technical indicators created by J. Welles Wilder in the late 1970s. It is a popular momentum and volatility-based technical indicator in cryptocurrency market that can be used in leverage trading to check whether the price of an asset is overbought (bearish) or oversold (bullish).
The RSI scale is from 0 to 100. When the price is above 70, the asset is considered to be overbought, When the price is below 30, the asset is considered to be oversold.
When the price hits above 70 region, it shows that the bullish trend is getting to its peak and that buyers are getting weak and the sellers are waxing stronger and about to take over the market.
At this point, the price is likely going to reverse and there will be a trend reversal from bullish to bearish trend.
On the other hand, when the RSI enters the oversold region below 30, it shows that the bearish trend is getting to its peak and sellers are becoming weak and the buyers are waxing stronger and about to take over the market.
At this point, the price will likely reverse and there will be a trend reversal from bearish to bullish trend.
It is believed that the price reaches the overbought region as a result of excess buying, and gets to oversold region due to excessive selling of a crypto asset.
The RSI is very good tool that can be used in leverage trading. Below is a screenshot example.
.JPG)
Screenshot from tradingview.com
* Moving Average Convergence and Divergence (MACD)
This another very good indicator that can be used for Leverage Trading.
Moving Average Convergence/Divergence indicator is a momentum oscillator that is mostly used by crypto traders to predict market trends. It is a trend following technical strategy that seeks to identify changes in the price of an asset.
This technical indicator was created by Gerad appel in the late 1970s. The purpose of the indicator was to show changes, momentum, direction strength and duration of a market trend.
MACD is comprised of MACD line, Signal line and Histogram. The MACD line checks the distance between moving averages while the signal line reveals changes in the price momentum and the histogram shows a graphic representation of the distance between the MACD line and the signal line.
When the MACD line crosses the signal line from below and the MACD line is above the signal line, it gives a signal for a bullish trend which is a buying signal.
When the MACD line crosses the signal line from above and the signal line is above a MACD line, it then signals a bearish trend which is a signal for selling crypto asset. Below is a screenshot example.
.JPG)
Screenshot from tradingview.com
5- How to perform Leverage Trading using special trading strategies
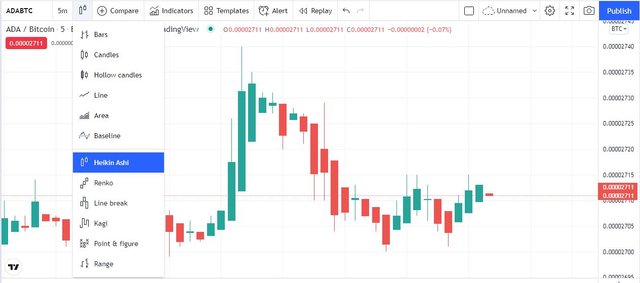
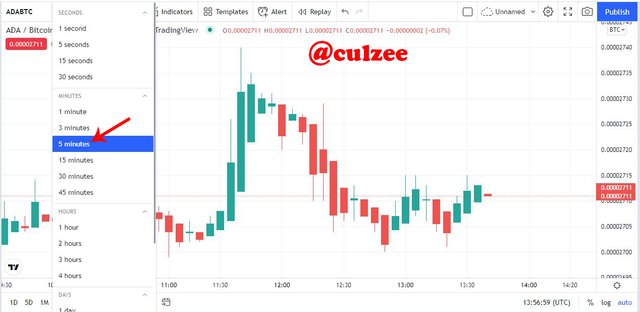
To perform Leverage Trading using special trading strategies, I will be using Heikin Ashi Charts and 5 minutes timeframe on www.tradingview.com chart platform.
Screenshot from tradingview.com
Screenshot from tradingview.com
From the above charts, I have switched over from candlestick chart to Heikin Ashi Chart and I have also selected my 5 minutes timeframe.
Now, I will carry out my technical analysis using Exponential Moving Average (EMA), Moving Average Convergence and Divergence (MACD) and Relative Strength Index (RSI).
First of all, I applied Exponential Moving Average (EMA) strategy to check out the market trend.
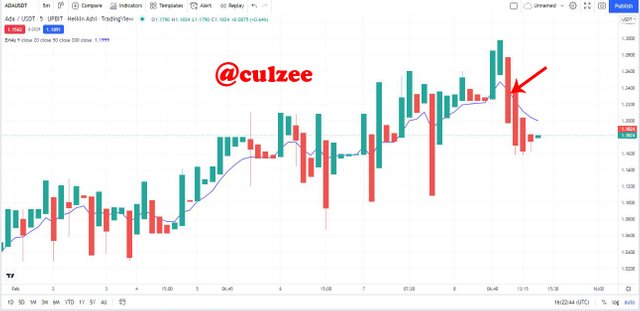
Screenshot from tradingview.com
Looking at the above chart, you can see that the price is going down and it crossed the EMA line at point I indicated with red arrow. Now the the price is below the EMA. This is a signal that the market is a bearish trend.
At this point I don't have to rush to enter a selling order, I need to confirm this signal with another indicator. So I added Moving Average Convergence and Divergence (MACD) strategy.
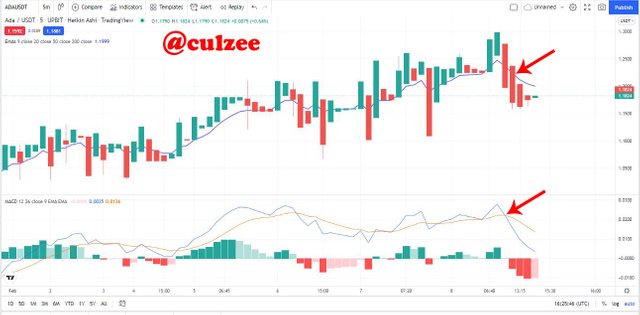
Screenshot from tradingview.com
From the above chart, you will notice at the point I indicated with red arrow that the blue MACD line crossed the signal line from above and the signal line is above a MACD line. This is a confirmation that the market is bearish.
At this point, I am getting convinced that the market is bearish but I will still need to do my final confirmation before making trading decision to enter a sell position.
To do my final confirmation, I applied Relative Strength Index (RSI).
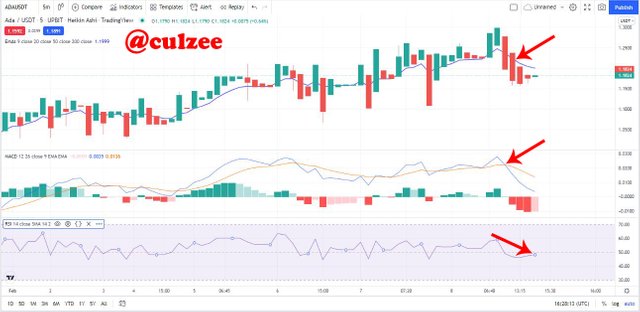
Screenshot from tradingview.com
Now, you will observe from the RSI chart above that the price is below 50. This shows that the market is in the downtrend which is another confirmation that the market is bearish. At this point, I am fully convinced that the market is bearish, So I can enter a Sell position.
6- Make a real buy long or sell short position at a suitable entry point in any desired exchange platform.
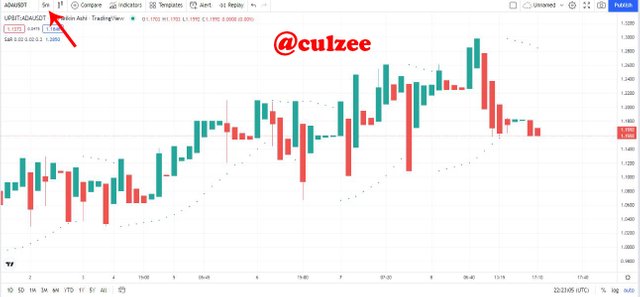
In other to do more Technical Analysis considering the above-explained trading strategy, I have removed RSI indicator from the chart and applied Parabolic SAR indicator.
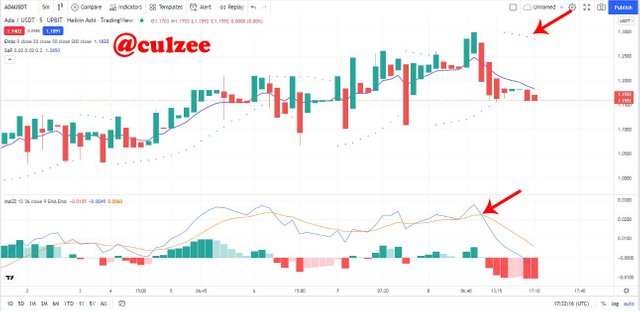
Screenshot from tradingview.com
As you can see from the above ADA/USDT 5 minutes chart, The Parabolic SAR dots appeared above the price. This also confirmed a signal of a downtrend and an opportunity to enter a sell position.
With this clear and confirmed bearish trend, I went ahead to apply my risk management strategy for a sell position. Below screenshot clearly shows my entry point, Stoploss and Take Profit.
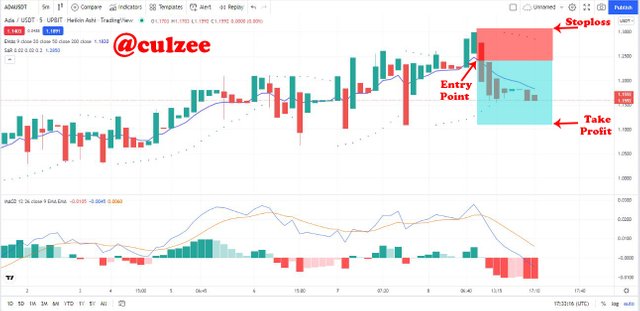
Screenshot from tradingview.com
I wanted to executed a sell short position on Binance future leverage account but I am still working on my Binance account verification and I have only 30.552 Steem in my Steem Wallet account. Please pardon me, I will perform the trade as soon as I raise little fund.
Conclusion
Leverage trading is a very lucrative way to make larger profits in Crypto trading, but the fear of it's disadvantages can discourage many people from venturing into the profitable business.
However, traders should not be discouraged from taking advantage of this life changing trading model. It can look so fearful at first but once you have learned how to trade and manage risk, it can be a profitable trading strategy.
Finally, it is very much advisable that as we engage in cryptocurrency trading that we should not risk more than we can afford to lose. We should learn how to be disciplined and how to manage risk.
Thank you very much for taking your time to go through my post. God bless you.