Crypto Trading Using Zig Zag Indicator- Crypto Academy /S6W1-Homework Post for kouba01

Hello everyone,
Welcome back to our cryptocurrency world. It's a privilege to be part of this first week of season 6 lecture. I have taken time to study the lecture note and to grab the lesson. Prof. kouba01 has really chosen a very nice and interesting topic. The lecture delivery was superb. I am very happy that I participated in this class.

1. Show your understanding of the Zig Zag as a trading indicator and how it is calculated?

Zig Zag indicator is a technical tool basically created to identify significant changes in the price of an asset. It filters out small movements and short time fluctuations in the cryptocurrency market.
Zig Zag indicator aims at ignoring noise or minor movements that are not very important. It focuses on generating a signal when there are major changes in the market trend. This helps traders to see clear picture of price movement of crypto assets.
The indicator is designed in the form of zig zag. It moves up and down along crypto asset price movement and it can be used on any cryptocurrency in any time frame.
Zig Zag indicator is a very good analytical tool that can be used by all traders especially those who are familiar with swing high and swing low indicators. It helps to identify the market swing high and swing low points with better accuracy.
Below is a screenshot showing an example of Zig Zag indicator.
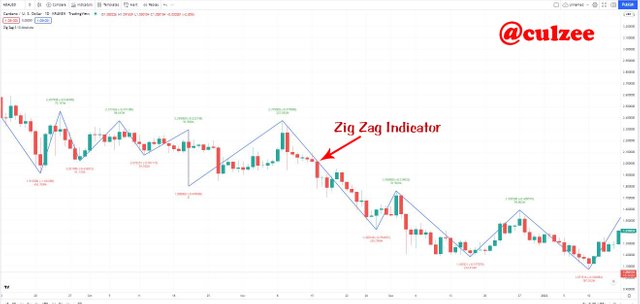
Screenshot from tradingview.com
Zig Zag indicator is not predictive but effective in analyzing historical asset data. It provides only information on the past market trend and can not forecast the next swing high and swing low.
It is very useful even though it does not forecast market trend. It works well with other indicators like Elliot Wave Counts, Fibonacci and Retracements.
How to calculate Zig Zag indicator
Before I go into the calculation, it is important you understand that Zig Zag indicator pays attention to historical price data. What this means is that in the calculation of Zig Zag indicator, only the highest and lowest points of the previous data will be considered, that is the highest and lowest points the market reached.
The last or current point will not be used because it has not been consolidated, the next price could change it. With this information established, let me go ahead and give you the formula. The Zig Zag calculation is usually done in percentage.
The formula is ZigZag = (HL, %change = X, retrace = FALSE, LastExtreme = TRUE). If %change >= X, plot ZigZag
where:
HL = High-Low price series or Closing price series
%change = Minimum price movement in percentage
LastExtreme = Variable change
2. What are the main parameters of the Zig Zag indicator and How to configure them and is it advisable to change its default settings? (Screenshot required)
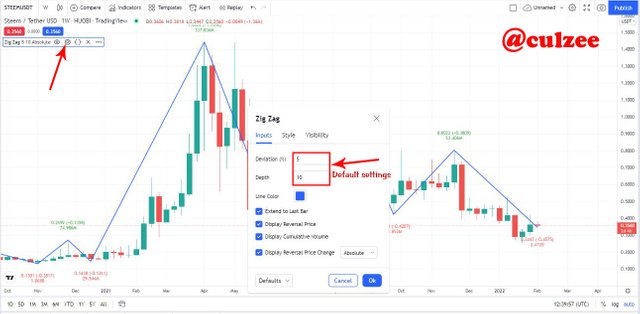
Zig-Zag indicator can be customized with 2 major parameters that can determine how the Zig Zag indicator works. The two parameters includes "Deviation" and "Depth".
Deviation: This is the minimum percentage of the number of points that is between the highs and lows. This determines the number of price actions that the zig zag indicator will ignore. Any price action that is less than 5% will be ignored by the Zig Zag Indicator.
Depth: This is the minimum number of the candles that the indicator will not represent a new maximum/minimum if the conditions of the first number are necessary for the construction to happen. The depth is normally 10.
How to configure Zig Zag Indicator
In this section, I will be using Tradingview platform to practically explain how to setup parameters for Zig Zag indicator.
To setup "Deviation" and "Depth" parameters for Zig Zag indicator using tradingview platform, first log in to www.tradingview.com.
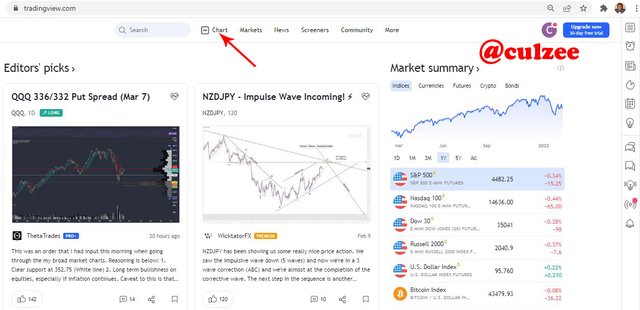
Screenshot from tradingview.com
Click on "Chart" on the menu bar. Then click on the "Indicators" on the same menu bar and search for Zig Zag indicator and select it.
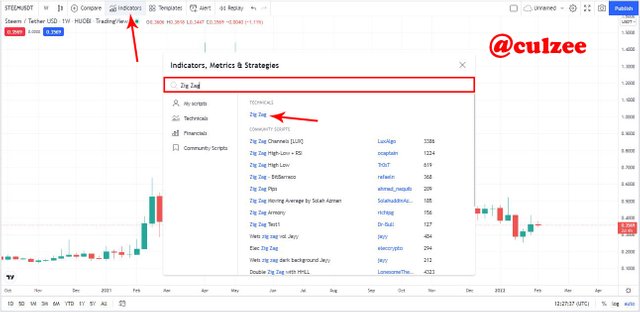
Screenshot from tradingview.com
You will see it appear on the chart immediately, as you can see on the screenshot below.
Screenshot from tradingview.com
Configuring the Zig Zag Indicator Settings
To configure the Zig Zag Indicator, click any part on the Zig Zag indicator and right click, or click the settings button on the Linear Indicator menu bar at the top left side of the chart. See below screenshot.
Screenshot from tradingview.com
and the setting pop-up box will appear. Click on the "Inputs" and you will see "Deviation" and "Depth" setting box where you can change the parameters of the Zig Zag Indicator. As you can see, my default setting is "Deviation" = 5 and "Depth" = 10.
It is important that when setting the parameters that you study the market conditions because if it is not properly set, it can give false signal.
If you are a newbie trader, I suggest that you should use the default settings. Do not change the setting, it is a standard setting that will work for for different types of traders. Changing the settings when you are not sure of the outcome can be very risky.
3. Based on the use of the Zig Zag indicator, how can one predict whether the trend will be bullish or bearish and determinate the buy/sell points (screenshot required)
Predicting asset price direction is the backbone of cryptocurrency trading. Every technical indicator serves the ultimate purpose of offering signals that helps traders to predict the next crypto asset price direction.
Here I will be using Zig Zag Indicator to predict trend direction and using it to determine Buy/Sell Points.
As I have mentioned above, Zig Zag indicator is a technical tool basically created to identify significant changes in the price of crypto asset. It generates signal when there are major changes in the market trend.
Predicting Trend Direction Using The Zig Zag Indicator
To determine the market trend (price movement) on the price chart using Zig Zag indicator.
Bullish Trend
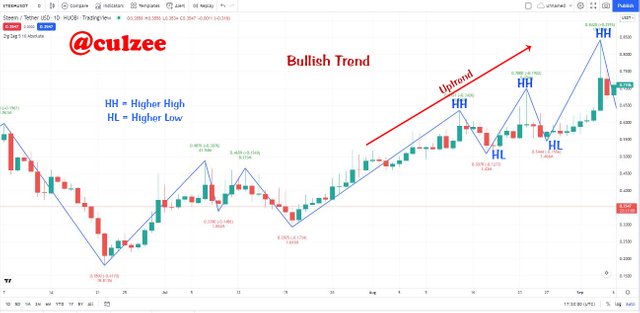
When the Zig Zag is making a series of higher high that is higher than the previous higher high and higher low that is higher than the previous higher low, then the price is in an uptrend or in a bullish trend. See screenshot example below:
Screenshot from tradingview.com
From the above screenshot, you can see that the Zig Zag is making a series of higher high that is higher than the previous higher high and higher low that is higher than the previous higher low, this shows that the price is in an uptrend or in a bullish trend.
Bearish Trend
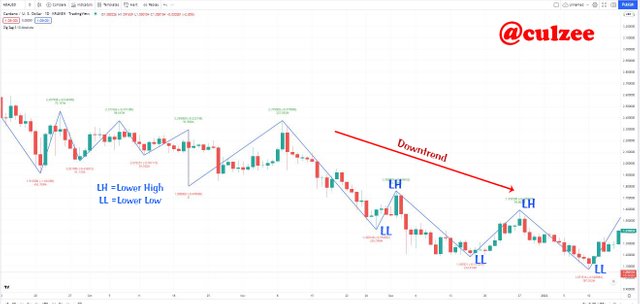
On the other hand, when the Zig Zag is making lower high that is lower than the previous lower high and lower low that is lower than the previous lower low, then the price is in a downtrend or in a bearish trend. See screenshot example below:
Screenshot from tradingview.com
From the above screenshot, you will notice that the Zig Zag is making a series of lower high that is lower than the previous lower high and lower low that is lower than the previous lower low, so the price is in a downtrend or in a bearish trend.
Determining Buy/Sell Points Using The Zig Zag Indicator
Having established trend direction and with the bullish and bearish trend chart above, I can go ahead to identify the buy and sell points and execute buy and sell setup.
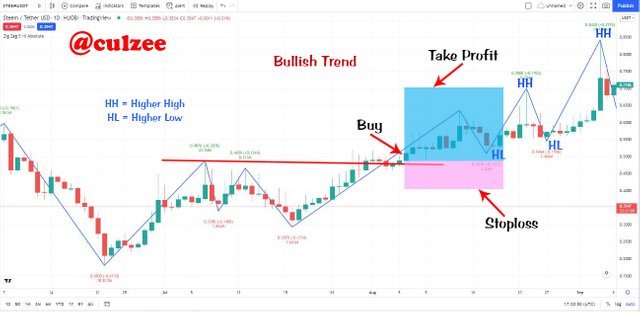
For Bullish Trend
Enter a buy position when price breaks the resistance trendline. Set StopLoss and take profit at ratio 2:1.
Screenshot from tradingview.com
For Bearish Trend
Enter a sell position when price breaks the support trendline. Set StopLoss and take profit at ratio 2:1.
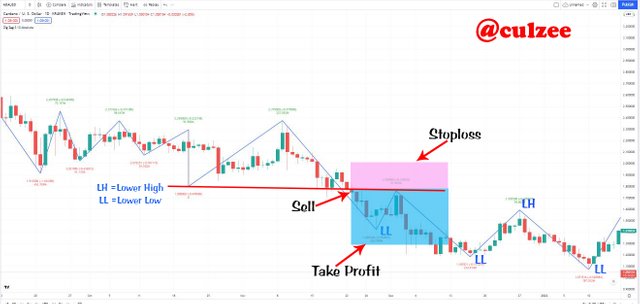
Screenshot from tradingview.com
4. Explain how the Zig Zag indicator is also used to understand support/resistance levels, by analyzing its different movements.(screenshot required)
Zig Zag indicator can be used to identify Resistance and Support levels in a market trend.
Support level
This is an area in the chart where the price of an asset tries to break below but could not breakthrough. At the support level, the price tried to break the support trendline to go down lower but was stopped by a strong buying power which causes the price to bounce off the support trendline.
The Support level can be identified simply by connecting the lowest points where the price tried to break below but could break through. Identify the Lower Lows points and draw a straight line connecting the swings. Below is a screenshot example.
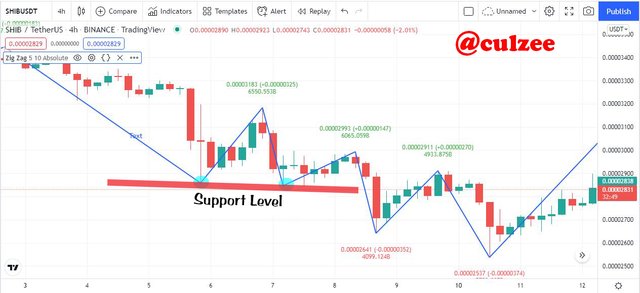
Screenshot from tradingview.com
Resistance Level
This is an area in the chart where the price of an asset tries to break above but could not breakthrough. At the Resistance level, the price tried to break the Resistance trendline to go up higher but was stopped by a strong selling power which causes the price to bounce off the resistance trendline.
The Resistance level can be identified simply by connecting the highest points where the price tried to break above but could break through. Identify the Higher high points and draw a straight line connecting the swings. Below is a screenshot example.
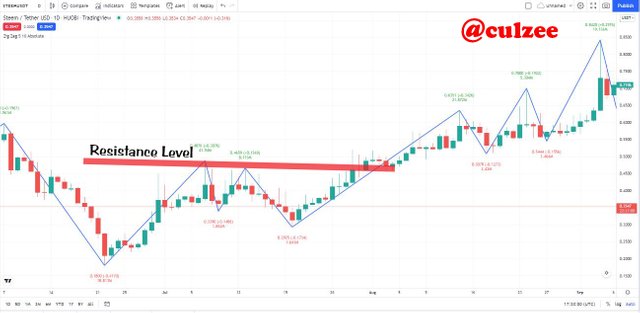
Screenshot from tradingview.com
5. How can we determine different points using Zig Zag and CCI indicators in Intraday Trading Strategy? Explain this based on a clear examples. (Screenshot required)
We can simply determine different points using Zig Zag and CCI indicators in Intraday Trading Strategy by combining the CCI Indicator with Zigzag in an Intra-day trading analysis.
As we know that zigzag indicator does not predict price movement, so combining the two indicator is a very good strategy that can give a better signal.
CCI Indicator is an acronym for Commodity Channel Indicator. CCI indicator is a market trend predictive indicator that lets traders and investors know when an asset price is overbought or oversold by using the range of +100 for overbought level and -100 for oversold level.
So, when an asset price crosses CCI +100 line to the top, the trend is bullish, and when the price crosses the -100 to the bottom, the trend becomes bearish.
In the CCI and Zig Zag strategy, the CCI indicator is expected to show corresponding trade signals by crossing either the overbought or oversold levels. Let's use it for buy and sell trade signal.
Buy Trade Signal
When price breaks the Zig Zag Resistance trendline and goes uptrend, the price should cross the CCI indicator's +100 level to the top. I have demonstrated it practically on a chart. See the screenshot below.
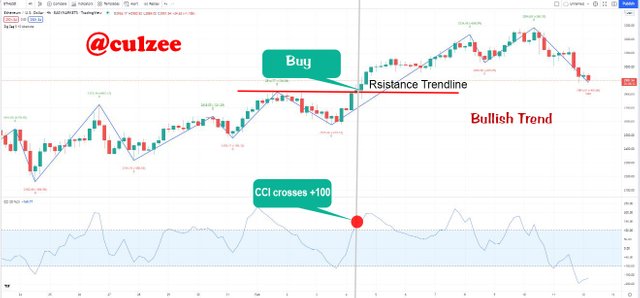
Screenshot from tradingview.com
From the above, you can see that when price breaks the Zig Zag Resistance trendline that the price at the same time crosses the CCI indicator's +100 level to the top. This is a clear signal for a trader to enter a Buy position.
Sell Trade Signal
When price breaks the Zig Zag support trendline and moves downtrend, the price should cross the CCI indicator's -100 level to the bottom. I have also practically demonstrated it on a chart. See the screenshot below.
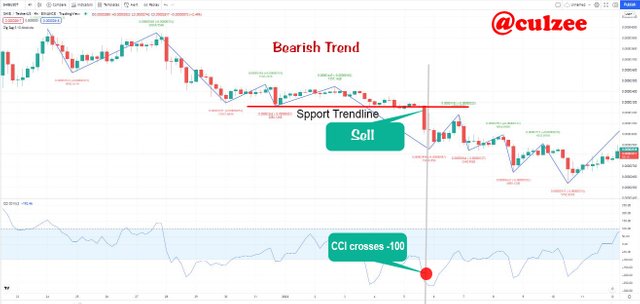
Screenshot from tradingview.com
From the above screenshot, you will notice that when price breaks the Zig Zag support trendline that the price crosses the CCI indicator's -100 level to the bottom. This is a clear signal for a trader to enter a sell position.
6. Is there a need to pair another indicator to make this indicator work better as a filter and help get rid of false signals? Give more than one example (indicator) to support your answer. (screenshot required)
The answer to the above question is a capital YES. The reason in the first place is because there is no indicator that is supposed to be used as a standalone tool.
Secondly, zigzag indicator is not a predictive tool, so it needs to be combined with not just one other indicator but more indicators to make the indicator work better as a filter that helps traders get rid of false signals.
Here, I will be combining zig zag indicator with Moving Average (MA) indicator and also with Relative Strength Index (RSI) to help filter false signals.
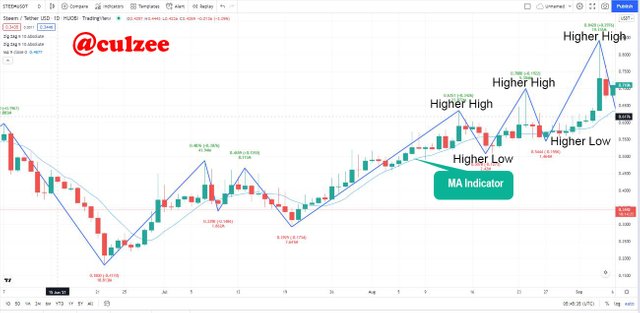
Zigzag with Moving Averages (MA)
Moving Averages (MA) is very good indicator that can work well with Zig Zag indicator to show the average price movement of an assets over a period of time. It offers support during bullish trends and provides resistance during bearish trends.
I have used it with Zig Zag indicator to filter fake signals in a market trend to get better signal that will help me to make good trading decision. Below is the screenshot.
Screenshot from tradingview.com
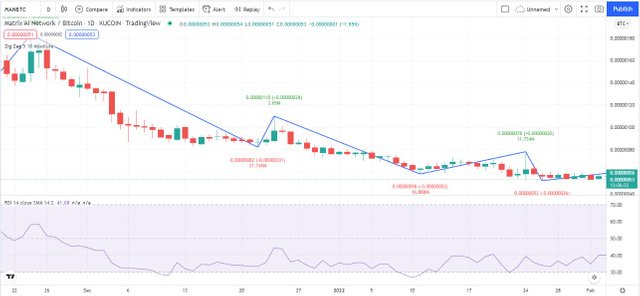
Zigzag with Relative Strength Index (RSI)
Relative Strength Index is a momentum and volatility-based technical indicator in cryptocurrency market that can be used o check whether the price of an asset is overbought (bearish) or oversold (bullish).
The RSI scale is from 0 to 100. When the price is above 70, the asset is considered to be overbought, When the price is below 30, the asset is considered to be oversold.
I have combined it with Zig Zag indicator to filter false signals in other to get better signal that will help me to make good trading decision. Below is the screenshot.
Screenshot from tradingview.com
7. List the advantages and disadvantages of the Zig Zag indicator:
There are so many advantages and disadvantages of Zig Zag indicator, below are some of them.
Advantages of Zig Zag Indicator
Zig Zag Indicator has so many advantages, below are list of some of them.
- It is very simple and easy to use
- It filters out small movements and short-term fluctuations that constitutes noise and make the indicator have simple appearance
- It has the ability to analyze any market trend without market noise
- It can be used to analyze trends in any time-frame
- It can be used with different other technical tools
- It works efficiently with Eliot waves or Fibonacci levels.
- It can be used to identify changes in the market trend.
Disadvantages of Zig Zag Indicator
- It only reflects past price actions and can not predict future price movements
- It involves the use of complicated settings to determining the Deviation and Depth values. This can be very difficult and frustrating especially for newbie traders
- It requires understanding of Elliot theory before can enjoy using the zigzag indicator. This might be difficult for traders who do know how Elliot theory works.
- its last line can change (repaint) according to price changes
- It is best used for when trading at high timeframes
- it can easily give false signal especially in a short timeframes when the value of Deviation and Depth is smaller
Conclusion
Zig Zag indicator is one of the technical analysis I would like to be using in my cryptocurrency trading analysis. The reason is because it filters out small movements and short-term fluctuations that constitutes noise and make the indicator have simple appearance and it is easy to use.
I am very happy to know that this type of indicator exist in the cryptocurrency market.
I want to sincerely that prof.@kouba01 for choosing this topic and presenting it in a very clear manner.
Thank you for patiently reading this post. God bless you.
Unfortunately @culzee , your article contains Spun content
Rating Total|0/10
Source:
https://www.investopedia.com/ask/answers/030415/what-zig-zag-indicator-formula-and-how-it-calculated.asp
The Steemit Crypto Academy community does not allow these practices. On the contrary, our goal is to encourage you to publish writing based on your own experience (or as per the mission requirements). Any spam/plagiarism/spun action reduces PoB's idea of rewarding good content.
Note: Any other try will mute you in the academy.