Confluence Trading - Crypto Academy / S5W6- Homework Post for @reminiscence01


Hello my fellow steemians,
It has been a wonderful learning experience. I have properly studied the lecture post by prof. @reminiscence01. Here is my home work.

1. Explain Confluence trading. Explain how a trade setup can be enhanced using confluence trading.

The term confluence is a word originally used to describe a geographic point where two or more rivers from different geographical locations meet to form a water body.
This idea is used in cryptocurrency trading to describe an area in the market where two or more structures come together to form a high-probability buy/sell zone.
In other words, it describes when different technical analysis methods are used together to give the same trade signal.
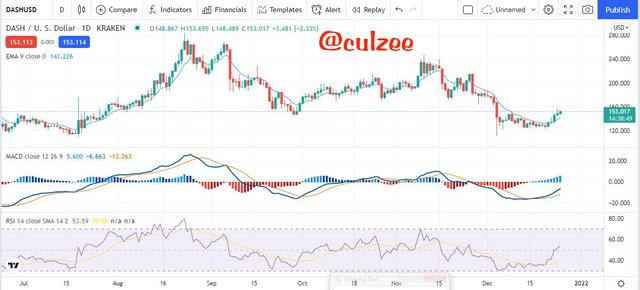 Screenshot from Tradingview.com
Confluence Trading in cryptocurrency therefore refers to when multiple technical indicators are used to give the same trade signal in other to help a trader make a good and profitable trading decision.
Traders in conference trading combine several indicators to increase their odds of winning a trade. Let me explain more using a chart screenshot
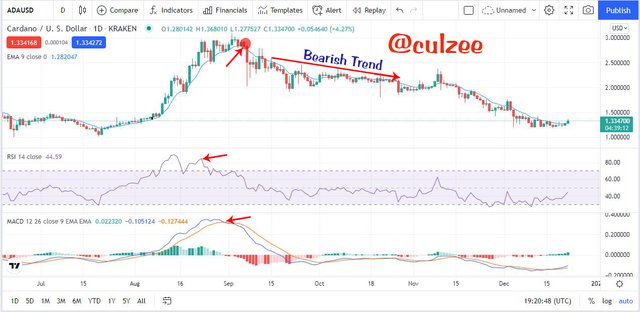 Screenshot from Tradingview.com
In the above chart, I have a confluence of indicators consisting of:
- Exponential moving average (EMA)
- Relative Strength Index (RSI)
- Moving Average Convergence Divergence (MACD)
As you can see on the chart, I have a multiple technical indicators lining up on the chart giving the same reading to confirm the validity of a potential bearish signal.
From the chart above, you will see that the Exponential moving average (EMA) is following the price action. At the point where I marked with small red circle, the price action breaks the EMA line going downtrend. This is a trend reversal signal from a bullish to bearish trend.
Now, looking at the RSI indicator, you will see at the point I indicated with red arrow that the price is a little above 80. This is in the overbought region giving an earlier signal of a bullish trend reversal.
Also, when you look at my MACD tool, you will notice at the point I indicated with red arrow that the blue line crossed the yellow line coming downward. This is also a signal showing that the bullish trend has reached it's peak and will reverse to bearish trend.
Observe that the three different technical analysis methods I have used together give me the same trade signal. This will help me as a trader to make a good and profitable trading decision.
In a nutshell, the concept of confluence trading is meant to help traders get a very good and convincing signals that could lead to greater accuracy and profitability.

2. Explain the importance of confluence trading in the crypto market?

The importance of confluence trading in the cryptocurrency market can not be overemphasis. This is because it helps traders to identify and filter fake signals that could lead to huge losses. And it helps traders make good and profitable trading decision.
Below screenshot example can go a long way to buttress my point.
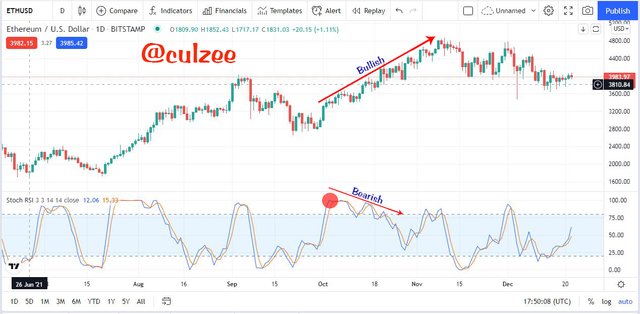 Screenshot from Tradingview.com
From the above screenshot chart, you can see that the price action is going in the bullish trend. But looking at the stochastic indicator, the case is different.
The indicator is going bearish, which is totally a different direction. If a trader relies only on this one indicator, the person will trade at a loss.
This is exactly the major reason confluence trading in the cryptocurrency market is not just important but very very important.
Now, when you look at the same chart, I added Relative Strength Index (RSI) to confirm the signal from stochastic. Behold, it was not the same. RSI is rather signaling a bullish trend.
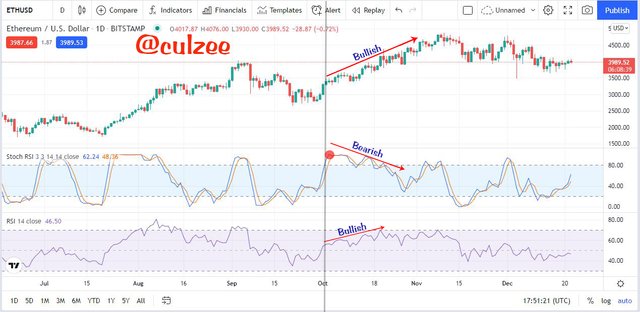 Screenshot from Tradingview.com
You can see, the stochastic would have led me to a wrong signal if I had relied only on it to make a trading decision.
Therefore, confluence trading is very important in the cryptocurrency market.
Below are some importance of confluence trading in the cryptocurrency market.
Greater Accuracy:
One good importance of confluence trading in the crypto market is greater accuracy. What I mean is that using multiple indicators give traders greater assurance that a trending signal is valid and can be trusted. This is because different indicators giving the same reading confirm the validity of a potential buy or sell signal which can be referred to as being accurate. This enables traders identify good trading setups and to make good and profitable trading decisions.Good Trading Decision and Greater Profitability:
Another good importance of confluence trading in the crypto market is Good Trading Decision and Greater Profitability.
As multiple indicators give traders assurance that a trending signal is valid and can be trusted. This gives traders greater confidence to make good trading decision to enter a trade to make investment that will lead to high profit margin.Filter False Signals
Confluence trading is important because it helps to filter false signals and fake-outs in the crypto market.
Using multiple indicators to confirm signal before entering a trade enables traders identify false breakouts and false trend reversals. This saves traders from making wrong trading decisions that can lead to a huge loss.Good Risk Management
Confluence trading in cryptocurrency market is very important because it helps traders to confidently enter market with good risk management. After confirming signal using several indicators, traders can confidently and carefully setup their entry point, stop loss and take profit to minimize losses.Trading Strategy Enhancement:
Confluence trading enables traders to learn how to use many indicators and to continuously use them. This will eventually help traders to enhance their trading skills. When a trader continuously use certain indicators over and over again, the trading skill of that trader will surely improve and gets better.

3. Explain 2-level and 3-level confirmation confluence trading using any crypto chart.

2-Level Confirmation Confluence Trading

In Confluence Trading, 2-Level Confirmation refers to when at least two trading tools are used to confirm trading setup.
As we know that conference trading does not support using of a single technical tool strategy, 2-Level Confirmation Confluence Trading supports a trading strategy where at least two technical indicators are used to confirm a signal before entering a trade.
The reason for 2-Level Confirmation Confluence Trading strategy is to enable a trader to double confirm signal before making trading decision to filter fake signals.
Let me show you an example with a chart screenshot.
 Screenshot from Tradingview.com
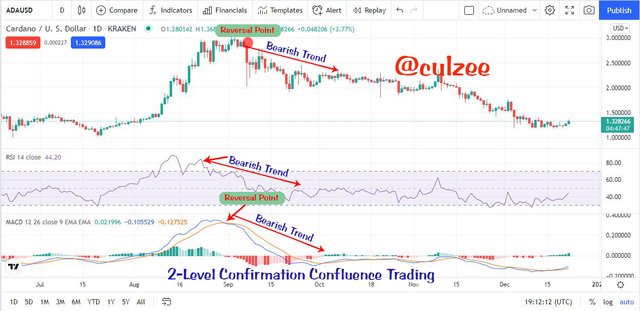
The above ADAUSD chart is a 2-level confirmation confluence trading showing a bearish trend.
As you can see, the price action is going in the downward trend. To confirm if it is really a bearish trend, I applied Relative Strength Index (RSI) strategy.
Now, when you look at the Relative Strength Index (RSI) closely, you will observe that the price is a little above 80 at the point I indicated with red arrow.
This shows that the price has reached an overbought region. It gives an earlier signal that very soon there will be a reversal in the current trend. This actually happened. The price movement reversed at the point I marked with a small red circle.
To double confirm the signal to be sure, I also added MACD tool. When you look at the MACD indicator, you will notice at the point I indicated with red arrow that the blue line crossed the yellow line coming downward.
This is also a signal showing that the bullish trend has reached it's peak and has started reversing from bullish to bearish trend.
Finally, the two different technical analysis methods I have used together give me the same trade signal. This assures me that the signal is valid and that I can go ahead and enter a selling position.

3-Level Confirmation Confluence Trading

3-Level Confirmation Confluence Trading refers to a trading strategy where at least three trading tools are used to confirm trading setup.
In 3-Level Confirmation Confluence Trading, at least three technical indicators are used to confirm a signal before entering a trade.
The reason for 3-Level Confirmation Confluence Trading strategy is to help a trader to properly confirm trend signal before making trading decision to filter fake signal.
3-Level Confirmation Confluence Trading strategy gives a trader a higher accuracy trend signal than the 2-Level Confirmation Confluence Trading strategy.
Below is a screenshot example.
 Screenshot from Tradingview.com
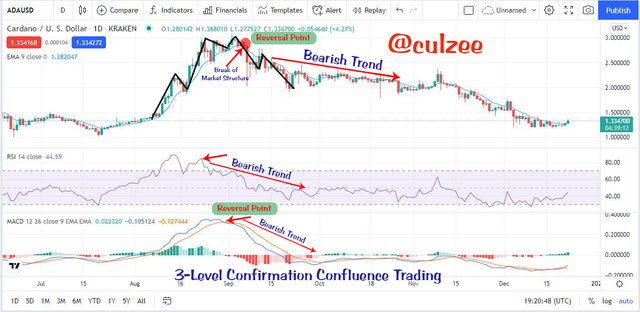
The above ADAUSD chart is the same with the screenshot I used for the 2-level confirmation confluence trading showing a bearish trend. The difference is that I added another trading strategy to get more convincing and a higher accuracy trend signal than the 2-Level Confirmation Confluence Trading strategy.
As I have explained before, the price action is going in the downward trend. To confirm if it is really a bearish trend, I applied Relative Strength Index (RSI) indicator.
When you look at the Relative Strength Index (RSI), you will notice that the price is a little above 80 at the point I indicated with red arrow.
This shows that the price has reached an overbought region. It gives an earlier signal that very soon there will be reversal in the current trend. This actually happened. The price movement reversed at the point I marked with small red circle.
To double confirm the signal to be sure, I also added MACD tool. When you look at the MACD indicator, you will see at the point I indicated with red arrow that the blue line crossed the yellow line coming downward.
This is also a signal showing that the bullish trend has reached it's peak and has started reversing from bullish to bearish trend.
Now, I added Exponential moving average (EMA) strategy to further confirm the two previous tools in other to get a higher accuracy trend signal.
Looking at the Exponential moving average (EMA) indicator, there is a break of market structure. The price was making a series of higher highs and higher lows, then the EMA line broke the market structure as the price could no longer make a new high that is higher than the previous high.
EMA line broke previous low to the downside at the point I indicated with a small red circle. This is another confirmation of a bearish signal.
With all these indicators giving me the same bearish signal. It is a convincing confirmation and an assurance that the signal is valid. So I can confidently go ahead and enter a selling position.

4. Analyze and Open a demo trade on two crypto asset pairs using confluence trading. The following are expected in this question.

a) Identify the trend.

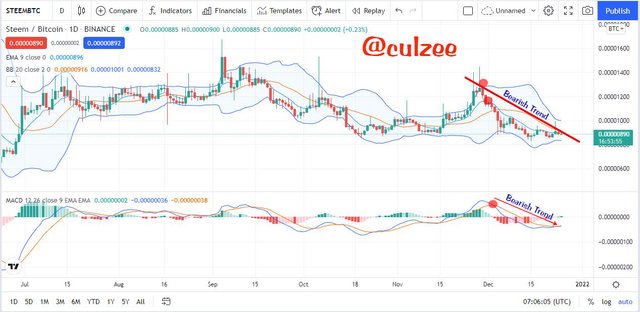
After performing technical analysis which I used Trendline, Bolinger Band, Exponential moving average (EMA) and Moving Average Convergence Divergence (MACD) tools. I got a convincing signal of a downtrend, which means that the STEEMBTC market is bearish. This is the screenshot.
 Screenshot from Tradingview.com
From the above screenshot you can see that the price action is showing a bearish trend. The four indicators are also showing a downward or bearish trend. Therefore, the market is in a downtrend.

b) Explain the strategies/trading tools for your confluence.

 Screenshot from Tradingview.com
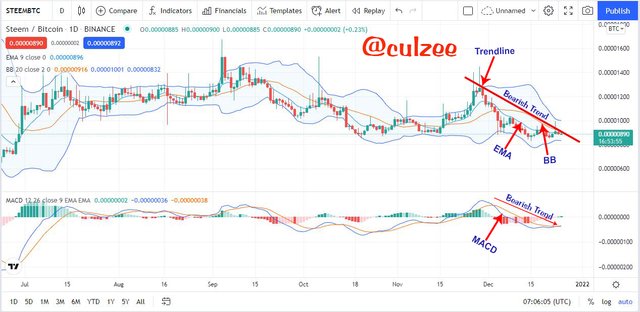
As you can see on the screenshot above, I used four trading tools for the confluence trading. The tools include:
- Trendline
- Bolinger Band
- Exponential moving average (EMA)
- Moving Average Convergence Divergence (MACD)
Looking at the screenshot chart, the price action is going in the downward trend. To confirm if it is really a bearish trend, I draw a trendline which shows that the price has not break market structure. The price did not break the trendline to create a new high that is higher than the previous lower high.
After that, I applied Bolinger Band, Exponential moving average (EMA) and Moving Average Convergence Divergence (MACD) which shows a downward trend respectively.
With all these indicators giving me the same bearish signal. I was then convinced the signal is valid. So I confidently go ahead to enter a selling position.

(c). What are the different signals observed on the chart?

 Screenshot from Tradingview.com
From the chart above, the major difference I observed on the chart is that before the bearish trend, the indicators did not signal a reversal at the same point. Each of them gives signal at a slightly different points. I marked the reversal points with small red circle.

Sell Order

The screenshot below is a STEEMBTC chart. As you can see, the chart is a bearish trend.
 Screenshot from Tradingview.com
To confirm the trend, I applied three technical indicators namely: Bolinger Band, Exponential moving average (EMA) and Moving Average Convergence Divergence (MACD).
All the three indicators confirmed that the trend is a bearish trend. With the confirmation, I then entered a selling position. See the screenshots below.
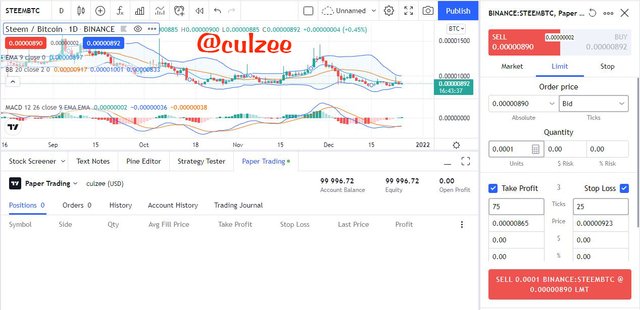 Screenshot from Tradingview.com
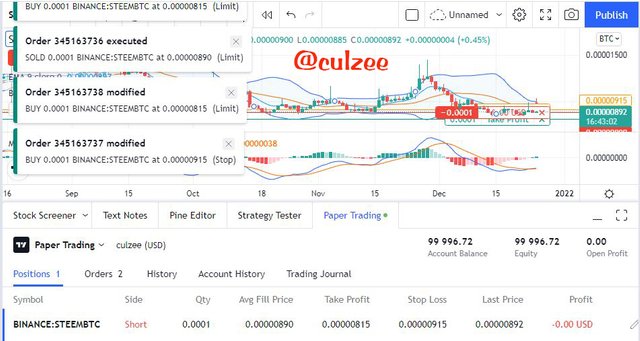 Screenshot from Tradingview.com
Buying Order

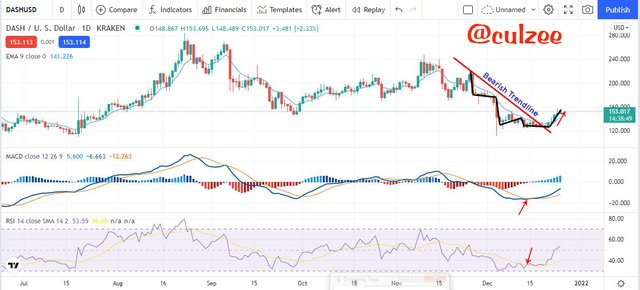 Screenshot from Tradingview.com
The above screenshot is a DASHUSD chart. As you can see, the price was making a series of lower highs and lower lows as indicated in the screenshot.
Observe that at a point the price failed to make a new lower low that is lower than the previous low and there was a break of market structure. The price action reversed from downtrend to uptrend.
To confirm the trend, I used four technical strategies which includes: Trendline, Exponential moving average (EMA), Moving Average Convergence Divergence (MACD) and Relative Strenght Index (RSI).
All the indicators confirmed that the trend is a bullish trend and With the confirmation, I then entered a buying position. See the screenshots below.
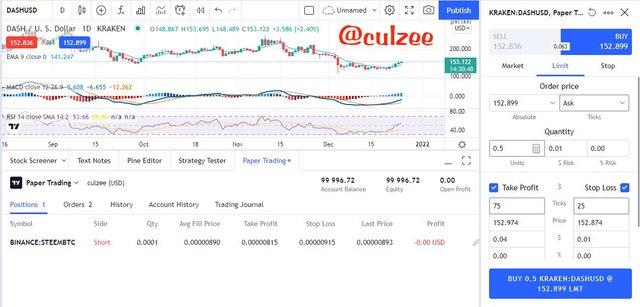 Screenshot from Tradingview.com
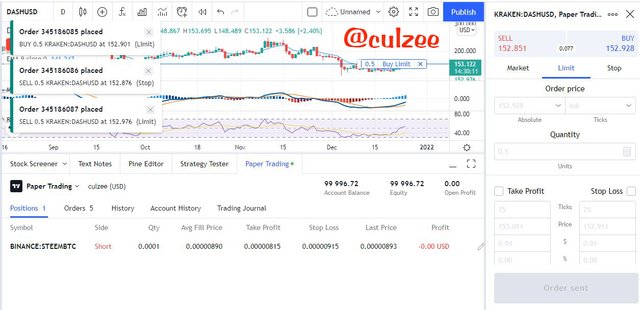 Screenshot from Tradingview.com
Conclusion

Investing in cryptocurrency market is risky. The reason is because cryto market is highly volatile. Based on this, traders should not be so careless or ignore the idea of conference trading to avoid huge loss in their investment.
We, as traders should not by any means rely on one strategy. We must make sure that we confirm any signal with at-least two other indicators before make trading decision.
In this home work, I have explained the meaning confluence trading and how a trade setup can be enhanced using confluence trading.
I have also explained the importance of confluence trading in the crypto market, and 2-level and 3-level confirmation confluence trading using any crypto chart.
Finally, I opened a demo trade on two crypto asset pairs using confluence trading which I analyzed by identifying the trend and the strategies/trading tools I used.
Thank you very much for reading my post. God bless you.

Hello @culzee , I’m glad you participated in the 6th week Season 5 of the Beginner’s class at the Steemit Crypto Academy. Your grades in this task are as follows:
Recommendation / Feedback:
I appreciate your effort in producing a quality content. Thank you for participating in this homework task.