Candlestick Patterns - Steemit Crypto Academy Season 5 - Homework Post for Task 10

Hello fellow steemians,
Its has been a wonderful learning experience. The invention of Japanese candlestick in the financial market is a very good development that has come with a better visual perspective for forecasting future market activities.
The lecture was well presented by pro. @reminiscence01. I gained a lot studying this topic.
Here is my home work.

1a) Explain the Japanese candlestick chart? (Original screenshot required). b) In your own words, explain why the Japanese Candlestick chart is the most used in the financial market. c) Describe a bullish and a bearish candle. Also, explain its anatomy. (Original screenshot required)
1a) Explain the Japanese candlestick chart? (Original screenshot required).

Cryptocurrency market is highly volatile and it requires a very good knowledge of market trend technical analysis before making a trading decision.
Before involving in market trend technical analysis, traders must first and foremost have a very good knowledge of candlestick chart pattern, because that is the basics of technical analysis.
Japanese Candlestick is the most popular technical analysis tool that traders use to chart and analyze the price movement in cryptocurrency market.
The idea of candlestick chart was invented in 1700s by a Japanese rice merchants called Munehisa Homma, during his routine trading. Homma discovered that demand and supply of rice market was determined by the emotions of traders. This discovery led to the foundation of candlestick.
This concept was made popular among Western traders by a broker called Steve Nison in the 1990s.
What is Japanese Candlestick?
Japanese candlestick is a style of price chart that is used by cryptocurrency traders to describe price movement of crypto assets. It shows the opening, closing, high and low price points for each given period. As you can see on my illustration below.
Japanese Candlestick graphically displays the patterns of price action using two different colors usually green and red to denote the differences. Below screenshot shows an example.
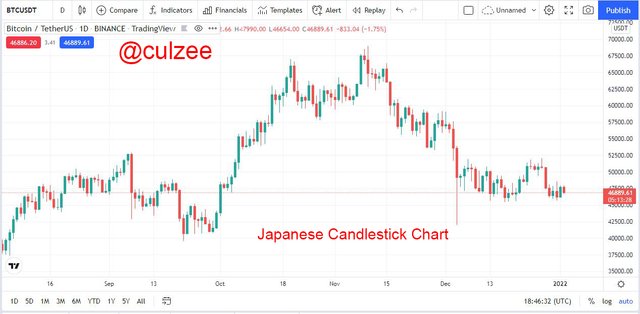
Screenshot from tradingview.com
Japanese candlestick is the most popular chart used by cryptocurrency traders today with technical indicators to analyse market trend before making trading decision.
The candlestick pattern is used to track previous price movements and to predict price reversals and trend continuations. It can be used to examine price action over any time frame.
Japanese candlestick is formed as a result of struggle between buyers and sellers of crypto assets on a particular asset.
b) In your own words, explain why the Japanese Candlestick chart is the most used in the financial market.
Since Japanese Candlestick chart became popular among Western traders in 1990s, traders all over the world started using candlestick charts in the financial market more frequently than any other technical analysis tool.
Below are some reasons Japanese Candlestick chart is the most used in the financial market:
It has a simple, easy-to-analyze appearance:
Japanese Candlestick chart is the most used in the financial market because it offers a better visual perspective for forecasting future market activities than bar or line charts. When traders look at the chart, it looks so simple and traders find it very easy to use when they are analyzing market trend.It provides more detailed information about the market at a glance than other charts:
Japanese Candlestick chart is the most used in the financial market because it gives traders enough information they need to technically analyze crypto asset price action than bar or line charts.It enables traders to easily see the current state of crypto asset in the market:
Japanese Candlestick chart is the most used in the financial market because when traders look at the colour and length of the candlestick, they can easily evaluate a crypto asset price movement, whether the market is going up or going downtrend.It enables traders to quickly recognize various market patterns:
Japanese Candlestick chart is the most used in the financial market because it helps traders to easily spot specific price reversal patterns that cannot be easily identified on other charts. The candlestick allows traders to identify many market trading chart patterns that can help them forecast the future price movements and to make profit from them.It enables traders to easily identify the direction of the market.
Japanese Candlestick chart is the most used in the financial market because the colour and shape of the candlestick can help traders to easily determine if the price of an asset is in an uptrend or a downtrend. Candlestick chart allows traders to quickly identify the market trends at a glance, so that they can quickly determine whether an uptrend is part of bullish momentum or a bearish one.
c) Describe a bullish and a bearish candle. Also, explain its anatomy. (Original screenshot required)
Before describing a bullish and a bearish candle, I will like to remind you that a Japanese candlestick is a price chart pattern that is used by cryptocurrency traders to describe price movement of crypto assets.
As I have explained in question 1a above, the candlestick shows the range of a crypto asset in a vertical line with four price points which includes: high, low, open and close. This is the base on which a bullish and a bearish candle stand.
Bullish Candle
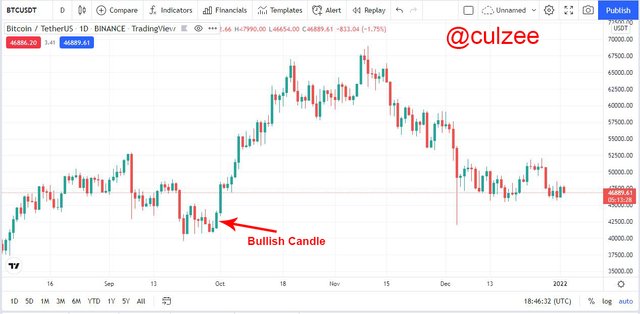
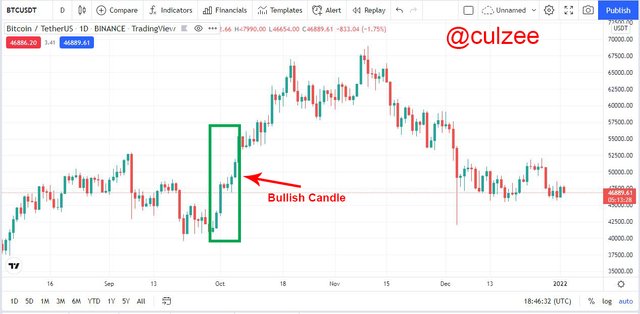
A bullish candle is a candle pattern that notifies traders that the market trend is about to go upward after a previous price downward movement. See below screenshot.
Screenshot from tradingview.com
Bullish Candle is a reversal pattern that gives signal that buyers are taking over the market and that they are pushing a crypto asset price uptrend creating opportunity for traders to enter a buy position. See below screenshot.
Screenshot from tradingview.com
You will observe from the above screenshot that there is a price reversal and the bullish candle has started building up leading to uptrend. See the next screenshot for a clear bullish or uptrend price movement.
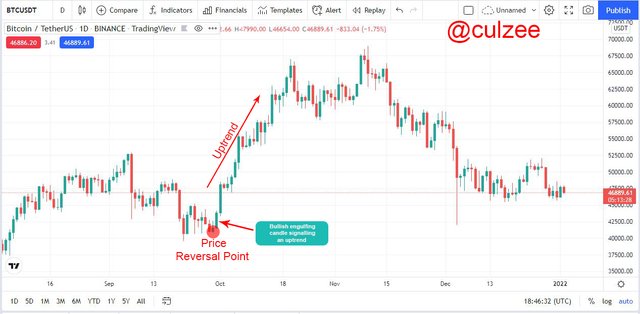
Screenshot from tradingview.com
As you can see the price actually reversed at the point I marked with small red circle as the bullish candle showed up and the market went upward trend. This is an opportunity for traders to enter a buying position.
Bearish Candle
A bearish candle is the opposite of the bullish candle. It is a candle pattern that notifies traders that the market trend is about to go downward after a previous price upward movement. See below screenshot.
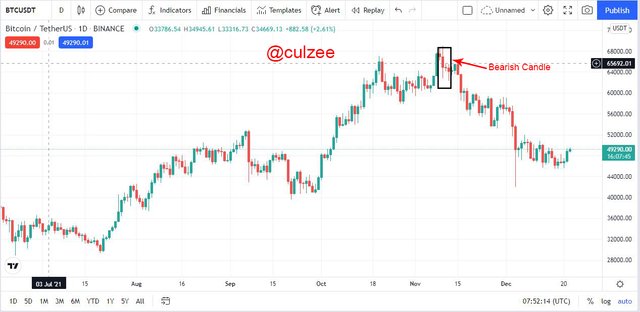
Screenshot from tradingview.com
A Bearish Candle is a price reversal pattern that gives signal that sellers are taking over the market and that they are pushing a crypto asset price downtrend.
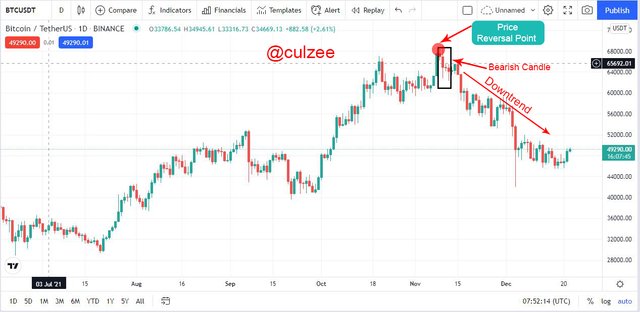
Screenshot from tradingview.com
As you can see from the above screenshots, when the bearish candle appeared, the price signals a reversal. Notice that at point I marked with small red circle that the price reversal took place and there was a downtrend. This is an opportunity for traders to enter a selling position.
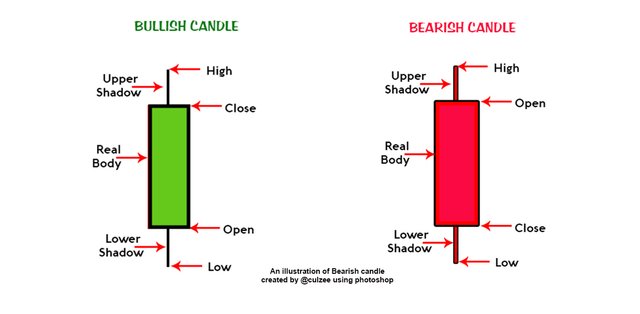
Bullish Candle anatomy
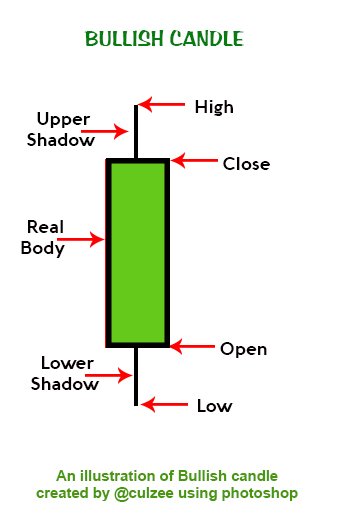
As you can see on the Bullish candle illustration I made with Photoshop, the bullish candle is a vertical line comprising of four price points: High, Low, Open and Close. It also includes other parts like the Upper shadow, the real body and the Lower shadow.
Let me explain them one by one.
Open:
This is the point where crypto asset price movement starts. The opening part of a bullish candle can be found at the lower part of the candle. When the price starts at this point, it will be marked and as the price moves upward towards the closing point, the price movement is recorded within a specified period of time.High:
This is the point on the candle that shows the highest price of a crypto asset that is recorded within a specified time frame.Low:
This is the point on the candle that shows the lowest price of a crypto asset that is recorded within a specified time frame.Close:
This is the point on the candle that indicates the last price or end value of crypto asset recorded in a candle. It shows the point where crypto asset price movement ends or closes within a specified time frame.The Upper shadow:
This part of Japanese candlestick indicates a point where the buyers had pushed the price of crypto asset to the highest region and the sellers are now struggling to take over the market from them. At the upper shadow region, there is no settled price movement because neither the buyers nor the sellers are able to push the price.The real body:
This part of a candle shows the space between the opening price and closing price. This indicates the extent buyers or sellers pushed the price within a specified time frame. The real body of a candle is usually coloured (green for bullish candle and red for bearish candle) for easy identification. Although traders can choose how to set up their charts with colours.The Lower shadow:
This part of Japanese candlestick indicates a point where the sellers had pushed the price of crypto asset to the lowest region and the buyers are now struggling to take over the market from them. At the lower shadow region, there is no settled price movement because neither the sellers nor buyers are able to push the price.
Bearish Candle anatomy
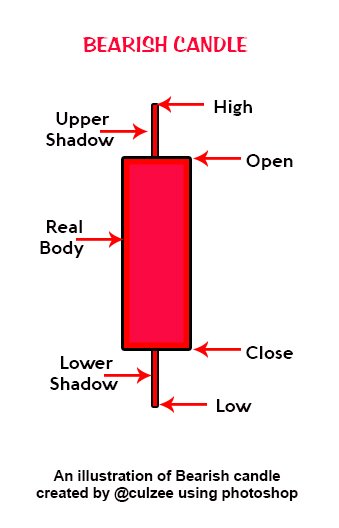
As you can see on the Bearish candle illustration I made with Photoshop, the bearish candle is a vertical line comprising of four price points: High, Low, Open and Close. It also includes other parts like the Upper shadow, the real body and the Lower shadow.
Let me also explain them one after another.
Open:
This is the point where crypto asset price movement starts. The opening part of a bearish candle can be found at the upper part of the candle. When the price starts at this point, it will be marked and as the price moves downward towards the closing point, the price movement is recorded within a specified period of time.High:
This is the point on the candle that shows the highest price of a crypto asset that is recorded within a specified time frame.Low:
This is the point on the candle that shows the lowest price of a crypto asset that is recorded within a specified time frame.Close:
This is the point on the candle that indicates the last price recorded in a candle. It shows the point where crypto asset price movement ends or closes within a specified time frame.The Upper shadow:
This part of Japanese candlestick indicates a point where the buyers had pushed the price of crypto asset to the highest region and the sellers are now struggling to take over the market from them. At the upper shadow region, there is no settled price movement because neither the buyers nor the sellers are able to push the price.The real body:
This part of a candle shows the space between the opening price and closing price. This indicates the extent buyers or sellers pushed the price within a specified time frame. The real body of a candle is usually coloured (green for bullish candle and red for bearish candle) for easy identification. Although traders can choose how to set up their charts with colours.The Lower shadow:
This part of Japanese candlestick indicates a point where the sellers had pushed the price of crypto asset to the lowest region and the buyers are now struggling to take over the market from them. At the lower shadow region, there is no settled price movement because neither the sellers nor buyers are able to push the price.
- CONCLUSION
Cryptocurrency market is highly volatile and it requires technical analysis before making a trading decision. The development of Japanese Candlestick has made charting and analyzing of price movement in cryptocurrency market simple and easier compared to bar or line chart.
In this home work, I have given a detailed explanation of the meaning of Japanese candlestick chart and why it is the most used in the financial market.
I have also described bullish and a bearish candle and its anatomy using my own original screenshots to show practical examples.
This is my last home work in the ten fixed Introductory Courses. I am very happy taking part in all the ten courses. I have really learnt a lot that will help me to grow in my journey to becoming a professional cryptocurrency trader.
My special thanks to all our lecturers especially @reminiscence01 who presented the last lecture and to you,@dilchamo who takes time to review and grade our home work.
Thank you and remain blessed.