Crypto Academy Week 12 | Homework Post for @kouba01 | Cryptocurrency Trading with RSI
Dear Steemians,
Another week started in Steemit Crypto Academy with some great lectures and I will be talking about Cryptocurrency Trading with RSI by Steemit Crypto Academy Professor @kouba01, who explained in-depth about different aspects of RSI with practical examples and I was able to understand the following thing from this lecture;
- Basics of RSI Indicator
- RSI Measurement and Parameters
- Adding and Configuring RSI
- Using RSI with Divergences and Trend
- Examples of Cryptocurrency Trading with RSI


Homework Task
At the end of the lecture, students were assigned a homework task by Professor @kouba01.
- What is the Relative Strength Index - RSI and How is it Calculated?
- Can we trust the RSI on cryptocurrency trading and why?
- How do you configure the RSI indicator on the chart and what does the length parameter mean? Why is it equal to 14 by default? Can we change it? (Screen capture required)
- How do you interpret the overbought and oversold signals when trading cryptocurrencies? (Screen capture required)
- How do we filter RSI signals to distinguish and recognize true signals from false signals. (Screen capture required)
- Review the chart of any pair (eg TRX / USD) and present the various signals from the RSI. (Screen capture required)
- Conclusion :

What is the Relative Strength Index - RSI and How is it Calculated?
Relative Strength Index (RSI) is an oscillating indicator developed by J. Welles Wilder to evaluate the strength of the current market. It indicates and identifies overbought and oversold conditions of the market and help us making our trade decision better.
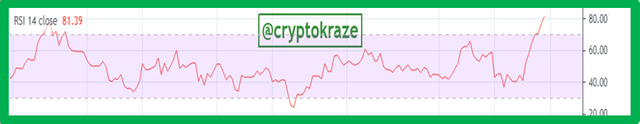
RSI is shown on the charts as a line graph at the bottom and it ranges from 0 to 100. There are two critical levels (30 and 70) that are used generally to indicate oversold and overbought market conditions.
RSI line at 30 level or lower indicates oversold conditions and traders see this as an opportunity to make their buy entries because market is likely to change trend and move upward.
RSI line at 70 level or lower indicates overbought conditions and traders see this as an opportunity to make their sell entries because market is likely to change trend and move downward.
These levels are not trademark and traders can use their own tweaking to adjust these levels like 80 and 20. Personally, I like to use 68 and 32 as overbought and oversold criteria.
Paste RSI indicator window from Trading View
If we want to calculate RSI then the following formula can be used.
- RSI = 100 - [100/1+RS]
RS in this formula represents the ratio of average gains / average losses over a certain period of time. The time period can be different and depends upon traders choice. By default, RSI time length is 14 which means RSI will change average value after 14 intervals. These intervals will be 14 hours if we have applied RSI indicator on hourly chart while these intervals will be 14 days if we have applied the indicator on daily chart.
Can we trust the RSI on cryptocurrency trading and why?
As a technical analysis trader, I would suggest not relying on RSI alone because this is just one indicator. In trading world, you can never rely on 1 indicator and RSI is also a lagging indicator which means it shows data after market movements.
At times, you will feel RSI is the best indicator when the market is reversing from the overbought and oversold levels. At the same time, you will see on many occasions that the market doesn't respect these levels and continue the trend.
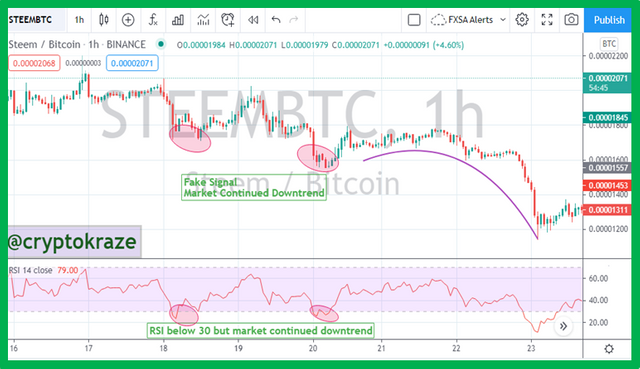
In cryptocurrencies trading, the fluctuations and volatility is much more and uncertain than forex market. I don't rely fully on RSI in forex market, so I can not rely on RSI for cryptocurrency trading as well.
RSI should be used only as an indication that market has reached a potential reversal area and we should decide on running positions. About making new entries, I will need more confirmations like Liquidity levels and market structure break before I can take a reversal entry.
How do you configure the RSI indicator on the chart and what does the length parameter mean? Why is it equal to 14 by default? Can we change it? (Screen capture required)
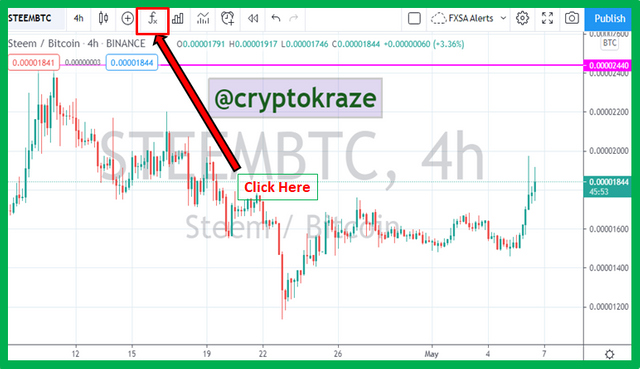
I do my technical analysis mostly on Tradingview so I will be using my Tradingview Pro+ Account for making this step-by-step guide on configuring RSI indicator on the chart.
Step 01
- Select a cryptocurrency chart you want to add RSI. I have selected Steem Chart for this tutorial.
- Click on the Indicators icon (Fx) as shown in below image
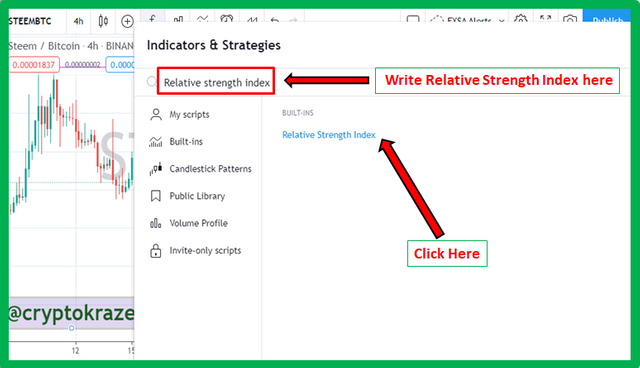
Step 02
- A pop up window will appear, write relative strength index in the search bar
- Click on Relative Strength Index under Built-in tab as shown below
Step 03
- RSI indicator will be added to the bottom of your chart as shown below
Step 04
- Click on the settings icon of the indicators window and select the RSI inputs. I am keeping these at the default setting.
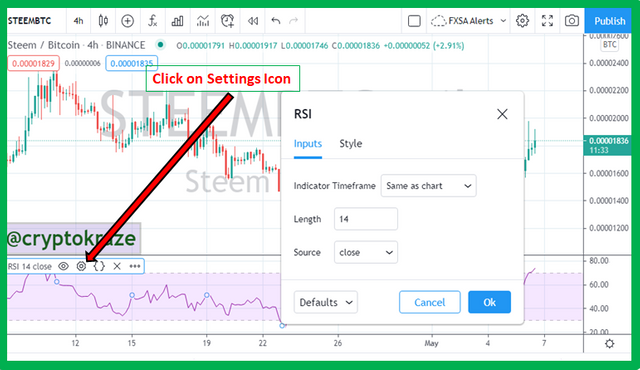
Step 05
- The style settings are for selecting the upper and lower levels that are the most important part of RSI. By default, they are set at 70 and 30. I am keeping the default settings for this tutorial but they can be changed according to traders choice.
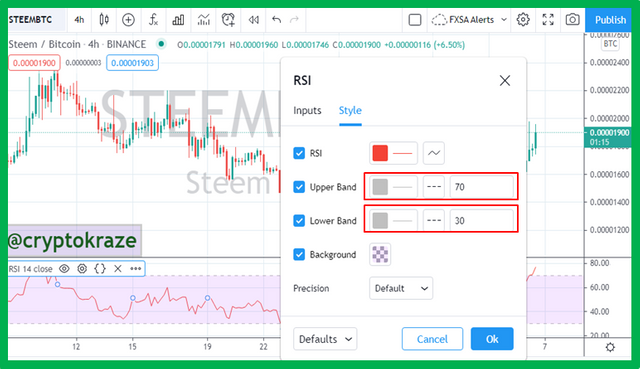
- By following the above steps, RSI indicators will be successfully configured to the chart.
The Importance of Length Parameter
In RSI indicator settings, the length parameter is most critical because it is used to calculate the average value over a certain period of time. The length determines the movement of RSI line graph. If we select a lower value of length then the line graph will be changing quickly while if the value is higher then line graph will be changing slowly.
The length parameter is set at 14 by default because this is the value where RSI is moving at an average of 14 time interval and shows better stability to market movement, providing a better indication of market strength. This 14 lenght is the time interval that means the average value is being calculated after 14 intervals. If the chart is set at 1 hour, the average value will be calculated after 14 hours while it will be calculated after 14 days if chart is set at daily time frame.
Can We Change Length Parameter?
Ofcorse, we can change the length parameter by going to RSI settings and change the value of length parameter.
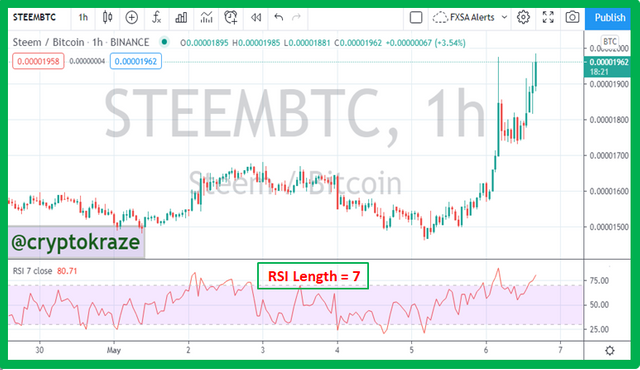
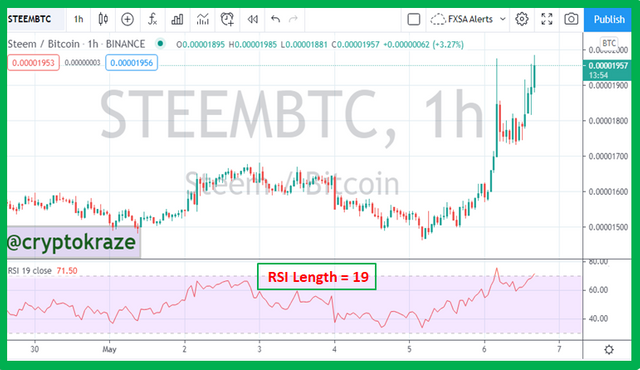
If you are a scalper or intraday trader you can decrease the length parameter below 14. For example, I have selected length 7 for intraday setups because it will move quickly and give me an early indication of potential price reversal.
If you are a swing trader you can increase the length parameter above 14. For example, I have selected length 19 for swing setups because it will save me from early movement fakeouts at crucial liquidity levels. You can see there are less fluctuation on 19 length and the line graph has better stable movement.
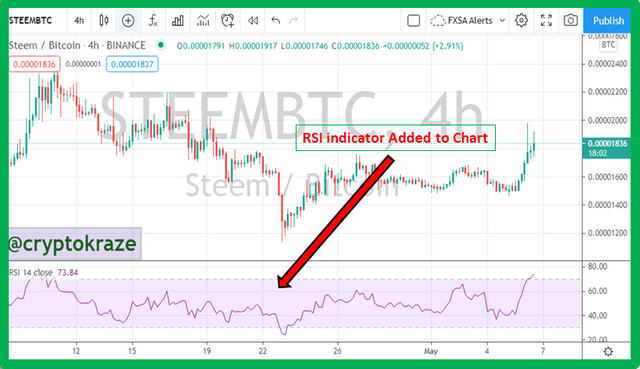
How do you interpret the overbought and oversold signals when trading cryptocurrencies?
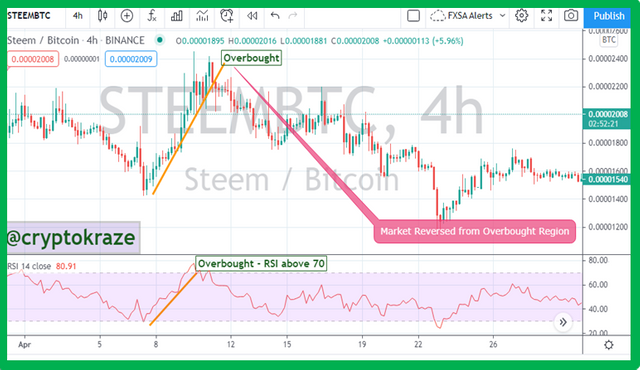
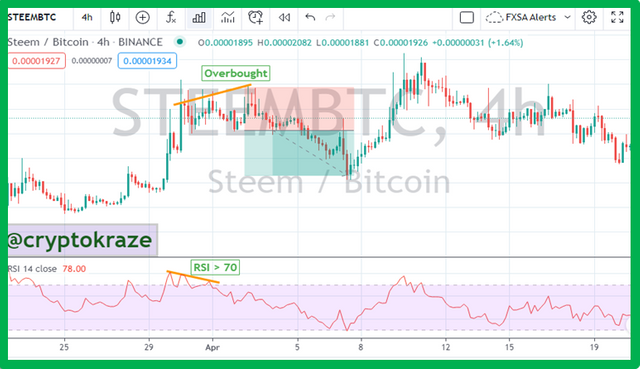
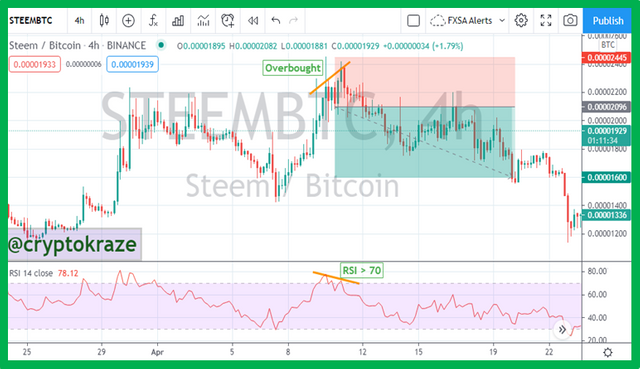
When any cryptocurrency is in an uptrend and reaches 70 level or above, it is an indication that the market is overbought and there is a likelihood of potential market reversal. The market trend is going to exhaust and Bears will come to maket and take over the bulls. See the below chart where RSI reached above 70 level and the market reversed successfully from that point.
For example in the below chart, Steem has reached to overbought level and then reversed perfectly from that zone.
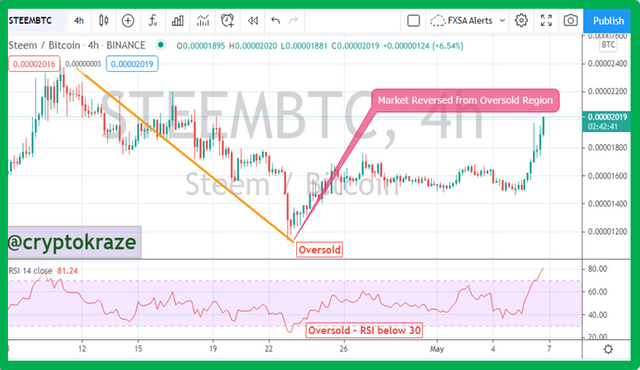
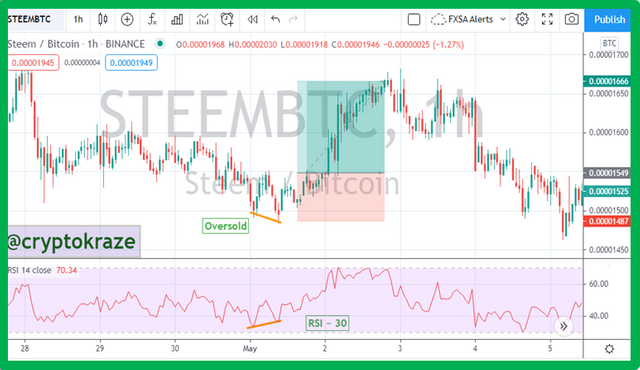
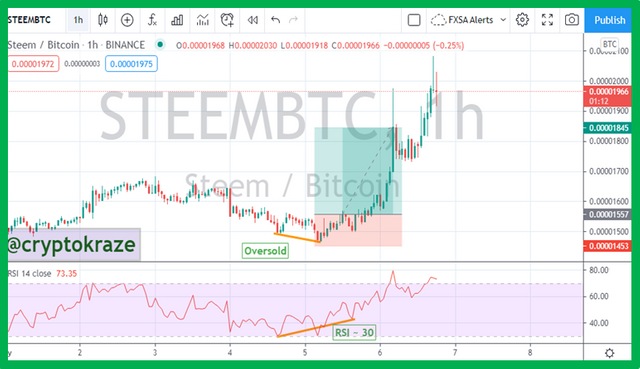
When any cryptocurrency is in a downtrend and reaches 30 level or below, it is an indication that the market is oversold and there is a likelihood of potential market reversal. The market trend is going to exhaust and Bulls will come to maket and take over the Bears. See the below chart where RSI reached below 30 level and the market reversed successfully from that point.
For example in the below chart, Steem has reached to oversold level and then reversed perfectly from that zone.
** How do we filter RSI signals to distinguish and recognize true signals from false signals?**
As I mentioned earlier that we cannot rely on RSI alone and need to confirm entries using different confluence parameters. I will be discussing two things (Divergence and Market Structure Break) that I used to filter signals when trading based on RSI
Divergence
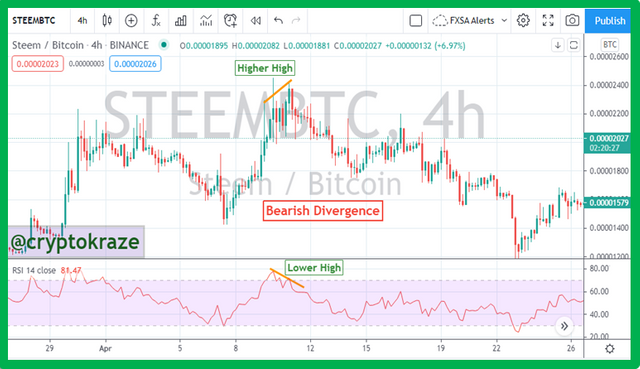
This is the first confluence parameter that I use to filter out false signals from RSI. In simple words, this is a technical pattern in which any cryptocurrency price and RSI make opposite movements.
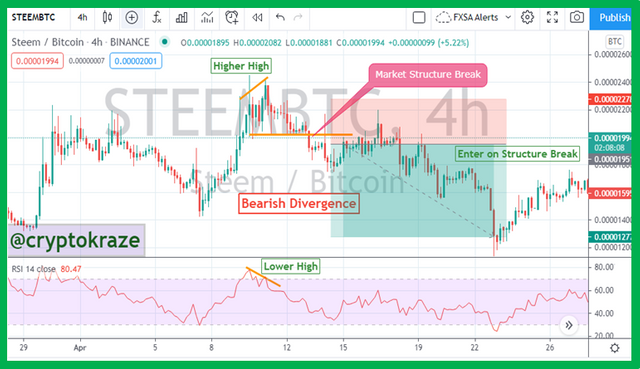
In Bearish divergence, price makes higher high while we will see a lower high formed on RSI. A bearish divergence around 70 level will give me confidence to think about taking a sell. A bearish divergence is shown in below Steem chart.
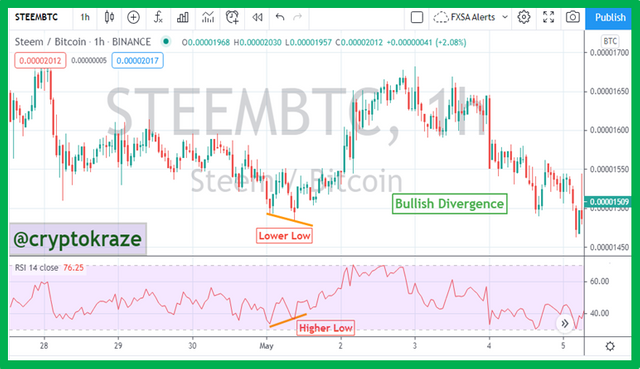
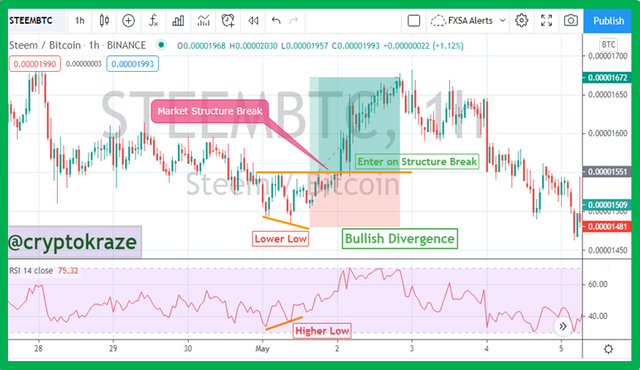
- In Bullish divergence, price makes lower low while we will see a high low formed on RSI. A bullish divergence around 30 level will give me confidence to think about taking a buy. A bullish divergence is shown in below Steem chart.
Market Structure Break
In simple words, it is the change in market trend when price makes lower high in uptrend and when price makes higher low in downtrend.
After I spot a bearish divergence on RSI, I will wait for market stucture break and take entry on structure break as show in below chart.
- After I spot a bullish divergence on RSI, I will wait for market stucture break and take entry on structure break as show in below chart.
Review the chart of any pair (eg TRX / USD) and present the various signals from the RSI
I will be using Steem/BTC chart to show various signals from RSI indicators that were valid and price respected the RSI overbought and oversold levels.
Sell Signals
Below are two sell signals on Steem/BTC chart when RSI entered the overbought territory RSI above 70 and the market respected it and reversed from those level. There were also Bearish divergence and Market Structure break to make these signals more valid.
Buy Signals
Below are two Buy signals on Steem/BTC chart when RSI entered the oversold territory RSI close to or below 30 and the market respected it and reversed from those level. There were also Bullish divergence and Market Structure break to make these signals more valid.
Conclusion
- Relative Strength Index (RSI) is a useful indicator that can give us an idea of possible market reversal and decide about running trades.
- We can configure RSI according to trade styles like intraday and swing trading by changing the length parameter.
- We cannot rely fully on RSI for trade entries because it gives false signals in case of a strong trending market.
- We should use other confluence parameters like divergence and market structure break to make better entries.
I would like to pay my thanks to our Crypto Professor @kouba01 for this wonderful lecture and looking to learn more in the coming weeks.
CC: @yohan2on
Hello @cryptokraze,
Thank you for participating in the 4th Week Crypto Course in its second season and for your efforts to complete the suggested tasks, you deserve a 10/10 rating, according to the following scale:
My review :
I was waiting for your post because I really enjoy the look and the content of your writing. As usual, your answers were of a precise and clear methodology. About the signal filtering question, you could have expanded further as a reminder to compare RSI with other indicators to confirm or reject the signal, but it doesn't prevent me from giving you the full mark.
Thanks again for your effort, and we look forward to reading your next work.
Sincerely,@kouba01
Thank you for appreciating my work. It is an honor for me that you liked it.
Regarding filtering the fake outs, my preference is always the price action specially the market structure break. I also use liquidity levels when I consider taking a reversal trade. The reason why I didn't added another indicator for filtering the signal is that it would be more or less similar in terms of reacting to market and lagging mostly. Price action has always given me better entries and avoid the fakeout almost 100% of the times.
Thanks for understanding my methodology
Regards
I see the next professor in you ...awesome work bro
Thank you for clarifying your strategy.
Always a pleasure. I will be looking to learn more from your next task.
Haven't seen someone doing crypto tasks better than you 🙌
MashAllah
Thanks for the appreciation
Very nice post.
Twitter Share
You have elaborated the each and every question so briefly and comprehensively that one can understand the analysis bases on RSI very easily. keep doing such work for the education of steemians.