Using your knowledge of technical analysis demonstrate your understanding of Swing trading
My expectations
A clear trading plan
- A Crypto asset pair
- What's your Entry and exit strategy?
- Multiple time frame analysis
- Candlestick analysis and use of other relevant supporting indicators for your trade decision.
- Trade management ( Setting stop loss, trailing stop and take profit)
Welcome to another homework by professor @yohan2on
Introduction
Trading has different strategies, and all boils down to making a profit at the end of the day. There are many trading styles that people use to analyse the market and also we have different type of traders, and patterns of trading. but I will be focusing on swing trading
image source
what is swing trading?
As explained by our professor, swing trading deals with taking a short time period in trade. It can be within days or weeks. This type of trading is done using either technical analysis or fundamental analysis, and sometimes both depending on the trader's understanding. These tools are used to decide the state of an asset and when to enter the market and make profit within a short or medium period of entry
Swing traders take risk of losing a part of their assets by using stop loss. When the market goes against their prediction, and the price drops to hit the stop loss, the trade cuts and the remaining fund goes back to their wallet. The take profit also is another way that swing traders get their profit. Once the price of an asset hits the maximum point where the take profit is set, the system automatically takes the profit. Take profit and stop loss helps a swing trader a lot because they will not panic over watching the market at all times. Most times when they check the market, it's either the market is still running or they've taken their profit, and vice versa. So in a nutshell, A swing trader uses the risk/reward ratio based on a stop loss and profit target, and also the technical indicators or price action movement to trade
First, the crypto asset pair I will be using for my analysis is BNB/BTC, but first let me explain my entry and exit strategy.
What's your Entry and exit strategy?

image source
My entry and exit strategy is based on the support and resistance level of the asset I'm trading. I'll check the resistance and support level accompanied by some technical analysis. There's this rule that most traders follow and it has proven to be effective to some extent. When the support and the resistance level of an asset is spotted, trade can be determined using that speculation. If the price of an asset reaches the resistance level, it either retrench or breaks the resistance level. In such case, the trader gets his profit if the support level is well noticed and followed
The same is applicable to the support level. For the asset to go below this level, it would have to be at the breaking point. So the resistance and the support is the best point for my entry and exit point
So, since I have known my tactics for my entry and exit point, let me analyze the asset BNB/BTC using multiple time frame analysis.
I will start by studying the 1-month time frame to know the direction of the market and how the asset has been performing. Getting the lowest low and the highest high within this period will help me analyze the 1 week, and daily time frame, because these are the best frame that would help determine the best entry point in other to make profit within a short period of time
The 1-month time frame
gg.png)
Checking the one-month equity curve of the graph, it is a bullish trend. The market opened around 0.00003 and moved up to 0.002639 before it created the spot for resistance and support. The support line was at 0.001205, and the market maintained the tempo for some time before the first breakpoint at the resistance level, which later retrenched to the normal level, before the final breakpoint with a great spike up to 0.012368, which is the highest level for the month. Now, what I observe is that it would be a little difficult for the price to fall back to the support level. From the look of things, the market will create a new support and resistance level as it moves
EXplaining the trend with the candlesticks.
We can see the last red candlestick. It has a long shadow and the body is small despite the wide range of price movement. It is a signal of indecision, and it can be called a neutral candlestick. This could be a continuation pattern, maybe after creating new support and resistance
The 1-week time frame
guvg.png)
The one-week time frame is more of a zig-zag movement between 0.002693 and 0.002000. As we can see, the market was moving between the resistance and the support level at almost a steady manner until there was a slight breakpoint in a bearish direction before a reversal that caused a huge spike
Candlestick
The bullish movement continued, and at a point, there was a three-line strike, and this sign is used to determine the likely persistence of the trend. We can see that the price retrenched after those strikes as if the bears are taking over the market, but the next candle that formed was a bullish one, which implies that the market might keep moving up
4 hours time frame
dfr.png)
From the 4 hours chart, there was great pressure on BNB, as the price dropped drastically which implies that people are selling and a few are buying. At 0.012258, the price retrenched to 0.007019 creating a new support level. At that point, the bears took back and there was a bullish trend as seen in the image. But my main concern is this: I can't enter at this point because there's is a possibility of the market moving towards the new support line. If at all I'm going to make an entry, I will allow the movement to be around 0.007565, and set my stop loss at 0.007019 which is the support level
Using a technical analysis
I will be using the StochasticRSI indicator to support my decision in the trade. I would be combining 1 hour and a 15 minutes time frame because I prefer it that way, and believe it gives the best result
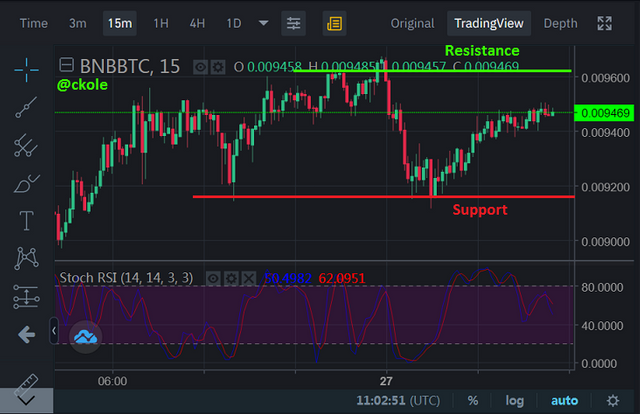
In the 15 minutes time frame, I spoted my support and resistance first and drew a line. I then switched to 1 hour time frame to draw other lines of support and resistance to know how the market has been moving up and down and how far the trade has been creating different support and resistance level within those time frame
.png)
As we can see from the above image, I created several support and resistance lines and when I checked my stochasticsRSI, the line was at 40. And as we know that the stochasticRSI oscillates between 20 and 80 as seen in the image, it indicates over bought and over sold, which are majorly the turning point. So looking at the resistance level, and the stockRSI level at 40, we can place our stop loss and take profit between the second support with the green dotted lines and a little above the resistance
Take profit will be around 0.009500, and stop loss at 0.008426. I use this stop loss because if the stochRSI will come down further to reach that support level, it would move towards 20 which is very low, and with the candle sticks sprouting, there's a possibility of the market moving up. That's why I set my take profit not too high. Had it been the StochRSI is like 25, I would have extended my take profit with respect to the support level at that point
I was about to post and I saw this.
After some hours of my analysis, where I set my take profit at 0.00950, I discovered the market has gone bullish to 0.009541 above my take profit point. I talked about the stochsticRSI at 40, and I said the possibility of it going down more is slim. It rose above 80, so I think I made a right prediction with my analysis.
###PROOF
hhol.png)
Conclusion
Swing trading is one of the best because of the rest of mind it gives the traders. It is not stressful compared to some other trading styles where you check the market almost every time to know whether you've made profit or at a loss. Once a trader can understand the strategies of swing trading, it becomes a part of him. I used the support and resistance strategy to analyse my entry and exit point. I also did my technical analysis using stochacticRSI to determine where to put my take profit and stop loss. I love swing trading.
Thanks to @yohan2on for his wonderful lectures and the homework. I've learned a lot.
Thanks for reading
CC
@steemcurator01
@steemcurator02
@yohan2on
Hi @ckole
Thanks for participating in the Steemit Crypto Academy
Feedback
This is good work. Well done. You clearly demonstrated your understanding of Swing trading.
Homework task
8
Thanks prof. I appreciate your decision