Hello everyone. I'm glad to participate in this week's homework. Thanks to our professor @kouba01 for walking us through the entire series of lectures. As I've learned from the lectures he delivered, here is my homework.

Question 1
Explain the Williams %R indicator by introducing how it is calculated, how it works? And what is the best setting? With justification for your choice
The Williams percent range (W%R) came into existence in the 70's precisely 1973. An economist named Larry Williams invented this wonderful technical indicator. The indicator is seen as a momentum indicator that works similar to a stochastic indicator because it ranges between 0 and -100
How the Williams percent range is calculated, and how it works
Let's have some parameters to show how the Williams percent range is calculated, and how it works
Variables
Let
highest high of the past "N" period = hhnp (Maximum value)
Lowest low of the past "N" period = llnp (Lowest value)
Most recent closing price = mrcp (price at daily close)
So to calculate the Williams percent range, here is the formula below
(hhnp - mrcp) / (hhnp - llnp) * -100
So now for example, if the highest high of the past period was observed to be 100, and the daily closed price (most recent) is 79, while the lowest low is 75, here is how the calculation would go
W%R = (100 - 79) / (100 - 75) * -100
W%R = 21 / 25 * -100
W%R = 0.84 * -100 = -84%
Therefore, W%R = -84%, which signifies an oversold and at this level, you can decide to sell or buy depending on where you are transacting
The best settings for williams percent range indicator
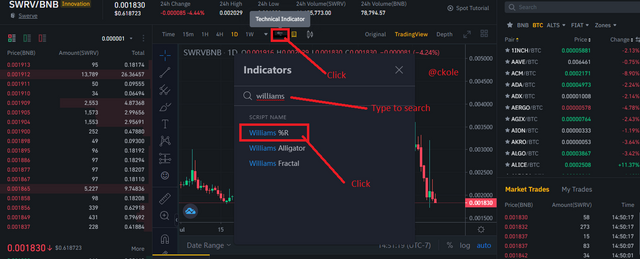
Every trader have different styles and techniques when it comes to setting up indicators for trading. We all have different preferences, but in my case, (since I'm just learning how to use the Williams percent indicator0, I would stick to the recommended standard settings which is 14 days period. Here is how to set the W%R on Binance
.png)
- Click the indicator sign as shown above and type Williams in the search option and once it shows the williams%R, you click and it would reflect on the chart.
.png)
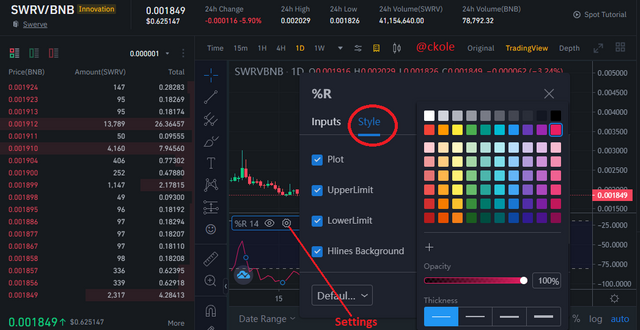
You can also set the color of the lines and the levels as shown in the above image.
.png)
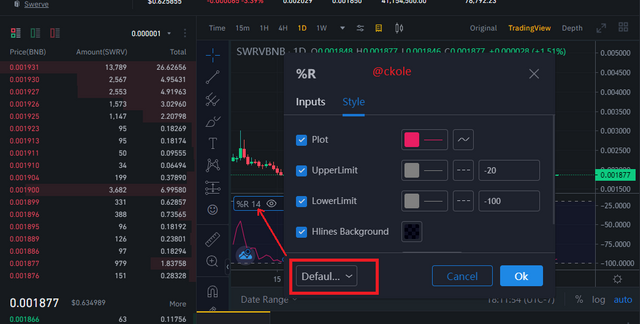
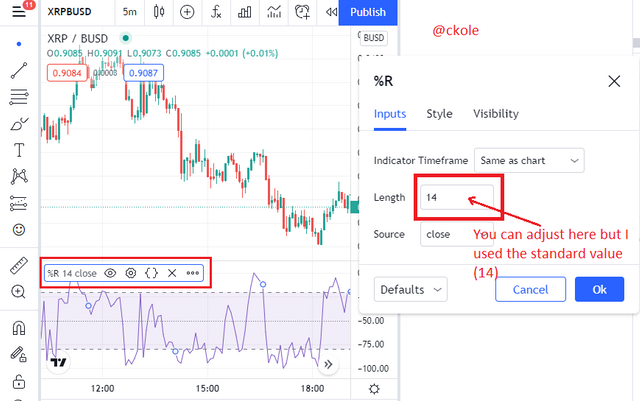
The default setting is 14 period so I decided to stick to that because it's the standard settings
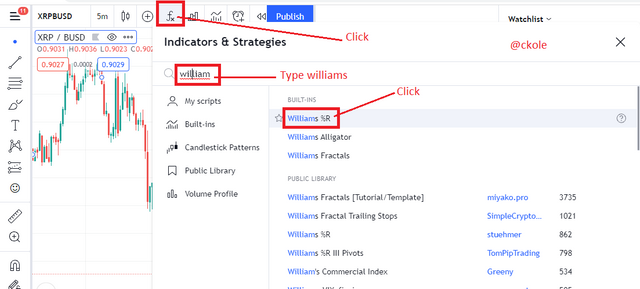
On Tradingview, it can be set easily too by clicking on the FX butting, typing Williams in the search option, and clicking on williams%R as displayed in the image below
.png)
.png)
Question 2
How do you interpret overbought and oversold signals with The Williams %R when trading cryptocurrencies? (screenshot required)
The Williams percent range is classified as an oscillator because it ranges from 0 to -100, and between these values determine the overbought and oversold level of an asset. When the W%R is between -80 and -100, the market is said to be at an oversold level, and when it's between -20 and 0, it's regarded as overbought
.png)
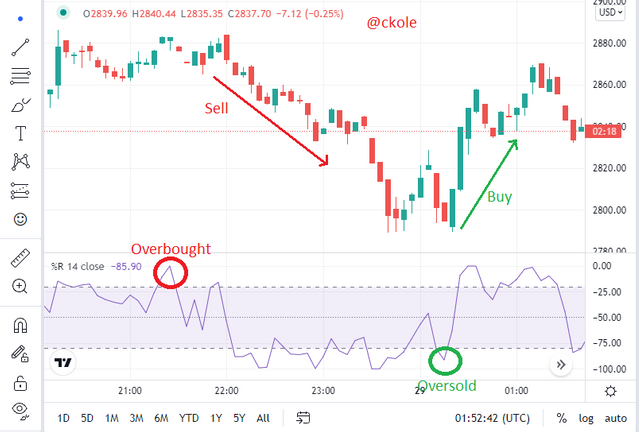
From the image above, we can see that when the graph is between 0 and -20, the price of the asset started coming down, which signifies overbought, and at the same time when it was between -80 and -100, the price reversed and start moving back up, and this signifies oversold. But we must not quickly decide to buy or sell when we see that a market is at an oversold or overbought level. We must wait for a confirmation before we enter the market. If the market is at an overbought level, we must wait for it to decline before selling. The same is applicable to oversold. We must wait for a sign of bullish movement before we buy
Question 3
What are "failure swings" and how do you define it using The Williams %R? (screenshot required)
Swing failure with respect to the Williams percent range happens when the price of an asset finds it difficult to reaffirm a new high in an upward movement and a new low in a downward movement. The Williams %R is an oscillator that ranges between 0 and -100, so when the price of an asset could not in an uptrend surpass the -20 range or could not fall below the -80 in a downward trend, then we can say swing failure has set in. And this means that the market is weakening which is an indication of reversal at the level between not above -20 or -100. Let's see the chart below
.png)
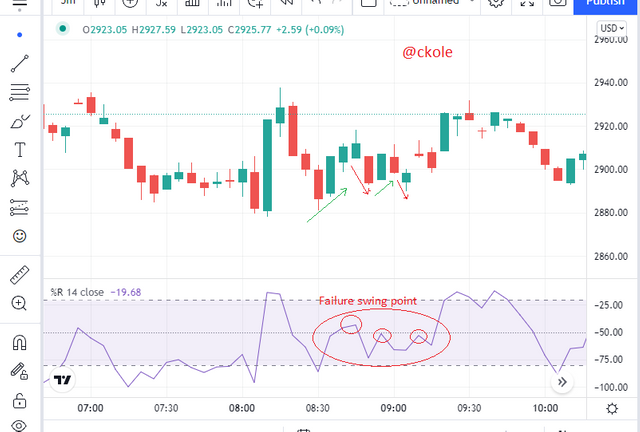
From the image, we can see that the price of the asset was moving in between the -20, and -80 range. at that point in time, the price couldn't move above -20 in an uptrend movement, and also couldn't move below -80 in a bearish trend.
Question 4
How to use bearish and bullish divergence with the Williams %R indicator? What are its main conclusions? (screenshot required)
The bearish and bullish divergence is a signal that can tell us the next direction of price movement. It hardly occurs but when it's noticed, it's a very good opportunity to profit from the market
The Bearish divergence with W%R
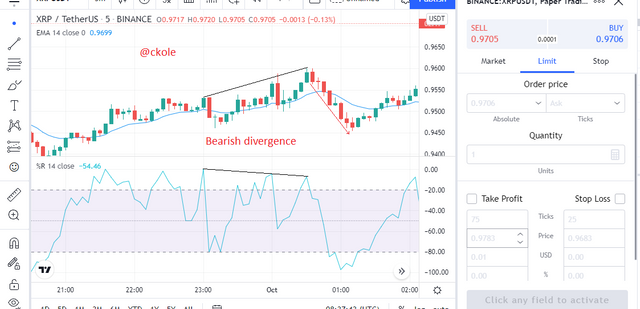
The bearish divergence occur when the price of an asset is moving downwards but the direction of the W%R graph isn't respecting the price movement. Instead, it moves in the opposite direction. While this action is taking place, traders can decide to enter a trade and sell because the bearish divergence occurs when there are weak buyers, and there's always a chance that the price would be corrected
The image below shows the bearish divergence
.png)
The Bullish divergence with W%R
The bullish divergence occur when the price of an asset is moving upward, but the direction of the W%R isn't respecting the price movement simply because there are weak sellers, and this signifies that there could be a reversal, and so at this point, a trader can decide to prepare for a buy
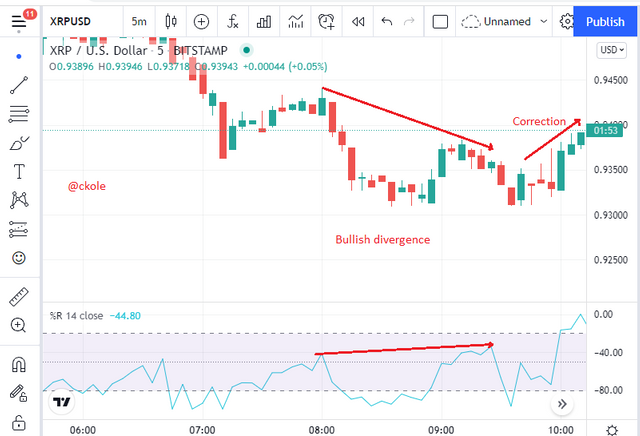.png)
Each time there's a divergence on the Williams % R graph, it's certain that the market would correct so that's why the bearish and bullish divergence is a good signal to take note of because we are always looking for opportunities to enter or exit a trade at the right time
Question 5
How do you spot a trend using Williams %R? How are false signals filtered? (screenshot required)
The Williams percent range is very unique, but more useful when used with another indicator. The EMA is one of the first indicators that is mostly used with the W%R. Using these indicators together breeds more output than using it alone. So applying the EMA with the W%R would allow us to determine false signals
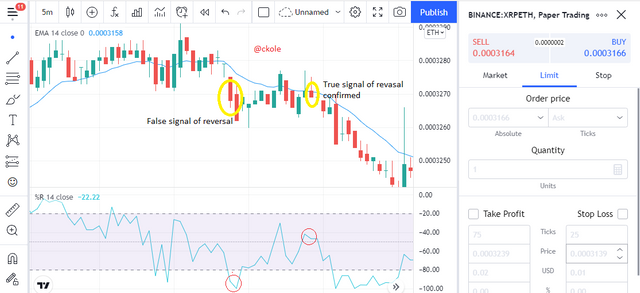.png)
Question 6
Use the chart of any pair (eg STEEM/USDT) to present the various signals from the Williams %R indicator. (Screen capture required)
The main signal that the Williams percent range gives are 2. It clearly shows us when an asset is overbought or oversold. Other signals still respect these two signals because everything that happens on the W%R graph falls between 0 and -100. The failure swing falls between -20 and -80, while the overbought and the oversold falls between(-20 and 0) and (-80 and -100) respectively
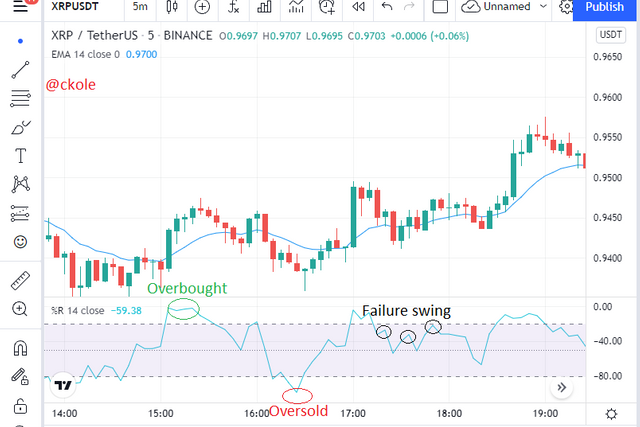.png)
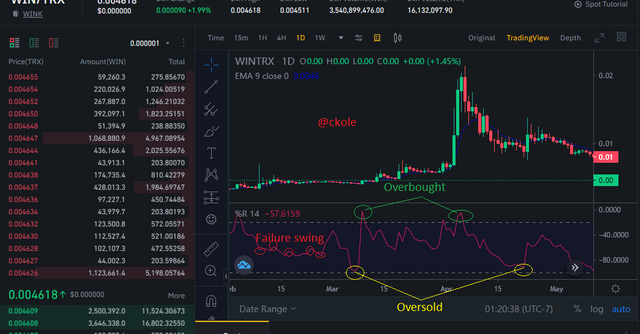.png)
From the image, I was able to produce three signals that I see as important in the W%R indicator.
the overbought level is a signal that tells a trader to prepare to sell
The oversold level is a signal that informs a trader to buy
The failure swing shows the weakness of the price movement which gives us an insight into the reversal
The pros and con of using the Williams percent range indicator
Pros
W%R can be used with many indicators which means it's very flexible
The failure swing is a very important part of the indicator because it can help to identify trend reversal at an early stage, and if we make good use of it, we would be even, and not odd in the market.
Cons
The W%R is a good indicator, but sometimes, at the overbought or oversold level where we are to make decisions of buying or selling, the price might not reverse. It might keep following the trend even after the normal level is broken. That's why it's important not to base our trade on only the oversold and overbought level, rather, we should wait for confirmation before entering the market. By and large, the indicator does not give a 100% signal at the oversold and overbought level, however very effective
Conclusion
The Williams percent range is a very good indicator especially when used with other indicators. Using it with a moving average (EMA) would bring out its effectiveness more. At the overbought point, a trader can sell, and when the asset is oversold, we can buy. This indicator has a sound basis in fact and logic following the rate of its efficiency. However, understanding how where, and when to use it makes the tool more valid
Thanks to professor
@kouba for taking us through this lecture. Learning can never stop until we take our last breath. I'm glad to benefit from this wonderful and intelligent lecture
Thanks for reading
This is ckole the laughing gas.
One love.
CC: @kouba01
Reference: All images are screenshot from Tradingview and Binance. They are my original images.

.png)
.png)
.png)
.png)
.png)
.png)
.png)
.png)
.png)
.png)
.png)
.png)
Hi @ckole
Thanks for participating in the Steemit Crypto Academy
Feedback
This is good work. Thanks for taking the time in demonstrating such a clear understanding of trading with the William %R indicator.
Total| 8.5/10
Thanks prof for the feed back. More grace