
There's no one that has gotten a little deep in the knowledge about support and resistance that wouldn't know some reasonable things about it especially any one of us that has been following the crypto academy curses back to back. This season's lectures by
@cryptocraze and
@kouba01 all wrapped around these levels
My humble regards goes to all the steemit team, the profs, and all steemians. This week, we are trading the dynamic and support resistance. There are many questions to tackle under it, so get your couch balanced for a comfortable reading as I proceed. Thanks for taking your precious time to continue reading this piece. I'm more than grateful
Let's start with the concept of dynamic and resistance

Question 1
What do you understand about the Concept of Dynamic Support and Resistance? Give Chart Examples from Crypto Assets. (Clear Charts Needed)
Support and resistance have been one of the major techniques used by many people, and geniuses to propound their theories and calculations be it as it may. I can remember several techniques that are wrapped around support and resistance level, though with a different calculation in its entirety. As far as I've been concerned for a long time, There have been no other way to mark support and resistance level other than drawing a straight line. And of Couse, it has helped. However, the fact that these levels can be measured without focusing on the horizontal line was unleashed in the presentation by
@cryptocraze, which is so much interesting
As I've thought that support and resistance are measured via drawing a horizontal line, so also I've equipped my analysis arsenal with the fact that there are support and resistance levels that we might not seem to notice or probably ignore as such, and that is where the DYNAMIC SUPPORT AND RESISTANCE comes in
The EMA which is the Exponential moving average was used by our professor
@cryptocraze to ride the trend that acts as dynamic and support level. Before we see the chart example from a crypto asset, let's get a glimpse of what EMA is
What is EMA (Exponential moving average)
EMA is an indicator that shows the direction of a trend and also the moving averages connected with support and resistance levels. So the EMA indicator act as a feature that helps to understand the psychology of the strategy
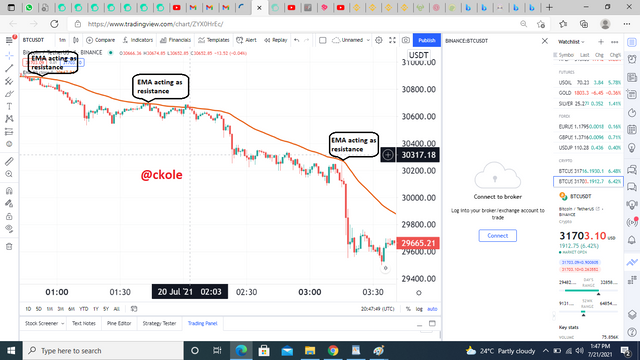
Chart example from a crypto asset
The charts are 15 and 1 minutes charts respectively.

Another chart
%20res.png)
From the two images above, price reacts to the EMA line whenever it touches it by reversing. The EMA line act as the resistance and the price of the asset find it difficult to cross it
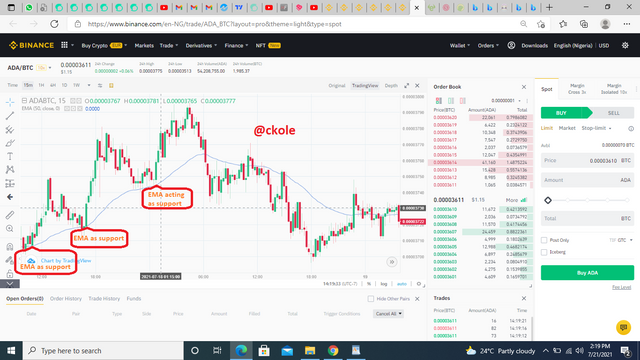
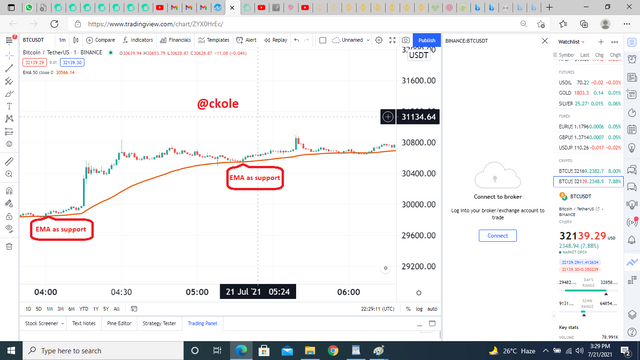
Chart where EMA act as support
%20%20support.png)
Another chart
%20as%20supportttt.png)
From the two images above, price reacts to the EMA line whenever it touches it by rebounding. The EMA line act as the support and the price of the asset find it difficult to cross it
Question 2
Make a combination of Two different EMAs other than 50 and 100 and show them on Crypto charts as Support and Resistance. (Clear Charts Needed)
To make different combinations of EMA's other than the 50 and 100, we have to go to the settings and adjust to our desired figures. Let's see the images below on trading view
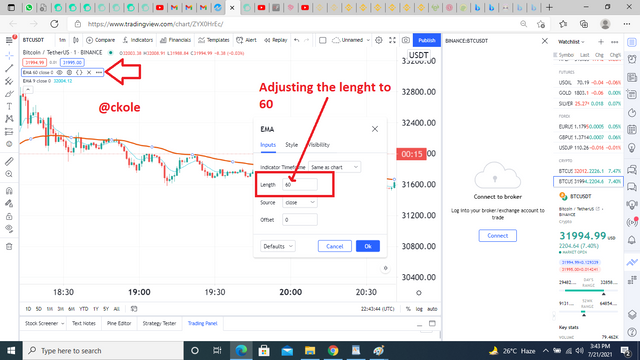
I adjusted the length of the EMA line to 60
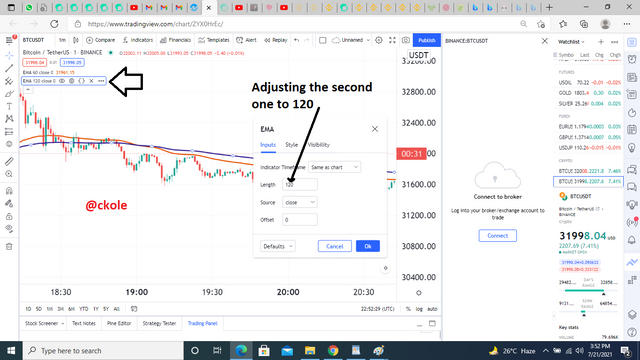
This one was adjusted to 120, and I also changed the color of the line to deep blue and made it thick for a clearer view.
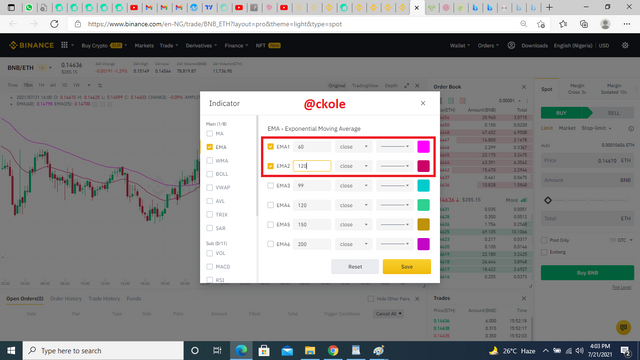
How it looks on Binance
.png)
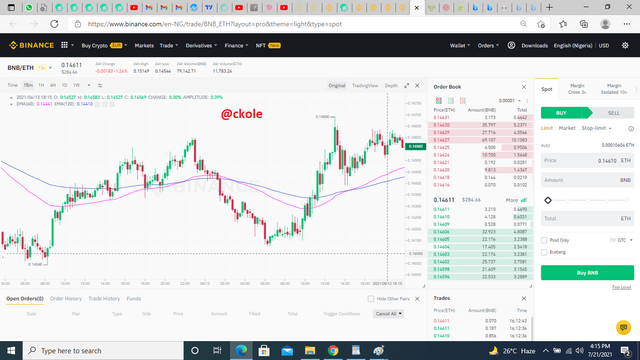
Showing the 60 and 120 EMA's as support and resistance on a chart
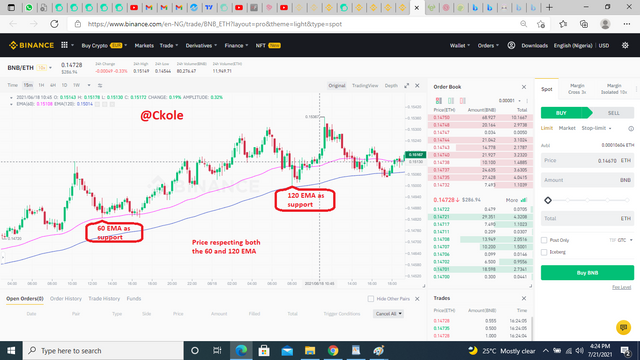
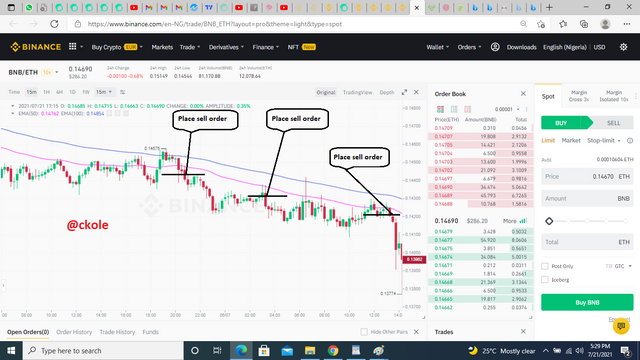
The above image shows the 60 and 120 EMA's acting as support on the BNB/ETH pair on a 15 minutes chart. As we can see that the price of the asset keeps respecting both Exponential moving averages. Whenever the price touches either of the lines, it pushes it back up

The above image shows the 60 and 120 EMA's acting as resistance on the BNB/ETH pair on a 15 minutes chart. As we can see that the price of the asset keeps respecting both Exponential moving averages. Whenever the price touches either of the lines, it rebounds and pushes it back down
Question 3
Explain Trade Entry and Exit Criteria for both Buy and Sell Positions using dynamic support and resistance on any Crypto Asset using any time frame of your choice (Clear Charts Needed)
There are some things to put into consideration before applying the EMA as regards entry and exit in both buy and sell positions. I will list some criteria below
These criteria are applicable to both buy and sell positions.
- We must ensure we use the 50 and 100 EMA settings.
- Sometimes, the price may or may not touch the lines before reversing, and also, it sometimes touches the line and pierce it. So, it's important to wait and be patient to allow the price to touch the line and create a reversal
- Whether we are buying or selling, we must ensure that the price of the asset we are dealing with is above the two EMA's when we are buying, or below when we are selling before we place an order.

Buy order

Exit criteria for sell position
Setting stop-loss is also important in case the price refuses to respect the normal trend after entry.
This Stop Loss level should be below the 100 Exponential Moving Average (EMA).
Take profit should also be set in other to automatically trigger when it goes in the direction.
Using a 1:1 ratio is also reasonable, especially for newbies, until the technique is mastered. Only then is advisable to play around the risk-reward ratio as dim fit by the trader.
We should consider taking profit, when the asset's price reaches the profit target, and keep an eye on another potential entry.

Exit criteria for buy position

Question 4
Place 2 demo trades on crypto assets using Dynamic Support and Resistance strategy. You can use a lower timeframe for these demo trades (Clear Charts and Actual Trades Needed)
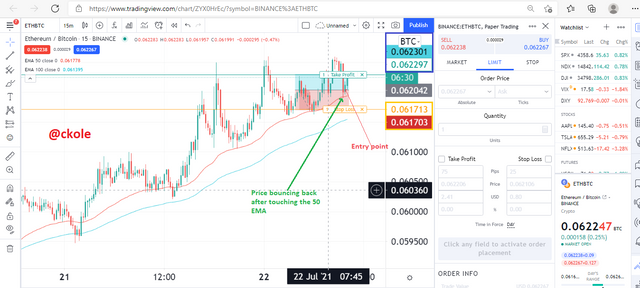
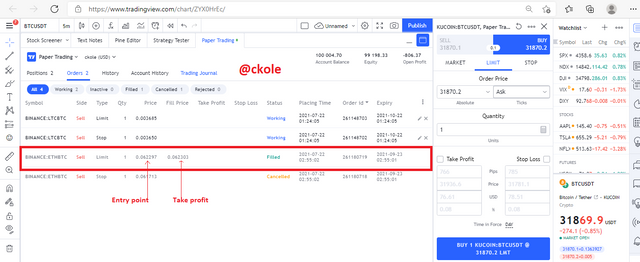
Following the rules behind using the Exponential moving average as support and resistance to enter and exit a trade. I placed a trade when I noticed that the price hit the 50 EMA and bounced back. I ensured that the price move above the EMA's before placing my trade
placed trade at 0.062057
stop-loss at 0.061713
Take profit at 0.062303
profit $7.90

I also made another trade. Actually, it's advisable to keep the profit level to 1:1 RR, which implies that the risk and reward ratio should be the same. However, I sometimes increase my reward ratio and reduce the risk, but reasonably. The main point is to know the right time to enter a trade and know where to place your take profit and stop loss
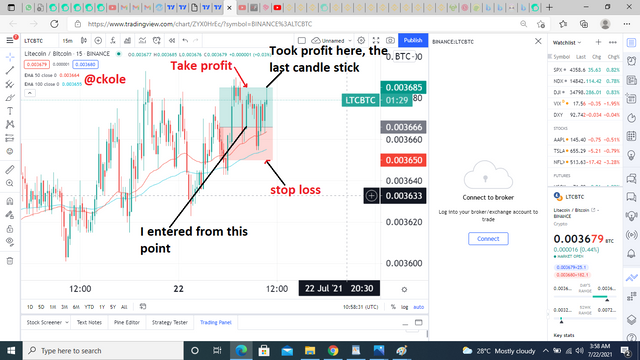
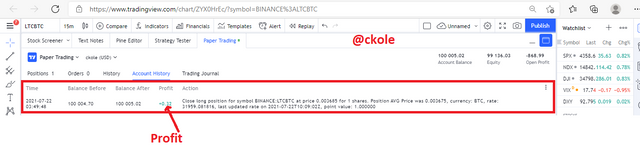
Of course I followed the rules. I entered when the price moves above both 50 and 100 EMA, and when I set my stop loss and take profit, I ensured my stop loss goes below 100EMA, unlike the first trade I placed where It a little below the 50 EMA. If I had not set my stop loss well, the trade would have gone against me, because when the price went up close to my take profit level, it retrenched and broke the 50 EMA, moving close to the 100 EMA, before it started going up and ranged for some time before it finally hit my take profit. It took more than 3 hours because it's a 15 minutes chart of LTC/BTC pairs, that breed many candles on its journey
Conclusion
The exponential moving average is a very cool tool that can be used to mark the support and resistance of price movement in a chart. One of the important and interesting parts is that with the use of EMA, one can quickly understand the trend and get into it quickly. However, one needs to understand some concepts before trading the dynamic support and resistance, like knowing the trade exit and entry point which determines the profit and loss
I also noticed personally that if the EMA's follow a positive slope, greater than 300, there's is a high probability of seeing a bullish trend, which would help traders to use the EMA effectively with the dynamic support and resistance, and vice versa. So we should always trade with the direction of the trend
Also, a ranging market where the lines are touching each other is not a good entry point. We should allow the lines (whether it's a double or multiple EMA's) we are using to be apart. There's always multiple higher high and higher low on every chart that we can utilize using the Dynamic support and resistance strategy with the use of EMA's. I've used the EMA's and I can testify that using it is a nice approach any trader can imbibe to equip his trading arsenal. Thanks to
@cryptocraze for taking us through the lectures. I really appreciate his effort
Thanks for reading.
This is ckole the laughing gas.
One love


%20res.png)
%20%20support.png)
%20as%20supportttt.png)


.png)


Dear @ckole
Thank you for participating in Steemit Crypto Academy Season 03 and making efforts to complete the homework task. You got 10/10 Grade Points according to the following Scale;
Key Notes:
We appreciate your efforts in Crypto academy and look forward for your next homework tasks.
Regards
@cryptokraze
Thanks professor. Always respect your decisions. You are indeed a good leader. Looking forward to participating in another homework. One love