.png)
Hello everyone, It's cool to come back again this week to participate in another homework by our professor
@cryptokraze. Thanks for the support and the time invested in teaching us, prof. In this homework, I would be discussing
What I understand about the Sharkfin pattern
Implement an RSI indicator to spot sharkfin patterns
Write the trade entry and exit criteria to trade sharkfin pattern
Place at least 2 trades based on sharkfin pattern strategy

Question 1
What is your understanding of Sharkfin Patterns. Give Examples (Clear Charts Needed)
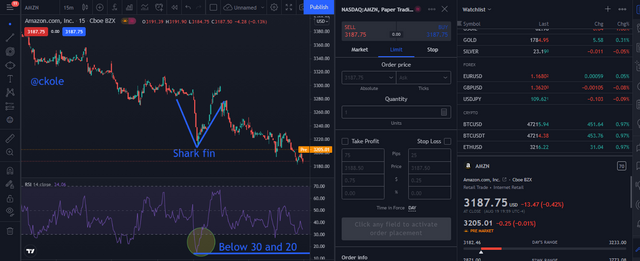
The volatility of the market makes it move up and down always and it moves in a fast way creating various patterns. That point where there is a fast movement, and a sharp reversal creates a shark fin pattern. Shark fin is always created both in an upward and downward direction. When the price of an asset builds up a V shape, that's a shark fin pattern, and conversely, when there is a reversal that creates an inverted V shape, it's also called a shark fin pattern
Let's see examples of shark fin patterns
.png)
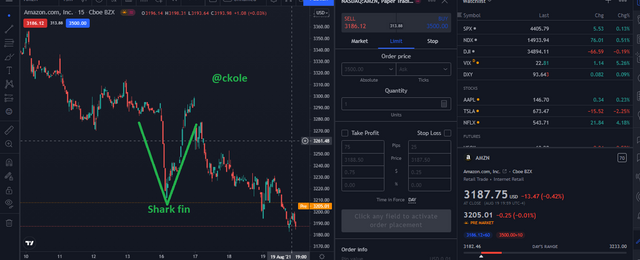
From the chart above, we can see that the shark fin pattern forms a V shape. As the price quickly rises, it reversed and dropped as fast as it rose. That's a shark fin in V shape
.png)
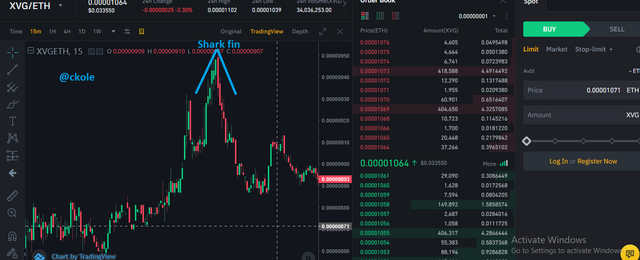
We can see the difference between the first and the second chart that the shark fin pattern formed here is inverted
.png)
The price of the asset quickly trends upward and immediately reversed to form an inverted V.
Question 2
Implement RSI indicator to spot shark fin patterns. (Clear Charts Needed
By mere looking at any chart, it's visibly easy to spot the shark fin pattern, because the V shape is visible, but in other to spot the shark fin pattern correctly, we have to use a confirmation tool to help us decide well and make a good trade. Using the Relative strength index indicator (RSI) would help to determine the right time to follow the shark fin pattern
We must ensure that we use default settings of the RSI, where the length should be 14, with 30 and 70 bands. To spot a shark fin in an uptrend chart, the RSI must go above 70, and in a downward manner, the RSI must be below 30. This is the right confirmation to hold before concluding the shark fin pattern
.png)
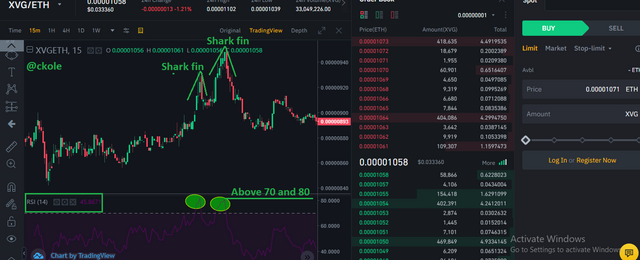
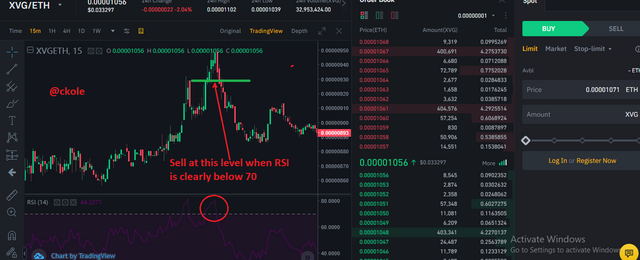
From the above chart, the RSI was used to confirm the reversal, and as we can see, the RSI went above 70 and made a reversal to form the inverted V shape
.png)
Here also, the RSI was used to confirm the shark fin pattern. The RSI went below 30 and there was a reversal that resulted in the V shape we see in the above chart
Question 3
Write the trade entry and exit criteria to trade sharkfin pattern (Clear Charts Needed)
In other to trade shark fin patterns, we must put some things into consideration.
We must ensure that we have the RSI indicator on our chart to monitor price movement, and know when to make an entry
We must be patient enough to note the fast movement of price action in the market and at the same time, the sharp reversal that forms a V shape
In the case of a market-moving upward, we must make sure the RSI moves above 70 and the reversal goes below 70 showing an inverted V shape
To place the sell order, we must ensure that the RSI has clearly gone below 70
.png)
From the chart above, we can see that the RSI moves below 70, and that is the right place to place a sell order. Why we wait for the RSI to move below the 70 mark is for a visible shark fin V shape. If we don't confirm the V shape before entering the market, there can be a reversal. Until we see a clear V shape, it's not advisable to jump in
.png)
In the case of entry criteria for a buy position, we must ensure to follow the same rule.
Our RSI indicator should also be available and set at default
We must also be patient enough to note the fast movement of price action in the market and at the same time, the sharp reversal that forms an inverted V shape
We must make sure the RSI move below 30 and the reversal goes above 30 showing a V shape
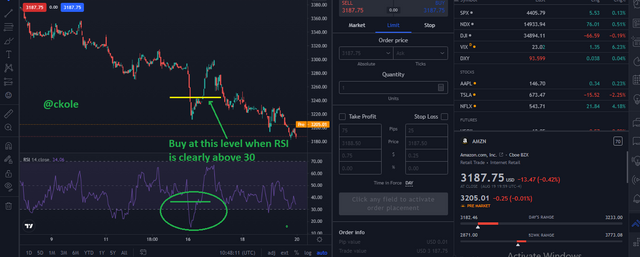
To place the buy order, we must ensure that the RSI has clearly gone above 30
As seen in the image above, the entry point is above 30 using the RSI indicator. That is when it's certifiable to enter the trade.
Question 4
Place at least 2 trades based on sharkfin pattern strategy (Need to actually place trades in demo account along with Clear Charts)
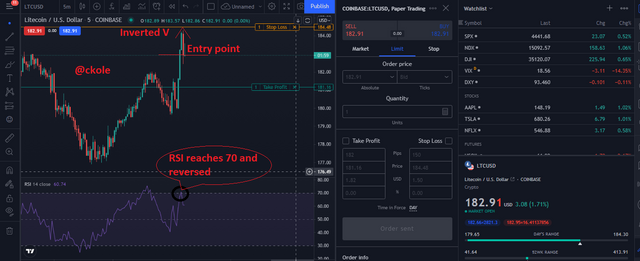
I had to patiently wait to see a clear signal before placing a trade. I practically placed my trade based on both shark fin V and inverted V pattern which means buy and sell. The first image shows where I place a trade after I discovered that the RSI reached and go above 70, and made a reversal below 70. Also, I initiated take profit and stop loss as seen in the chart in case the trade goes for or against me. I made sure my stop loss is set below the swing low point of the shark fin. This is a 5-minute chart of Litecoin / USD. See it below
fff.png)
Selling
From the ETH/BTC 15 minutes chart below, I used the RSI indicator to spot a better entry point. I ensure that the RSI line move below 30 and reversed above 30 such that I can clearly see the V shape before placing my trade as seen in the image using 1:1 risk management ratio
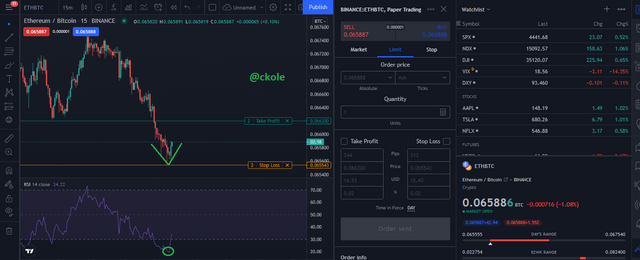.png)
Buying"
After some moment of placing the trade here is the outcome below
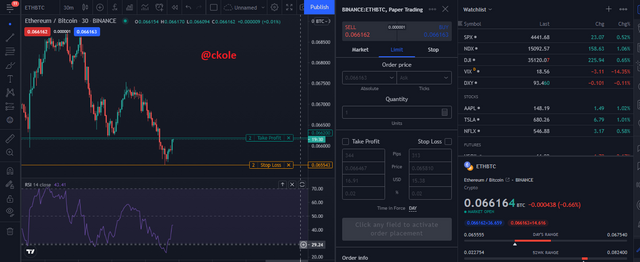
Trade in my favor
Conclusion
The shark fin pattern is a useful pattern that can be used by traders to enter the market and exit quickly. The shark fin pattern is used mostly on a short time frame like 1 hour, 30 minutes, 15 minutes depending on how best we can apply it, and how best it suits us
It's important not to forget to use our desired indicator to know our entry and exit point. RSI indicator was used in this write-up and it's set at default. This is indeed a wonderful pattern that can help a trader to trade multiple times in a day following the pattern closely
Thanks for reading.
cc: @cryptokraze