Hello, my fellow steemian and crypto enthusiasts. It's another homework time, so let's see how much I've learned from the professor plus personal research and a lot of practice at home. Lol. It's been a smooth ride, and I appreciate everyone touching me through reading, votes, comments, resteem, follow, and so on. My appreciation to everyone knows no bounds and a huge kudos to the profs and the steemit team. The academy has helped me learn a lot. Lets' get to business

Question 1
What is your understanding of the Liquidity Level. Give Examples (Clear Charts Needed)
IN every setting where things are traded, there should be a buyer and a seller. The availability of both parties gives rise to liquidity. If Mr. A wants to sell an asset and there's no Mr. B to buy, it means there is no liquidity at any level So
The degree to which an asset can be sold or bought is referred to as liquidity.
It deals with how easily an asset can be bought or sold
How you can quickly get money out of an asset because investments can be said to have good liquidity when you can convert them into cash whenever you wish.
In a liquid market, there are always traders/investors willing to trade securities at every price level.
Liquidity also refers to a market with high trading activities
Liquidity level is important while considering trading positions and the ability to exit. The liquidity level ensures traders can easily get in and get out, which mean they can buy and sell at all levels
I think I love the definition given by the professor @cryptocraze
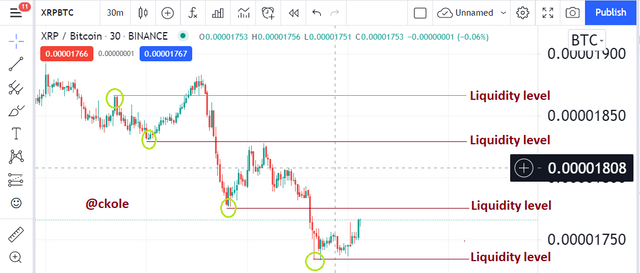
In the trading market, liquidity is referred to a level where significant trading activity happens in form of filling many orders.
Yes. in other to trade, you must either buy or sell, and this is done by placing orders. It's either you place your order according to the current market price or set your price according to how you predict the market with your understanding of the movement using the desired strategy. This gives rise to setting your stop loss and your take profit and all these are important levels that can be referred to as liquidity levels
.png)

Qustion 2
Explain the reasons why traders got trapped in Fakeouts. Provide at least 2 charts showing clear fakeout
Fakeout does two things.
It trap buyers
And it hurt sellers
Traders either try to buy at a price ceiling and sell after a price floor. They put a line at the resistance or the support level and when the price breaks those levels, they get in for a buy or a sell. And surprisingly, the big guys called the market makers or brokers already know this trick. They are always in the market to take retail traders money because retail money is a sort of liquidity basis for them to fill their orders
Most retails traders like to place their orders after a breakout, and this is the reason they get trapped because the market makers play a manipulating role at this level which causes fakeout where a lot of traders jump into the market for a sell and the market would reverse against them and take off their money as it hits their stop loss, and vise versa. And we can say this happens to buyers because of the fear of missing out
Since many people like trading with the trend, they are always waiting for the opportunity. So they are always afraid to miss out on a trend they've been waiting for and the market has a way of taking around those areas where they know a lot of liquidity is built. So once traders jump in, the market reverses quickly taking out a lot of people by surprise
.png)
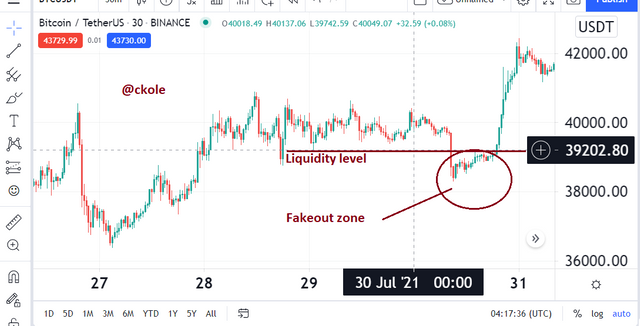
From the above image, we can see that the price of the asset testing the liquidity level as it goes zig-zag at that point. This is a scope to fake traders. After some time, the liquidity spike sets in as you can see the red candle stick-breaking the liquidity level. Here, you see many traders following the trend a breakout has been identified, but immediately after the breakout, there was a reversal and the market start moving up again. That little breakout that happened is the fakeout that the composite men use to trap many traders
.png)
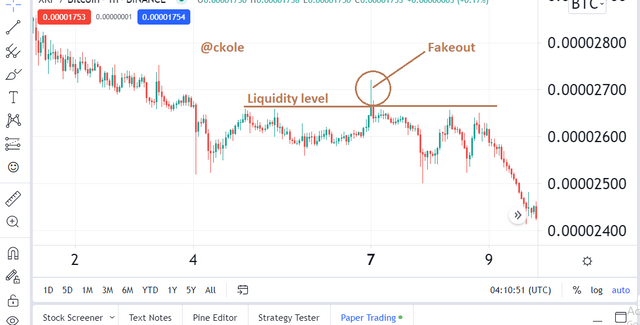
We can notice fakeout in either upward or downward trend. The above image shows another breakout level. The green candle spike is the fakeout zone where traders would believe that there is gonna be a bullish movement and get into the market, but before saying Jack, it rolls back, and they are trapped
Question 3
How you can trade the Liquidity Levels the right way? Write the trade criteria for Liquidity Levels Trading (Clear Charts Needed)
There are different ways to trade the liquidity level the right way. To me, I believe the first thing to put into consideration is knowing the liquidity levels, before deciding where to enter the market and where to put your stop loss and take profit. According to the prof's explanation, using the BRB or the MSB strategy would help
Support and resistance is just the historical price area where the price is rejected or reversed multiple times, and most importantly, this is the area where things happen
Supply and amount area which we can also call the liquidity level are fresh levels that are not tested more than two or three times or more which gives probability in the trade set up
In the MBS strategy, we have three levels namely
Ranging level
Breakout level
Trending
Some things must be considered before entering the market using MBS.
We must be conversant of the fact that the price of the asset must have a higher low after it has created several lower lows in the case of downward movement. Also, we must draw a line that would serve as the neckline immediately after the lower low. This neckline is there to keep us on alert for a clear break because once the price breaks through, it's a clear sign that the price would break. But we must not jump in immediately. We still need to wait for a confirmation and we must ensure that we enter the trade below the market structure which is above the bullish candle that broke through the neckline
For the upward movement, we should just ensure that the price of the asset must have a lower high after it has created several higher high. Also, we must draw a line that would serve as the neckline immediately after the lower high. This neckline is there to keep us on alert for a clear break because once the price breaks through, it's a clear sign that the price would break. But we must not jump in immediately. We still need to wait for a confirmation and we must ensure that we enter the trade below the market structure which is below the bearish candle that broke through the neckline
For the BRB,
We must have a glimpse of the fact that a market is going either bullish or bearish
Secondly, we should be able to draw the areas of support and resistance
Be patient to see the pullback and retest level before making a decision
And finally, look for an entry point with regards to the direction of the trend. One should be extra careful when trading the liquidity level with any of the strategies.
.png)
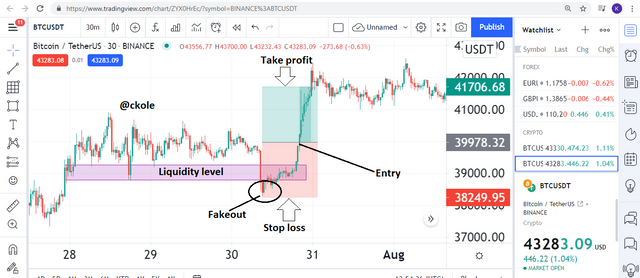
Once the liquidity level is noticed, a trader can use the BRB or the MBS strategy to set the stop loss and take profit level. The stop loss must be below or above the liquidity level as the case may be. Because fakeouts always happen a little below the liquidity level. If traders are targeted, and you as a person refuse to draw your stop loss reasonably below the liquidity level, the cup will definitely pass you when the institution guys pull their trigger to make the trend go against many retail traders that follow the trend with respect to the liquidity level
Question 4
Draw Liquidity levels trade setups on 4 Crypto Assets (Clear Charts Needed)
To trade the liquidity level, we can use either the BRB or MSB strategy. The aim is to have a positive outcome. Below are the 4 crypto assets.

BTC/USDT
The first image above is BTC/USDT pair followed by Troy/BnB below
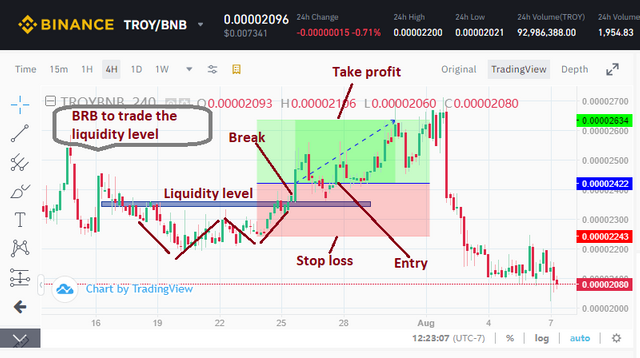
TROY/BNB

XVS/BNB
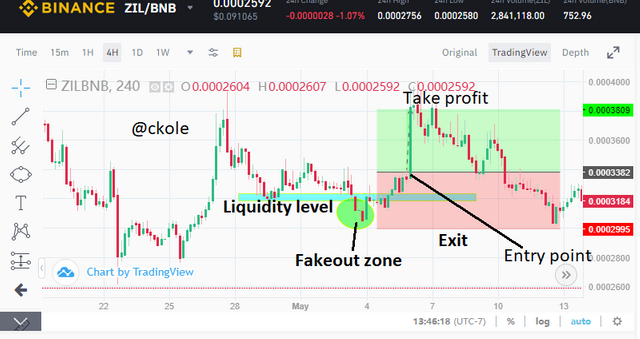
ZIL/BNB
If you trade liquidity level without putting the fakeout into consideration, then you are not trading based on liquidity level. Rather, it is based on support and resistance. Of course, support and resistance are very important because we cannot get the fakeout without drawing a line. However, our stop loss should base on the fakeout and not the support or resistance level
In the 4 images, I worked using the BRB strategy to set my stop loss and take profit with respect to where I think the breakout might want to kick me out of the market. If you check the last image, you would see that I moved with the trend after the reversal from the fakeout. There's no perfect strategy, but we can use our initiatives sometimes only if we've mastered the strategy and we are used to it
Conclusion
Many traders have been trading without knowing that they are being manipulated. The funniest part is that we retail traders are as plenty as locust while the institution folks or the market makers are scanty, but yet play us and make a huge profit from our losses. The earlier we understand this the faster we get out of market slavery.
And to say the fact, this is one of the secrets we need for us to have the knowledge of also outsmarting the market makers. We've gone through the lecture given by our professor @cryptocraze, where he enlightened us on trading liquidity level the right way in other not to fall victims to the whales. It's just all about using some strategies like the Break Retest Break (BRB) or Market Structure Break strategy to get the right entry and exit point without being affected by the fakeout paraded to suck retailer's fund.
It's nice having the time to participate in this lecture. It was a tough one, but very educative.
Let's not forget that we are just like a piece of pie in the trading industry compared to the brokers. We need to learn smart, act smart and reap fast.
Thanks for reading.
One love
CC: @cryptokraze