Crypto Academy Homework Task Season-2 Week-6 Post For @fendit
In the world of cryptocurrency and forex, there are several scopes, tools, and ways of reading and forecasting the market. The Elliott theory is one paramount way we can use to manage our assets. An American aqccountant and a author named Ralph Nelson Elliott came about the Elliott theory from observing the Dow theory. He studied and realized that the stock market can be a kind of repetition of which he was able to arrive at a conclusion.
Now, the first question.
What's the application of this theory?
Second question
What are impulse and corrective waves? How can you easily spot the different waves?
The impulse and corrective waves are both technical analyses used to decide the market flow. From what I learned from the tutorial by @fendit and some personal findings, I will explain what I understand on how they can be spotted.
The impulse wave explains 5 different categories.
Wave 5: Very small rush in the price caused by bullish traders that will, unfortunately, be buying an overpriced coin.
The corrective wave
As explained above, The corrective wave has 5 secretes, but only 3 is applicable in the case of corrective wave
We have the Zigzag, flat, and triangle. All these are the main parts that made up the corrective wave. They are the 3 wave pattern that moves in an opposite direction to the impulse wave.
The zigzag pattern is much known as the main part of the correctional patten, though there are other like patterns. It has just three waves labeled A, B, and C. The Zig zag pattern has a kind of consistent part. Every other pattern is coiled from the zig zag structure. The only difference is that the flat and triangle patterns have their waves and a way of identifying them. The A nd C waves are said to be a 5 ways impulses of which the wave B is regarded to be the smaller zigzag wave.
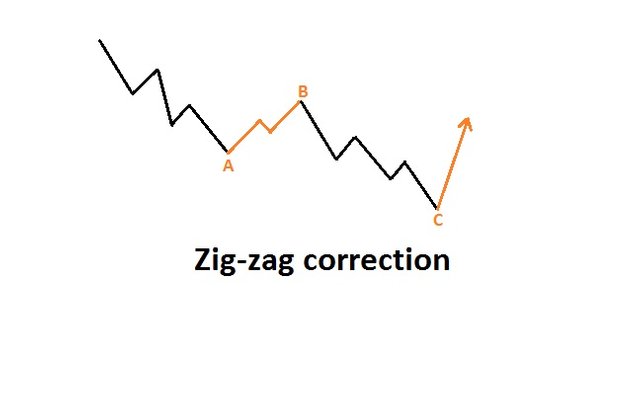
Source. My design
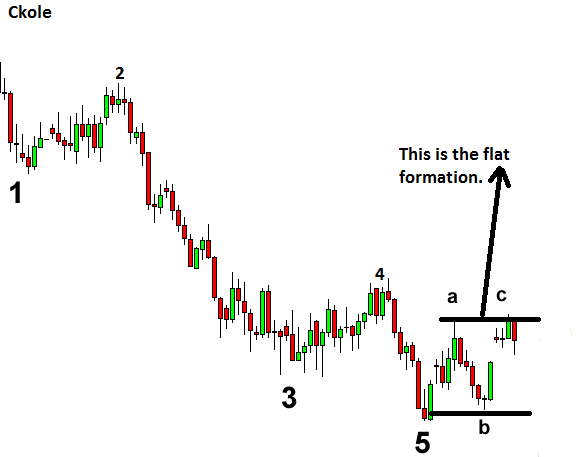
The flat wave pattern is a little bit easier to spot. If well noticed, we would discover that the wave has the same length, which always exceed the previous impulse. The flat pattern can be useful in such a way that trades must be opened along with the trend and also the wave C is completed inside the flat pattern or it's lower border.
The triangle pattern is always identified by observing the high and the low lines. It would be in a zigzag way, but the triangular pattern can be identified by tracing the lines and understanding the shape at which the market is moving. This pattern forms mostly in wave 4 or wave B in a zigzag manner. This pattern is useful in such a way that after the price of an asset bounces off the lower border on the triangular shape, it's a sign to buy (Meaning the market is going bullish.). Furthermore, when it goes off its upper border, It's a sign to sell. So, in a nutshell, the triangular pattern is helpful in predicting the ups and downs of an asset.
Well, my thoughts on this theory is based on the fact that Elliott did very intelligent research by extracting advanced concept from the bow theory. He further expands the theory and came up with something spectacular. The impulse and corrective patterns are good ways to analyze the market and know when and when not to enter the market.
Here, I selected the doge coin. From the image below, the green lines shows the zigzag movement pattern.
vbeebbbe.png)
The flat and triangular pattern was explained initially above.
.
The Elliott wave theory is a fantastic instrument created to help traders get the best out of their investment in the crypto and forex market. Though the concept is on ground, the result of its uses depends on the subjective interpretation of the trader or user. The more you understand how to use the tools, the better. Elliott did a great job by coming up with this theory. It's helpful, however, knowing and understanding it better is the key to success.
Thanks to @fendit for this lovely homework.
Thanks for reading.
CC
@steemcurator01
@steemcurator02
@trafalgar
@fendit
Thank you for being part of my lecture and completing the task!
My comments:
Your work was fine, but I believe you could have developed a lot more your answers. As well as that, the pattern's almost impossible to see in the chart, so I'm not that sure if you completelly got the concepts as I can barely see the mark you did on the waves.
Overall score:
4/10
Mohon tinjauan professor @fendit atas postingan saya yang sudah 2 hari
https://steemit.com/hive-108451/@nandacoa/steemit-crypto-academy-musim-2-minggu-6-or-or-teori-elliot-untuk-profesor-fendit
Thanks @fendit. I respect your decision.