Understanding Trends II Crypto academy S5W3|| Homework post for @reminiscence01

in SteemitCryptoAcademy3 years ago

Screenshot_20211204-084032_1.png

EXPLAIN YOUR UNDERSTANDING OF TREND REVERSAL. WHAT IS THE BENEFIT OF IDENTIFYING REVERSAL PATTERNS IN THE MARKET?

Trend reversal

Before talking about trend reversal, I would like to tell us about the meaning of trends. When we say a market is in a particular trend, which can be an uptrend or a down trend,, what we're saying in essence is that the market is moving upwards or downwards at that particular period. When it's in an uptrend, we say its bullish and when im a downtrend, we say its bearish.


Having laid down the meaning of trends, what then are trend reversal? Well, by simply looking at the words, you can see there are two words there, *trend* and *reversal*. Emphasis is placed on the second word, reversal. Reversal simply means to go back in the opposite direction as opposed to where you were moving to previously. Looking at the words again, Trend reversal, simply means the change in direction of a market trend. This can be from bullish to bearish or from bearish to bullish.


Benefits of identifying Trend reversal

This gives the trader an early information as to where the market is headed. It generally shows one the most likely trend of the market and therefore allows one the opportunity to be an early bird in the trend of the market. For instance, when one notices the trend reversal of a coin to the upside, he can simply enter a long position earlier with that information.


Protects one from buy an overly high price. Your ability to spot this will save you a lot. There are times when an asset price might have gotten to an all time high and a reversal is imminent, what most people will do here is to enter a short position. This is not always the case though, some people who FOMO, will buy at an astronomical price, without proper research or analysis and then gets trapped. Just like the case of Bitcoin when it first rose above 60k and the tumbled to about 30k, some were trapped and many had to sell at a loss.

Avoiding fake reversal

Well, not all reversals are what we expect, some might just be a temporary pullback. Some who may not understand this will hurriedly enter a short/long position and the gets trapped, bear trap or bull trap.


There are ways to avoid this though:

Take note of the trade volume: When a huge reversal is about to take place this is usually accompanied by huge buy or sell volumes. A fake reversal tends to have very little trade volume to be pull off a reversal of trend.


Patience is key, sometimes: Yeah this happens too, an experienced trader is not always in a hurry to get in and out of a trade at the slightest change. After you must have done your analysis, just hold on and trust what you've done. The news could help also. You might have made you analysis and it indicates that the market will be in an uptrend for a while and then the government or a very influencial individual makes a comment, which will definitely affect the price action. Take note what is being said and act accordingly.


Lastly, take a look at the overall trend: It might just be a pull back, who knows. For thr fact that a market is in an uptrend doesn't mean it will go in a straight line upwards, nope, that's not how it works. Looking at the market structure, you'll notice zigzags, but on a general terms, those zigzags move upwards. So if the overall trend is up and you see one of those zigzags, don't be worried, you're still in the right direction.

inCollage_20211203_213711257.jpg

GIVE A DETAILED EXPLANATION ON THE FOLLOWING TREND REVERSAL IDENTIFICATION AND BACK UP YOUR EXPLANATION USING THE ORIGINAL CHART. DO THIS FOR BOTH BULLISH AND BEARISH TRENDS (SCREENSHOTS REQUIRED).

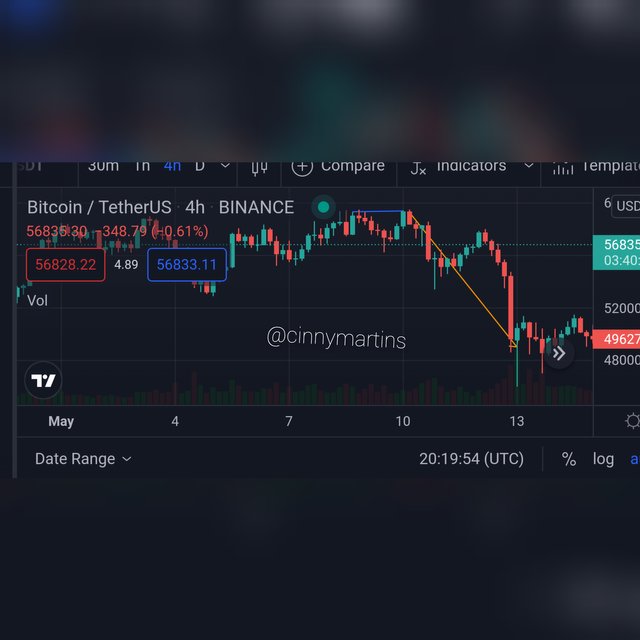
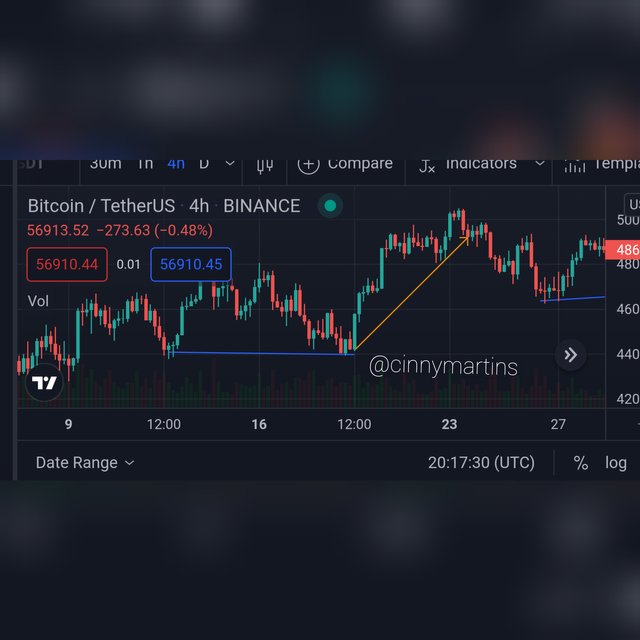
a) Break of market structure

What do we mean when we talk about market structure? Well a market forms a structure when it follows a particular trend for a sustainable time period. This can be an uptrend or a downtrend. The market structure for an uptrend show the candles( if its a candle stick chart) forming a higher high and lows while the market structure of a downtrend shows the formation of lower lows and highs. Following the aforementioned pattern is what makes a market structure.


So what does it mean to break the structure? Simple, don't follow the present structure. This means that for a break in a market structure that's in a bullish trend, instead of seeing a higher high, we tend to see a price break below the previous low, the candles fail to create a new high. This indicates weekness in the momentum driving the price and a reversal is most likely to happen.


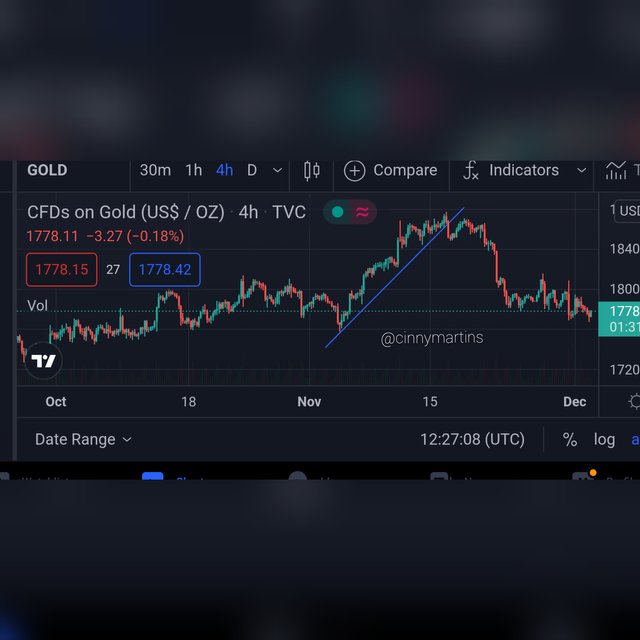
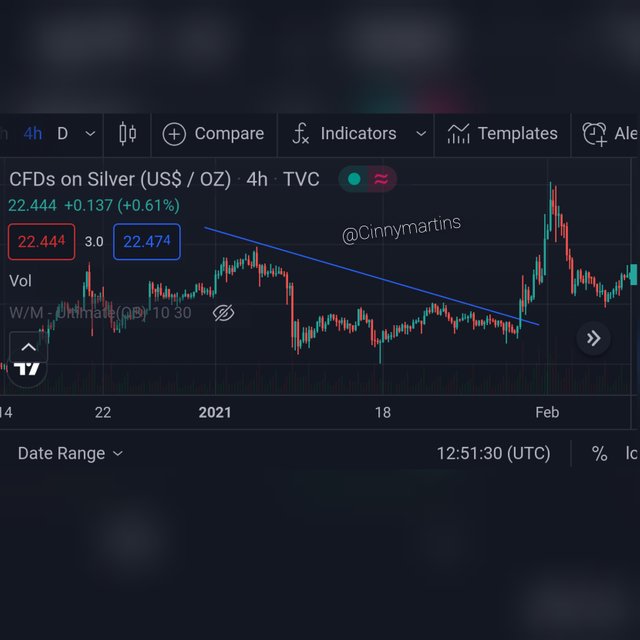
b) Break of trend line
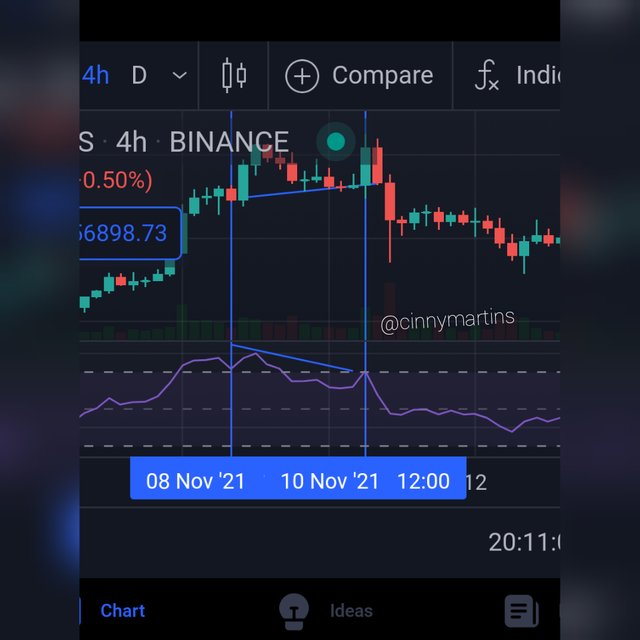
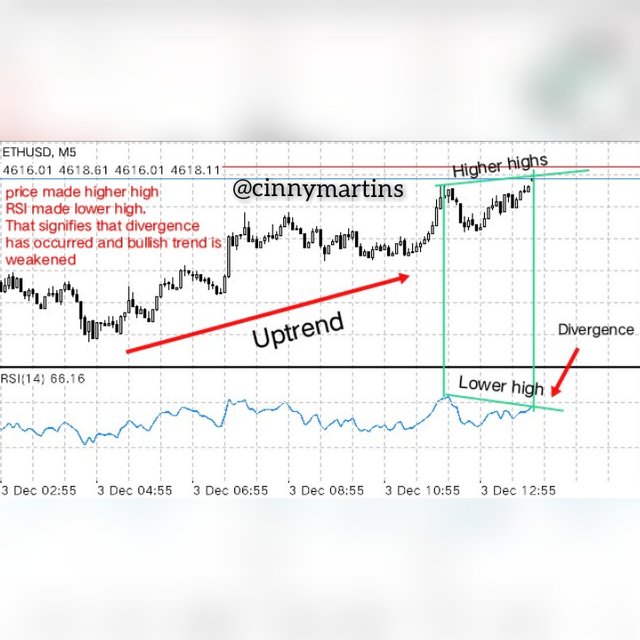
A trend line is a tool, a technical analysis tool that helps to show the overall direction of the market. A trend line can act as a support for an uptrend and a resistance for a downtrend. On reaching the trend line price tends to bounce back the opposite direction, but this is not always the case as we've come to learn about breaking of trend lines


When the price fails to break the trend line and then crosses then we refer to it as the break in trend line. This is another means by which traders know when to get in a trade. For instance, a trader might expect a trend to continue bouncing off the trend line, so he can simply enter a trade, long or short, just on top of the line, meanwhile, in the case of a breakout, then the trader can be sure that the price will move in the opposite direction. This is what is know as a reversal


Bullish reversal. Here we can see on the gold/USD chart, a four hour candle chart, that the price has been in an uptrend for some time now and has tested the trend line a few times until it finally broke out and reversed to to downside.

Bearish reversal in trend line. As seen, the price tested the trend line a few times before the weakening of the trend and eventually break out to the upside.


Divergence

I've come to understand that this means the price action and and indicator are giving off different signals. The indicator (mostly the relative strength index) is that which tends to give off the early trade signal that the price action will soon move in the opposite direction. For instance, a chart pattern might be showing higher highs but the indicator will be forming lower lows. The hidden message in this is that the buying power of the uptrend is getting weaker and the bears are about to take over. Many at times, this is true.


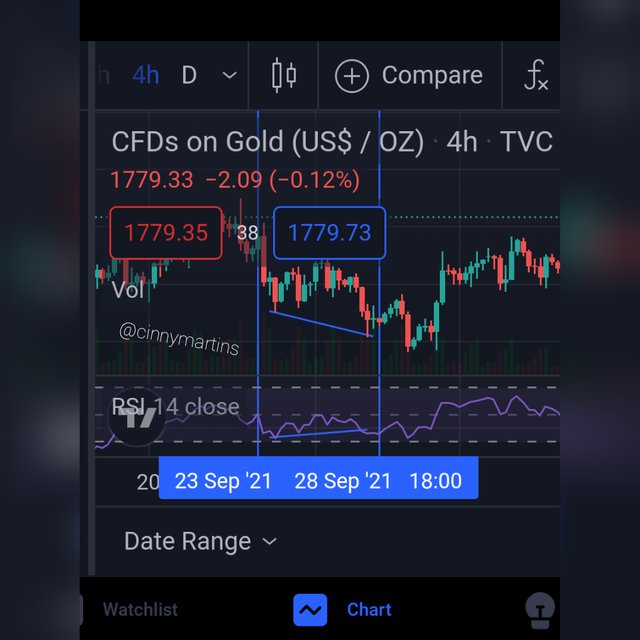
Bullish divergence. The price action of the chart and the indicator were giving different signals.The upper chart was creating lower lows while the indicator created higher highs. A clear signal that a reversal is imminent. After some time, the reversal actually occured. This is one of the importance of not using a single indicator as a standalone tool in trading.


Bearish divergence explained in a 4h chart.

Double tops and bottoms

Well this is simply a case where a trending market fails to make higher highs for an uptrend or lower lows for a downtrend. You can spot this when the price reaches the previous high and fails to break it which then gives the double top signal or when the price reaches the previous low and fails to go lower, giving the double bottom. This shows the weakening of a current trend and a reversal is imminent.


Double tops. Here we can see that the market failed to create a higher high than the previous high, indicating a weakness of the bulls to push the market higher, which eventually leads to the takeover of the market by the bears as we saw a downturn of the price. BTC/USD chart.
Double bottoms. Well this is the opposite of the double top but they both have similar idea behind their operation. We saw the failure of the market to create a new low and therefore reversed to the upside.


image.png

PLACE A DEMO TRADE USING ANY CRYPTO TRADING PLATFORM AND ENTER A BUY OR SELL POSITION USING ANY OF THE ABOVE MENTIONED TREND REVERSAL/CONTINUATION PATTERN.

image.png

My trade making use of divergence trend pattern

For this task, I chose to work with MT5 trading platform for on ETH/USD chart to identify divergence using the RSI indicator. As seen below, I entered a trade indicating my stop loss and take profit position.

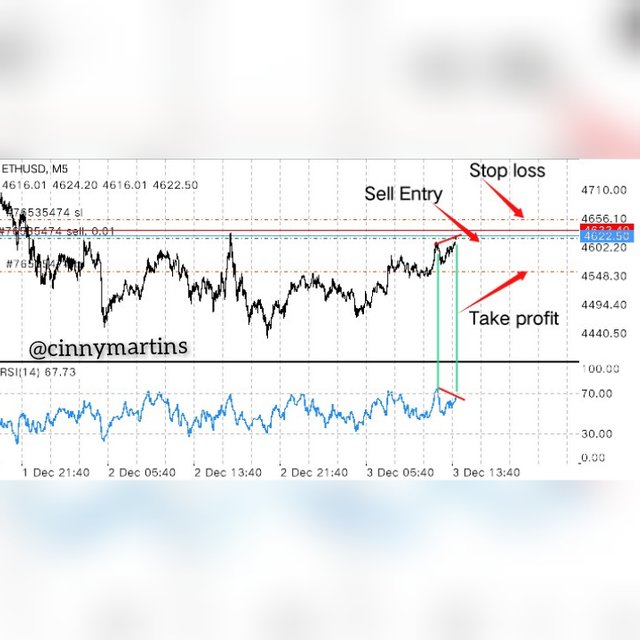
Here, I have my trade still with running with a reasonable profit made as you can see below.

PicsArt_12-04-08.30.23.jpg

PicsArt_12-04-08.30.59.jpg

image.png

Conclusion

image.png

So far so good, its been an awesome experience. I've learnt about trends, trend reversal and how to identify the trend reversal as well as to avoid fake trend reversal. I can now make trades with this patterns.

Now: All screenshots are derivatives of MT5 and Tradingview platform.

Sort:  

Hello @cinnymartins , I’m glad you participated in the 3rd week Season 5 of the Beginner’s class at the Steemit Crypto Academy. Your grades in this task are as follows:

CriteriaRatings
Presentation / Use of Markdowns2/2
Compliance with topic1/2
Spelling and Grammar1/1
Quality of Analysis1/2
Originality1.5/2
#Club50501/1
Total7.5/10


Recommendation / Feedback:

  • The student have completed the assignment for this lesson.
  • The student also answered all the questions in his/her own words.
  • Your overall presentation is good.
  • You have explained very well, but there are some confusions in your chart analysis.
  • Also, you didn't provide any chart analysis on break of market structure.
  • Please spend quality time to answer the questions and also pay attention to details.

Thank you for participating in this homework task.

Coin Marketplace

STEEM 0.18
TRX 0.16
JST 0.030
BTC 62539.28
ETH 2437.94
USDT 1.00
SBD 2.67