Trading Using Wedge Pattern- Crypto Academy / S5W5 - Homework Post for @sachin08
- Explain Wedge Pattern in your own word.
- Explain both types of Wedges and How to identify them in detail. (Screenshots required)
- Do the breakout of these Wedge Patterns produce False Signals sometimes? If yes, then Explain how to filter out these False signals.
- Show full trade setup using this pattern for both types of Wedges.( Entry Point, Take Profit, Stop Loss, Breakout)
- Conclusion

1. Explain Wedge Pattern in your own word.
When a wedge patter shows it typically indicates the consolidation of prices in a chart, as traders are trying to make a decision as to where next to move their trading pairs to, upside or the downside. See charts take their formation is a pretty common sights for traders and most will agree to have see a normal chart moving, when all of a sudden, it start tapering at one end, placing trend lines at the top and bottom points of that section will show you something that actually looks like a wedge, this is where the name came from. Yeah, I'm sure you must have seen this, novices might ignore, which they shouldn't, but experts take this seriously, as there's lots of potential in this formation.
So what is a wedge? Well it's simply a chart pattern like all other chart patterns, with its own characteristics. Characteristics? Well yeah, it's usually formed when a chart makes a higher low faster than when it makes a higher high( for an uptrend) and vise versa for a down trend, making it look like an arrow head. It's formed as a result of the indecision of traders and usually have to highs and lows bouncing off the support and resistance trendlines multiple times( at leaat more than 3 times).
This pattern is of two types, which we shall discuss later down the line, and then its formation could indicate a reversal of a trend or a simple correction of price, therefore a continuation. Its also important to note that there's usually a breakout accompanying this pattern and the breakout almost always the same size as the height of the pattern formed, regardless of the direction of the trend.
2. Explain both types of Wedges and How to identify them in detail. (Screenshots required)
As with most chart patterns, there are types of the wedge pattern we should take note of;
- Rising wedge
- Falling wedge
Rising Wedge

This sounds like a bullish kind of patten in theory but its quite the opposite (bearish) in practice, at least for most of the time.
Its characterized by the formation of a wedge at top to of an uptrend, you'll notice the price tapering at the top of the trend, when a trend line is placed, you might even see a cross between the upper trend line(resistance) and the lower one(support). There are also multiple bounces in between the trend lines as prices oscillates up and down.
So what information does this hold for the trader? Well this holds tow kinds of information, depending on the manner in which it was formed. For instance, if its formed at the top of an uptrend, then it most likely signals a trend reversal while if it forms in a downtrend, then, it might just be a pull back in the overall trend and price might just continue downwards.
How can one identify this pattern? The answer to this lies in the general characteristics of the Wedge Pattern, but this time you'll want to apply it for the rising wedge. Here are a few notable points
- Price tapper towards the upside as a result of the formation of higher lows faster than it forms higher highs.
- after the placement of trend lines, you can see there are multiple tests and retests of the support and resistance lines.
- Also take note of the trading volumes, it mostly shows a reduction in trade volume along the formation of the pattern, and in breakouts, the volumes mostly increases.
Falling Wedge

Well, you can only fall to the ground, I haven't heard when a person fell to the sky. Talking of falling wedge, this typically forms at the bottom of a down trend and its tappers to the down side, even when it forms in an uptrend. It too shows a consolidation of prices.
It has the same characteristics of the rising wedge, expect this time its in the opposite. This can also be referred to as the bullish wedge as the break out is almost always to the upside, bullish. This is especially true if its formed at the bottom of a bearish trend, but not so when it forms in the middle of an upward trend. In this case, we can simply say its just a retracement and price will still go up soon.
How to identify this pattern? Well its simply the opposite of the rising wedge which was discussed earlier. You should take note of the trading volumes, watch out for multiple tests along the tapering trendlines and you're good to go.
3. Do the breakout of these Wedge Patterns produce False Signals sometimes? If yes, then Explain how to filter out these False signals.
We are all humans and are prone to make mistakes from time to time. On the other hand, these trading platforms are like robots, everything they do is already programmed, so it might seem like they'll be always correct, well wrong. They were made by humans, whom I've shortly described earlier, and they can be wrong at times, giving false breakouts which could lead to loss.
Here are a few tips that might help you waver out the false breakouts, in the case of any:
Did you draw the pattern correctly? Yes this question is for you, you might have made a mistake in spotting this pattern, mistaking another for it, and therefore getting the wrong signals. Or as a novice, you didn't correctly draw a trend line that's tapering at the end with a few bunch of bounces along the trend line.
Be patient, trust your strategy. Experienced traders know this like the back of their palms. There are times when a pattern will look as though it's not going to be the right one, only for it to be a fake out and the trap those who rushed to enter a trade. You could also follow the general rule, that support turns into resistance, so wait for the breakout to bounce off the previous support/resistance, and then you can enter your trade.
Set stop loss orders. Even when you're so sure of your strategy, success is not 100% assured when it comes to trading, especially in cryptos. Most trading platforms will warn you of the risks involved in trading cryptos, and going into the trade means you are aware and accept it. Every trade has the possibility of incurring a loss, and this might just be that one. So set a stop order according to the loss you can bear. As You're trying to cut your losses, be sure to also grab all your profits made, set a take profit order too.
Going alone is not the best. Those were just some precautions, I think the best way to filter out fake outs in this pattern is to use it along side other technical indicators. Like using this pattern with the volumes of trades can give better insight as to where price will go.

False breakout in a wedge pattern, the false breakout indicated with a flag.
4. Show full trade setup using this pattern for both types of Wedges.( Entry Point, Take Profit, Stop Loss, Breakout)
Here's a full trade set up for both the rising and falling wedges indicating the entry level, the stop loss level and the take profit level. The entry level was after the breakout from the tapered end of both the rising and falling wedge.
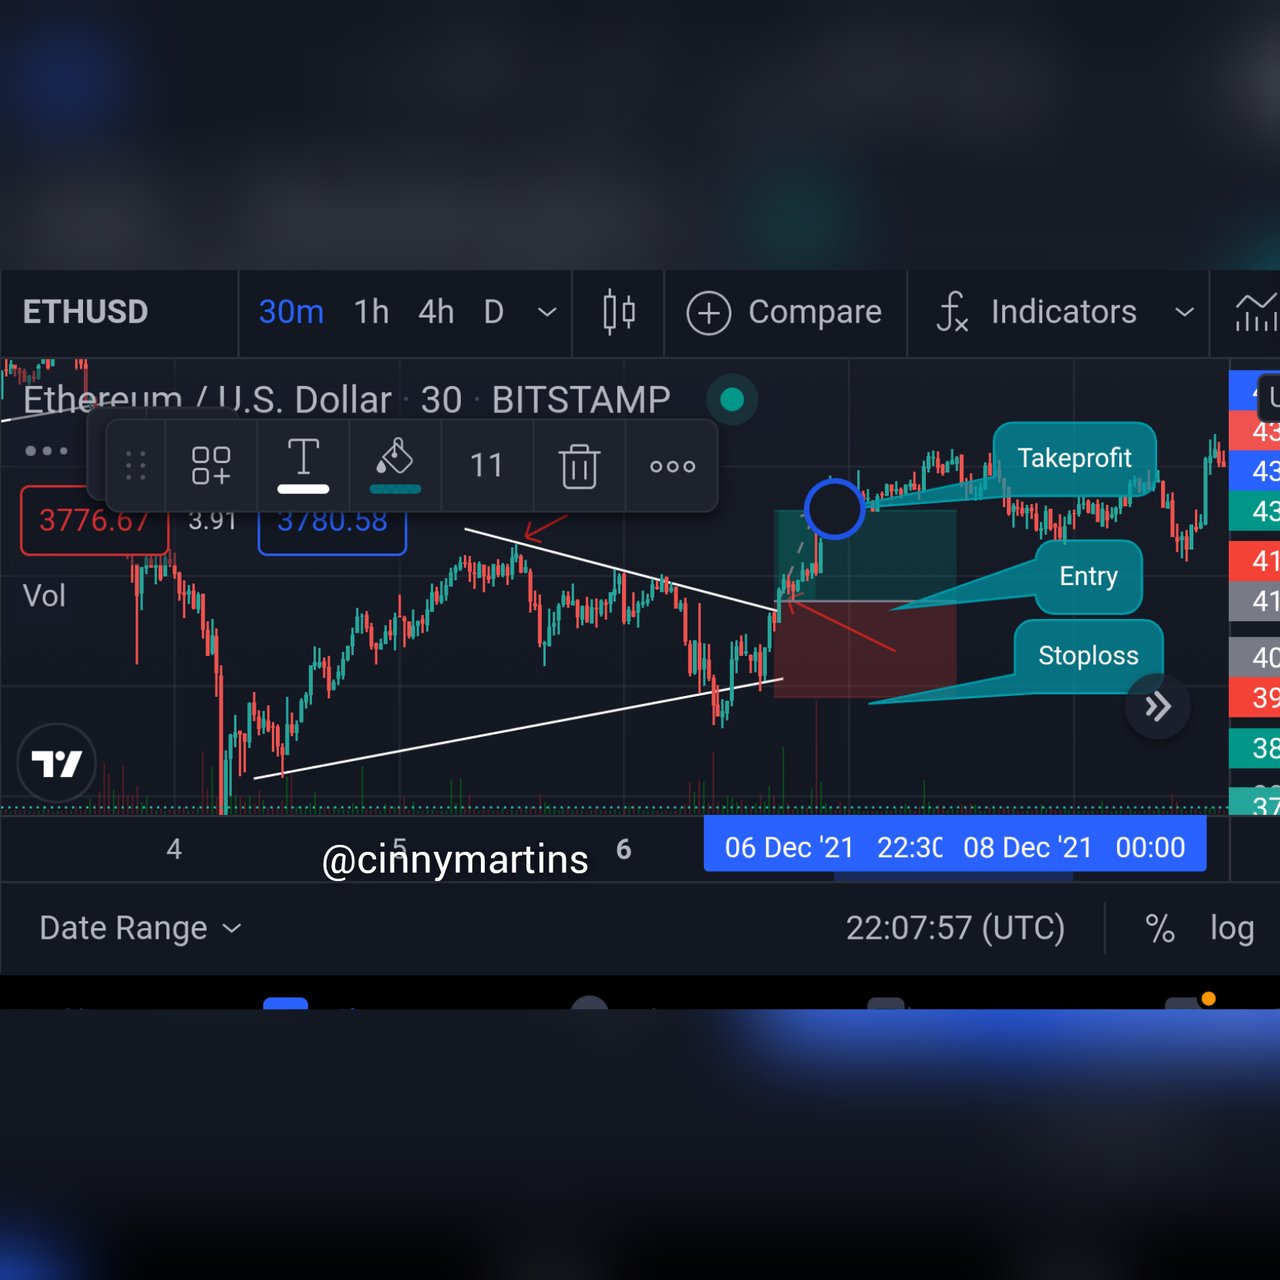
Falling Wedge Pattern indicating the entry, take Profit and stop loss levels.

Rising Wedge full trade set up indicating the entry level, take profit as well as the stop loss level.
5. Conclusion
Well, this lecture has tapered down to the end, we can say it's been a falling wedge, as we gradually went from the top, to this concluding section. The wedge pattern contains lots of information and opportunities in them, but only the skilled can harness them. Don't go alone, be patient, study the pattern carefully and draw correctly, these are the winning formula.
Thanks.
Cc;
@sachin08
Sort: Trending
Loading...